Carbon Management Index and Soil Organic Carbon pools of Different land use in Uttarakhand, Western Himalaya
Neha Tiwari
*
 and Namita Joshi
1
Department of Environmental Science,
Kanya Gurukul campus, Gurukul Kangri (Deemed to be University),
Haridwar,
Uttarakhand
India
http://dx.doi.org/10.12944/CWE.17.3.7
Copy the following to cite this article:
Tiwari N, Joshi N. Carbon Management Index and Soil Organic Carbon pools of Different land use in Uttarakhand, Western Himalaya. Curr World Environ 2022;17(3). DOI:http://dx.doi.org/10.12944/CWE.17.3.7
Copy the following to cite this URL:
Tiwari N, Joshi N. Carbon Management Index and Soil Organic Carbon pools of Different land use in Uttarakhand, Western Himalaya. Curr World Environ 2022;17(3).
Download article (pdf)
Citation Manager
Publish History

Introduction
The net global carbon dioxide (CO2) emissions significantly increased to 43.1 billion tonnes by 31.10 from 2010 to 2019. This increased CO2 concentration in the atmosphere exacerbates climate change1 ultimately causing a major ecological concern in the form of land deterioration. Agriculture contributes a massive 24% of total world CO2 emissions due to intense farming, forestry, land-use changes and poor farming management2. Therefore, it is important to establish strategies for minimizing carbon output and storing it in the environment. Soil organic carbon proves beneficial in determining soil quality assessment3. Soil carbon dynamics is essential as it regulates carbon cycle, thus considered as largest sink of organic carbon in the terrestrial ecosystem. Soil profile in the top 1m stored nearly 1200 to 1600 Pg global SOC, out of which Indian soil contains approximately 9 Pg C, with 33% of total SOC in the Himalayan region4. Although, SOC changes significantly and depends on soil characteristics, seasonality, and topography.
Due to modification in vegetation cover and coping strategies, landuse/land cover type has a tremendous repercussion on carbon fluxes via the input and output rate of soil biological materials5. Organic carbon is a continuum, thus categorized into different functional pools: Labile (active) and Non-labile (passive) pool, passive pool is sensitive due to its high turnover rate 6. However, non-labile pool is more persistent and forms organic compounds7. Consequently, labile SOC is considered better for evaluating landuse changes, whereas non-labile SOC contributes to total carbon stocks8. Cooler climatic areas have more organic as well as labile carbon because of slower mineralization rate. However, elevated soil temperatures and more soil erosion problem lowers the organic carbon level in hot and semi-moderate mountain ranges of India in contrary with moderate soils around the world9. Furthermore, optimum management strategies for balancing SOC level requires to validate and put into practice, specifically in regions having naturally poor soil fertility10.
Knowledge about SOC and CMI of varied landuse systems in hilly areas is essential for conserving productivity and reducing environmental impacts. To date, there is still a lack of study from north western himalayan region that are important in terms of carbon storage and also maintains soil-plant-atmosphere equilibrium. Thus, this study investigate SOC dynamics and CMI at the ecosystem level and also check how various indices fluctuates depth wise among varied landuse pattern.
Methodology
Features of the study area
Three distinct and contrasting landuse were identified from Champawat, Uttarakhand, India. Champawat comprises of sub–temperate climate and lies between 29°20'09.97" N and 80°05'27.70" E at a height of roughly 1615 meters above average sea level. All the site characteristics were elucidated in Table 1.
Table 1: Soil attributes of varied landuse
Landuse type | Location | Soil pH range | Soil textural class | Description | Management practices |
Mixed forest | Laluwapani, 29°20'13.11"N and 80°05'20.88"E.
| 5.2-5.5 | Fine loamy soil | Natural vegetation dominated by Oak and Pine tree species. | Anthropogenic disturbances for the purpose of collecting fuelwood and other non-timber forest products. |
Agricultural land | Madli, 29°20'40.64"N and 80°06'16.19"E. | 7.2-7.8 | Coarse and fine loamy soil | Field with organic manures growing wheat, maize, potatoes and cowpea. | Weeding and harvesting of above ground biomass regularly. |
Tea garden | Dudh pokhara, 29°18'36.66"N and 80°08'04.15"E. | 6.2-6.5 | Fine loamy soil | Field under tea plantation. | Weeding and periodic harvesting of above ground biomass. |
Soil sampling and analysis
5 independent samples (30 cm ×30 cm × 30 cm) were drawn to collect soil samples from various soil strata 0–15 and 15–30 cm during March – September. Different plant detritus and stones were separated manually. The fractions of soil were homogenized, crushed, sieved and kept in air tight bags at an ambient temperature for further analysis.
Soil organic carbon fractions
Both the carbon fractions were analyzed via wet oxidation diffusion method11 and labile carbon was also analysed12.
Carbon management index (CMI)
All-important indices were calculated using formula13. Furthermore, any changes occurring in carbon fraction influences CMI and CPI. The index is calculated as described:
Carbon Management Index (CMI) = CPI ×LI ×100
Carbon Pool Index (CPI) = Total Carbon of soil sample (mg/g)
Total Carbon of reference soil (mg/g)
Lability Index (LI) = Lability of Carbon in soil sample
Lability of Carbon in reference soil
Lability of C (L) = Carbon fraction oxidized by KMnO4
Carbon remaining unoxidized by KMnO4
Statistical analysis
Correlation coefficient (Pearson’s) method was applied between various carbon fraction, LI and CMI. Results of different landuse including soil strata on SOC, LI along with CMI was compared by ANOVA. Microsoft Excel and SPSS window version 22 were used.
Results
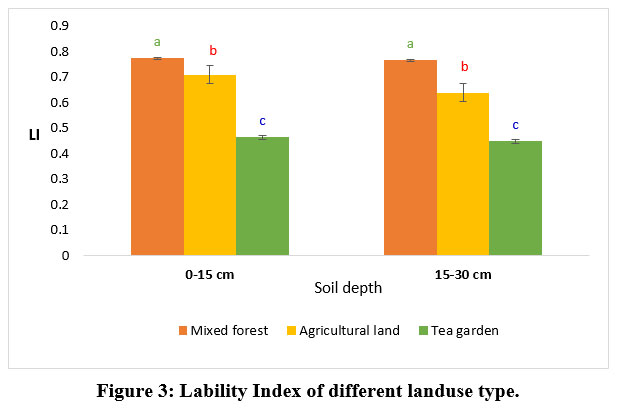
Mixed forest recorded the highest TOC in both surface and sub-surface layer which was markedly distinct (P < 0.05) in comparison to all other, apparently due to significant supply of leaf litter and root biomass from the native vegetation.However, tea garden recorded the lowest because of frequent soil disturbance and is presented in Fig.1 and Table 2. All landuse system exhibit higher POC value at 0-15 cm depth, indeed mixed forest recorded the highest value (Table 2 & Fig. 2). Although, least POC was observed in tea garden because of constant soil utilization, thus diminishing stability of organic matter. Labile (LC) and non-labile carbon (NLC) proportion witnessed a significant decrease with increasing depth in different systems. Labile pools are easily altered by various management practices and significant value of labile carbon in mixed forest occurs due to long term supply of readily decomposable plant debris all through the year.
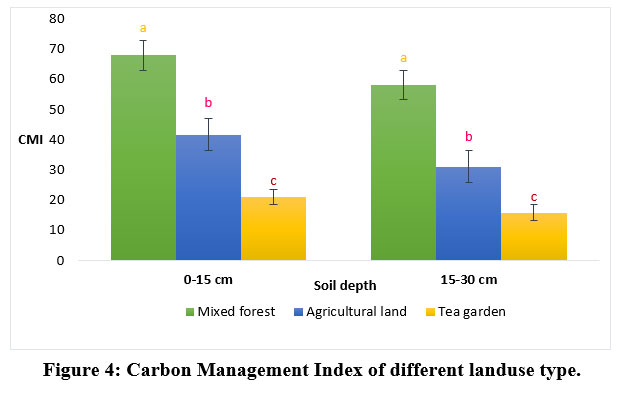
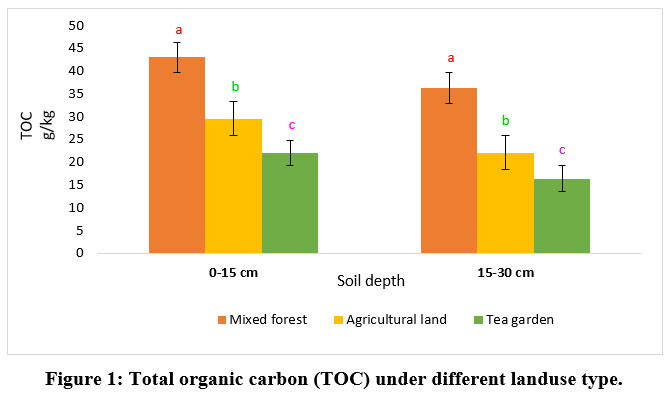
All the indices helped to evaluate the importance and amount of soil. Overall, a little difference in lability index was reported under mixed forest at 2 distinct soil strata (Table 2 & Fig. 3). Mixed forest showed maximum carbon pool index (0.88) followed by agricultural (0.59) then tea garden (0.47) in 0-15 cm depth. Highest CMI value (67.76) of mixed forest at surface layer indicates that the forest ecosystem of western Himalaya are sustainable to maintain soil organic carbon (Fig. 4). Incorporation of external carbon inputs to agricultural soil, a significant CMI value was also recorded at both the soil depth i.e. 41.89 and 31.36 respectively. The least CMI value was observed in tea garden (21.62 and 15.75) at successive soil depths probably because of erosive problems and inadequate management practice. Table 3 represents significant positive correlation among distinct carbon components studied.
 | Figure 1: Total organic carbon (TOC) under different land use type.
|
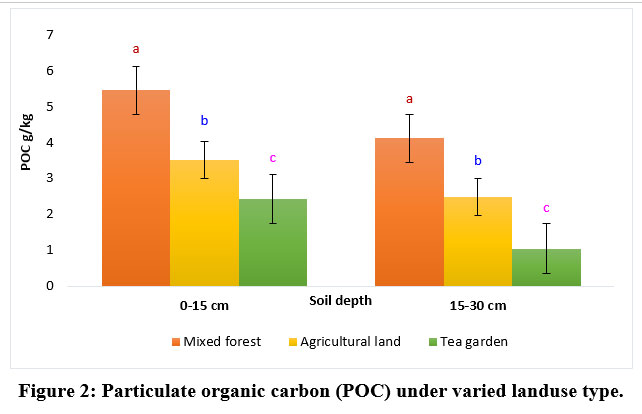 | Figure 2: Particulate organic carbon (POC) under varied land use type.
|
Table 2: Values of different carbon fractions of 3 landuse system at varying soil depth.
Landuse type | TOC | POC | LC | NLC | LI | CPI | CMI |
DEPTH (0-15 Cm) | |||||||
Mixed Forest | 43.0a | 5.45a | 3.12a | 13.5b | 0.77a | 0.88a | 67.76a |
Agricultural Land | 29.58b | 3.51b | 2.60b | 14.24a | 0.71b | 0.59b | 41.89b |
Tea Garden | 21.96c | 2.42c | 1.42c | 11.81c | 0.46c | 0.47c | 21.62c |
DEPTH (15-30 Cm) | |||||||
Mixed Forest | 36.3a | 4.12a | 2.93a | 13.1a | 0.76a | 0.77a | 58.52a |
Agricultural Land | 22.08b | 2.47b | 1.95b | 11.7b | 0.64b | 0.49b | 31.36b |
Tea Garden | 16.42c | 1.05c | 1.01c | 10.1a | 0.45c | 0.35c | 15.75c |
 | Figure 3: Lability Index of different land use type.
|
 | Figure 4: Carbon Management Index of different land use type.
|
Table 3: Correlation coefficient (Pearson’s) among various soil organic carbon fractions at various soil depth.
| TOC | POC | LC | NLC | LI | CMI |
| DEPTH (0-15 Cm) |
|
|
|
|
|
|
TOC | 1 |
|
|
|
|
|
POC | 0.99** | 1 |
|
|
|
|
LC | 0.93** | 0.92** | 1 |
|
|
|
NLC | 0.55 | 0.54 | 0.82** | 1 |
|
|
LI | 0.89** | 0.89** | 0.99** | 0.87** | 1 |
|
CMI | 0.99** | 0.99** | 0.95** | 0.63 | 0.93** | 1 |
DEPTH (15-30 Cm) |
|
|
|
|
|
|
TOC | 1 |
|
|
|
|
|
POC | 0.96** | 1 |
|
|
|
|
LC | 0.97** | 0.99** | 1 |
|
|
|
NLC | 0.96** | 0.99** | 0.99** | 1 |
|
|
LI | 0.88** | 0.97** | 0.96** | 0.98** | 1 |
|
CMI | 0.99** | 0.97** | 0.98** | 0.97** | 0.91**
| 1 |
** Correlation is significant at 0.01 level
Discussion
Native vegetation shows maximum TOC and tends to decrease depth wise 14. Also, several factors significantly affects the carbon dynamics of any system15. This study documented higher TOC in mixed forest that further effectively enhances the soil carbon storage. Our findings go in line with the study that higher density of roots of forest ecosystem leads to greater buildup of soil C16. Although, reduced TOC occurred due to higher disturbance and erosive problems17. Our data reported high POC value under mixed forest. Similar results were found in central Himalayan region18. On the other hand, various landuse recorded low POC because it does not form organocomplexes with minerals19. Active or labile carbon responds rapidly to any environmental changes thus considered as early or sensitive indicator of soil quality20. Indeed soil macro and mesofaunal activities stimulated labile carbon and furthermore releases CO2 on rapid oxidation21. Data confirmed high labile carbon under mixed forest in the surface layer. These findings affirms that higher percentage of labile carbon makes it easier to obtain mineralizable and quickly hydrolysable carbon22,23. Higher CMI and LI value reflects rehabilitation while lower value indicates degradation and depletion of C compounds24. Moreover, landuse with higher CMI proves effective for C sequestration and our study reported higher CMI in mixed forest. Furthermore, higher CMI value under bamboo plantation was also reported25. Also, lowest CMI value in soil stratum (0-20 cm) indicates that intensive soil management practices results in soil quality decline. CMI is a sensitive and helpful index for evaluating soil organic carbon dynamics over varied landuse26.
Conclusion
Study concludes that mixed forest, as compared to other landuse system accelerates the SOC fraction and stores maximum carbon component in the pedosphere. CMI along with all other carbon components was documented highest in mixed forest soil, thus considered the best management strategy for maintaining soil health and ensuring long-term fertility in the western Himalaya. Additionally, sustaining and re - establishing natural (mixed forest) ecosystem will strengthen soil condition and durability. Furthermore, CMI values of any landuse helps in prediction of soil erosion phenomenon, which is informative and useful for sloping land planning and potentially used to check runoff and land degradation challenges in hilly ecosystems. The outcomes of the present study provides a new dimension to landuse and conservation planning, agricultural area diversification, periodic replenishment of soil nutrients in the cultivated land and appropriate soil management strategies that could be useful for government and policy makers for sustainable use of Himalayan ecosystems.
Acknowledgement
The authors are thankful to the Department of Environmental Science, Kanya Gurukul campus, Gurukul Kangri (Deemed to be University), Haridwar, India for providing necessary lab facilities.
Conflict of Interest
The authors declares no conflict of interest.
Funding source
The authors received no financial support for the research.
References
- IPCC, C.C. The Physical Science Basis. 2007.
- Inter-Governmental Panel on Climate Change- Assessment Report 5. IPCC. 2014.
- Lehmann J, Kleber M. The contentious nature of soil organic matter. Nature. 2015; 528(7580):60–8. https://doi.org/10.1038/nature16069.
CrossRef - Bhattacharyya T, Pal D.K, Chandran P, Ray S.K, Mandal C, Telpande B. Soil carbon storage capacity as a tool to prioritize area for carbon sequestration. Curr Sci. 2008; 95:482–484.
- Poeplau C, Don A. Sensitivity of soil organic carbon stocks and fractions to different land-use changes across Europe. Geoderma. 2013; 192:189–201. https://doi.org/10.1016/j.geoderma.2012.08.003.
CrossRef - Haynes R.J. Labile organic matter fractions as central components of the quality of agricultural soils. Adv Agron. 2005; 85:221–268. https://doi.org/10.1016/S0065-2113(04)85005-3.
CrossRef - Wiesenberg G.L.B, Dorodnikov M, Kuzyakov Y. Source determination of lipids in bulk soil and soil density fractions after four years of wheat cropping. Geoderma. 2010; 156:267–277. 10.1016/j.geoderma.2010.02.026.
CrossRef - Vieira F.C.B, Bayer C, Zanatta J.A, Dieckow J, Mielniczuk J, He Z.L. Carbon management index based on physical fractionationof soil organic matter in an Acrisol under long-termno-till cropping systems. Soil Till. Res. 2007; 96:195–204.
CrossRef - Kumar R, Rawat K.S, Singh J, Singh A, Rai A. Soil aggregation dynamics and carbon sequestration. J. Appl. Nat. Sci. 2013; 5:250–267. https://doi.org/10.31018/jans.v5i1.314
CrossRef - Manna M.C, Bhattacharyya P, Adhya T.K, Singh M, Wanjari R.H, Ramana S, Tripathi A.K, Singh K.N, Reddy K.S, Subbarao A, Sisodia R.S, Dongre M, Jha P, Neogi S, Roy K.S, Rao K.S, Sawarkar S.D, Rao V.R. Carbon fractions and productivity under changed climate scenario in soybean–wheat system. Field Crops Res. 2013; 145:10–20. 10.1016/j.fcr.2013.02.004.
CrossRef - Snyder J.D, Trofymow J.A. A rapid accurate wet oxidation diffusion procedure for determining organic and inorganic carbon in pot and soil samples. Commun Soil Sci Plant Anal. 1984; 15:587-597.
CrossRef - Cambardella C.A, Elliot E.T. Particulate organic matter changes across a grassland cultivation sequence. Soil Sci Soc Am J. 1992; 56:777-783.
CrossRef - Blair G.J, Lefroy R.D, Lisle L. Soil carbon fractions based on their degree of oxidation, and the development of a carbon management index for agricultural systems. Aust. J. Agric. Res. 1995; 46(7):1459–1466.
CrossRef - Piano J.T, Rego C.A.R.D.M, Vengen A.P, Egewarth J.F, Egewarth V.A, Mattei E, Oliveira P.S.R.D, Herrera J.L.D. Soil organic matter fractions and carbon management index under integrated crop-livestock system. Bioscience. 2020; 36(3):743-760. 10.14393/BJ-v36n3a2020-47702.
CrossRef - Lal R. Sequestration of Atmospheric CO2 in Global Carbon Pools. Energy Environ. Sci. 2008; 1:86–100. https://doi.org/10.1039/b809492f.
CrossRef - Paes E.D.C, Dias F.P.M, Fernandes I.O, Pereira E.G, Leite E.D.S, Lima J.M.D, Nobrega J.C.A. Carbon Management Index and Carbon Stock of a cohesive oxisol under different in the region Northeast of Brazil. J Agric Sci. 2018; 10(9):284–291. 10.5539/jas.v10n9p284.
CrossRef - Guimaraes D.V, Gonzaga M.I.S, Neto J.O.M. Management of soil organic matter and carbon storage in tropical fruit crops. R. Bras. Eng. Agric. Ambiental. 2014; 18(3):301–306. 10.1590/S1415-43662014000300009.
CrossRef - Kalambukattu J.G, Singh R, Patra A.K, Arunkumar K. Soil carbon pools and carbon management index under different land use systems in the Central Himalayan region. Acta Agriculturae Sc and Sect B Soil Plant Sci. 2013; 63(3):200–205. https://doi.org/10.1080/09064710.2012.749940.
CrossRef - Pant P.K, Ram S, Bhatt P, Mishra A, Singh V. Vertical distribution of different pools of soil organic carbon under long-term fertilizer experiment on rice-wheat sequence in mollisols of North India. Commun Soil Sci Plant Anal. 2020; 52(3):235–255. 10.1080/00103624.2020.1859527.
CrossRef - Sahoo U.K, Singh S.L, Gogoi A, Kenye A, Sahoo S.S. Active and passive soil organic carbon pools as affected by different land use types in Mizoram, Northeast India. Plos One. 2019; 14(7). https://doi.org/10.1371/journal.pone.0219969.
CrossRef - Sruthi S.N, Ramasamy E.V. Enrichment of soil organic carbon by native earthworms in a patch of tropical soil, Kerala, India: First report. Sci. Rep. 2018; 8(5784). https://doi.org/10.1038/s41598-018-24086-8.
CrossRef - Zhang L, Chen X, Xu Y, Jin M, Ye X, Gao H, Chu W, Mao J, Thompson M.L. Soil labile organic carbon fractions and soil enzyme activities after 10 years of continuous fertilization and wheat residue incorporation. Sci. Rep. 2020; 10(11318). 10.1038/s41598-020-68163-3.
CrossRef - Kumar A, Dwivedi G.K, Tewari S, Sah V.K, Singh H, Kumar P, Kumar N, Kaushal R. Soil organic carbon pools under Terminalia chebula Retz. Based agroforestry system in Himalayan foothills, India. Curr. Sci. 2020; 118(7):1098–1103. https://doi.org/18520/cs/v118/i7/1093-1098.
CrossRef - Debnath S, Attr B.J, Kumar A, Kishor A, Narayan R, Sinha K, Bhowmik A, Sharma A, Singh D.B. Influence of peach (Prunus persica Batsch) phenological stage on the short-term changes in oxidizable and labile pools of soil organic carbon and activities of carbon-cycle enzymes in the North-Western Himalayas. Pedosphere. 2020; 30(2):1–13.
CrossRef - Kaushal R, Tewari S, Thapliyal S.D, Kumar A, Roy T, Islam S, Lepcha S.T.S, Durai J. Build-up of labile, non-labile carbon fractions under fourteen-year-old bamboo plantations in the Himalayan foothills. Heliyon. 2021; 7. 10.1016/j.heliyon.2021.e07850.
CrossRef - Ghosh B.N, Meena V.S, Singh R.J, Alam N.M, Patra S, Bhattacharyya R, Sharma N.K, Dadhwal K.S, Mishra P.K. Effects of fertilization on soil aggregation, carbon distribution and carbon management index of maize-wheat rotation in the north-western Indian Himalayas. Ecol. Indic. 2018:1–10. https://doi.org/10.1016/j.ecolind.2018.02.050.
CrossRef


