Economic Evaluation of Yeldur Nala Sub - Watershed Project in Kolar District of Karnataka
Meghana J
*

1
Department of Agricultural Economics,
University of Agricultural Sciences,
GKVK,
Bangalore,
Karnataka
India
http://dx.doi.org/10.12944/CWE.17.3.27
Copy the following to cite this article:
Meghana J. Economic Evaluation of Yeldur Nala Sub - Watershed Project in Kolar District of Karnataka. Curr World Environ 2022;17(3). DOI:http://dx.doi.org/10.12944/CWE.17.3.27
Copy the following to cite this URL:
Meghana J. Economic Evaluation of Yeldur Nala Sub - Watershed Project in Kolar District of Karnataka. Curr World Environ 2022;17(3).
Download article (pdf)
Citation Manager
Publish History

Introduction
Agriculture in India is the major sector for economy, which depends highly on natural resources such as soil, watershed and vegetation. Nearly three fourths of the cultivated land is depending on monsoon, which is contributing about 42 per cent of the agriculture production in India (Anonymous, 2012).India receives annual precipitation of an average of 4,000 billion cubic meters (approximately 1183 mm rainfall) of which, only 48 per cent is available in surface and ground water entities of India (Anonymous, 2017). The scarcity and volatility of water availability has created pre and post production risk in Indian agriculture.
To fullfill the demands of the rising population, the conservation, utilization and up gradation of water on the scientific theories is essential along with the sustainability of dry land agriculture. This can be achieved by two alternative solutions, one is to bring all the rainfed areas under irrigation, which could not cover even 50 per cent of area cultivated. Second alternative is enhancing crop production in dry areas by promoting watershed technology. A watershed is a hydrologically referred as any surface area from which runoff resulting from water flow and is drained to a common point. Drought Prone Area Development Programme, Desert Development Programme and Integrated Wasteland Development Programme have been framed under one programme named Integrated Watershed Management Programme. It is a centrally sponsored program where the centre and state shared 90:10 ratio up to 2014-15. After 2015-16 IWMP was relabelled as Pradhan Mantri Krishi Sinchayee Yojana- Watershed Development (PMKSY-WD) where state and centre share is in the ratio of 40:60 (Anonymous, 2015).
Kolar district of Karnataka stands fourth under Rainfed Area Prioritization Index with erratic and uneven rainfall. The area under rainfed crops ranged from 74 to 85 per cent of the cultivated area. The mean annual rainfall is around 776 mm (ranging from 680 to 890) (Anonymous, 2018). Kolar being a water stressed area, facing major problems like, migration, degradation of lands, low productivity of farm lands, depletion of ground water resources, degraded soil, marginal/small farmers and fragmented land holdings, and less alternative income. In this regard, the rationale for watershed approach in rainfed agriculture areas is a way forward for the effective and efficient usage of natural resources by developing and managing them on a sustainable basis. This study sheds light on, how the selected watershed project helps in in- situ soil moisture conservation and rain water harvesting to augment ground water resources, crop production, development of pasture , livestock, fodder management and income-generation activities in a participative manner by involving the local communities that help in conserving these resources and the major constraints faced by the implementing agency and beneficiaries during implementation of the watershed projects in the study area with the following objectives.
- To record the activities taken up under Yeldur Nala Sub - Watershed Project in the study area.
- To evaluate the economic benefits derived from Yeldur Nala Sub - Watershed Project in the research area.
- To determine the major constraints faced by the implementing agency and beneficiaries during implementation of the watershed project in the research area.
Methodology
The research area
The present research was undertaken in Srinivaspur taluk of Kolar district of Karnataka state. According to the agro-climatic zones, the area is classified as a "eastern dry zone (zone 5)." Srinivaspura taluk is one among the five taluks of Kolar district which is 24 km away from the district and was reported in having a wide variation in distribution and pattern of rainfall over the years.
The study method
For the study, a purposive sample technique was used. In the primary level, Kolar district was selected based on Rainfed Area Prioritization Index (RAPI). In line with the goals of the research and consultation with Watershed Development Department Bengaluru, Karnataka, Yeldur nala sub watershed project under Pradhan Mantri Krishi Sinchayi Yojana-Watershed Development(PMKSY-WD) in Sri nivaspura taluk of Kolar district was selected, as most of the watershed activities were completed in that area. Totally 60 sample farmers were selected, of which 30 beneficiaries of watershed project and 30 non beneficiaries were randomly selected from Yedrur and Beeraganahalli villages in the study area, where in each village includes 15 beneficiaries and 15 non beneficiaries. Primary Data on socio-economic features, cropping pattern, allied activities, economic impact of the major interventions undertaken through Yeldur nala sub watershed project collected from the sample farmers through pre-tested schedule.
Statistical tools
Crop diversification Index
Simpsons Diversity Index (SDI) is often used index for measuring crop diversification in a particular geographical area and is employed to calculate crop diversification in study area using – the formula given below
.jpg)
Here, Ji = Am / ? Am is the proportion of the mth activity in acreage.
A Simpson index value nearing zero, indicates that the area is near to the specialization in cultivating a particular crop and if value is near to one, then the region is completely diversified in terms of crops. (Debasiset al. 2017)
Cost and Returns
The cost and returns of major cultivated crops were analysed by using cost concepts- Cost A, Cost B and Cost C.(Susheelaet al. 2016)
Gross income = (Quantity of main product × Price of main product)
Net income (NI): = Gross income – Total expenditure
Garrett’s Ranking
Garrett’s Ranking analytical tool was adopted to rank the constraints faced by beneficiaries during the implementation of watershed programme in study area. Constraints for the study area were listed by taking opinions of the sample farmers and with regard to the various studies undertaken in the similar field. For constraints faced by beneficiaries each of the sample farmer was requested to rank the listed six constraints from one to six. In this technique, rank one signify most important one and rank six signifies least important aspect. Rank allotted to every constraint by each respondent was converted into per cent position with the formula,
Per cent position = 100*(Mhg-0.50) /Ng
Where,
Mhj depicts for rank given for the ith factor (h= 1, 2……6) by the j th individual (g = 1, 2 …..50)
Ng stands for the number of variables that each individual has ranked.
The per cent place of every rank was converted to scores by using the table given in Garrett and Woods worth (1969). For every constraint the scores of individual respondents were added and divided by the total number of sample farmers from whom scores were added. Finally, the six limitations were ranked by giving ranks 1, 2, 3,..., 6 in descending order of the mean scores.
Result and discussion
Out of the total sample respondents, 8 farmers were benefitted with Farm Pond, 29 farmers benefitted with trench cum bund, which helps to conserve soil and water in the field. 17 of them were benefited from Dry land horticulture i.e. provided with mango seedlings, 14 were benefited by Agro forestry i.e. provided with silver oak seedling, along with these 13 and 17 farmers participated in Fodder production promotion and animal health camp respectively. Four of the farmers were self help group (SHG) members had undergone training of income generation activity conducted by implementing agency (Table 1).
Table 1: Watershed intervention activities extended to sample farmers in the study area under Yeldur Nala Sub - Watershed Project.(number).
Sl. No. | Activities | Number of |
1 | Farm ponds | 8(7.54)
|
2 | Field bunds | 1(0.94) |
3 | Trench cum bund | 29(27.36)
|
4 | Dry land horticulture (Mango seedling) | 17 (16.04) |
5 | Agro forestry (Silver oak seedlings) | 14(13.21) |
6 | Fodder production promotion | 13(12.26) |
7 | Participation in the animal health camp | 17(16.04) |
8 | Annual and Perennial fodder minikits | 3(2.83) |
9 | Training and income Generation activity | 4(3.77) |
Note: Figures in the parenthesis represent per cent to total sample.
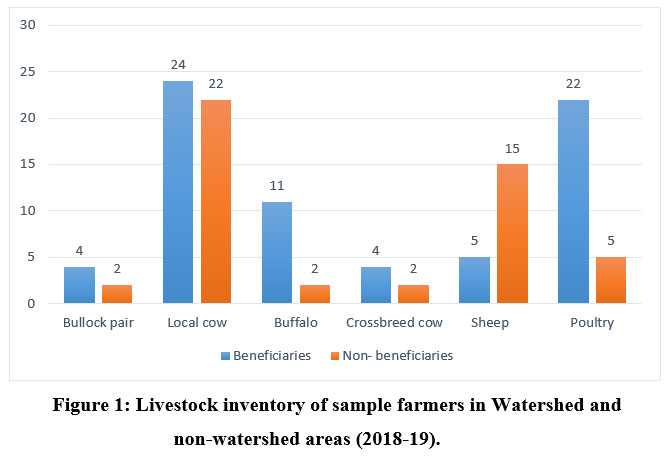
The livestock inventory of the sample farmers revealed that in watershed area 30 per cent of sample farmers owned local cows, 16 per cent owned buffalo and around 6 per cent of farmers had bullock pairs. Sheep and poultry were owned by 3 and 6 per cent of sample farmers respectively. Similarly, in non - watershed area 30 per cent of farmers owned local cows, 5 per cent owned buffalo and 5 per cent of farmers had bullock pairs. Sheep and poultry were owned by 10 and 5 per cent of farmers respectively (Table 2).
Table 2: Livestock inventory of sample farmers in Watershed and non-watershed areas(2018-19).
Sl. | Livestock | Yeldur Nala Sub - Watershed Project | |
Beneficiaries | Non – | ||
1 | Bullock pair | 4(6.66) | 2(5.00) |
2 | Milch animals |
|
|
a | Local cow | 24(30.00) | 22(30.00) |
b | Buffalo | 11(16.66) | 2(5.00) |
c | Crossbreed cow | 4(6.66) | 2(5.00) |
3 | Sheep | 5(3.33) | 15(10.00) |
4 | Poultry | 22(6.66) | 5(5.00) |
Note: Figures in parentheses represents percentage of number of sample respondents owning asset.
Percentage of farmers owning cattle is comparatively high in watershed area than non - watershed area due to watershed interventions activities. Same results were observed in the study taken by Painuliet al. (2014) in Jaisalmer District of Rajasthan, where farmers under watershed project had more livestock compared to non-watershed farmers (Table 2).
 | Figure 1: Livestock inventory of sample farmers in Watershed and non-watershed areas (2018-19).
|
Ragi and tomato were the major sole crops grown with 21.40 and 6.65 per cent of gross cropped area(GCA)[1] respectively and mango crop was grown with 41.07 per cent of GCA and silver oak under agro forestry with 1.81 per cent of the GCA. Pigeon pea and field bean intercrop with ragi was cultivated under 15.04 per cent of GCA Whereas in non-watershed area ragi was grown as a main field crop with 36.42 per cent and ragi intercrop with field bean 25.43 per cent of the overall cultivated area. Mango was with 15.44 per cent of GCA and Cropping Intensity of farmers in watershed area was 170.29 per cent higher than non- watershed area(137.45 %).
Simpsons index is higher in watershed area (0.85) than non - watershed area (0.77) which indicates more crop diversity in watershed area compared to non water shed area, this may be because of increased water availability and improved soil fertility due to watershed activities in the study area. The study conducted by Palinisamiet al. (2011) also revealed similar results where cropping pattern and cropping intensity were influenced by watershed interventions which resulted in improved soil health and moisture holding capacity of soils (Table 3).
Table 3: Cropping pattern of sample respondents in the research area . (2018-19)
Sl. | Crops | Beneficiaries | Non-Beneficiaries | ||
Area | Percentage | Area | Percentage | ||
I | Sole crop | ||||
1 | Ragi | 37.00 | 21.40 | 20.05 | 36.42 |
2 | Pigeon pea | 4.00 | 2.31 | 0.00 | 0.00 |
3 | Horse gram | 5.00 | 2.89 | 1.50 | 2.72 |
4 | Paddy | 0.00 | 0.00 | 0.00 | 0.00 |
5 | Ground nut | 0.00 | 0.00 | 0.00 | 0.00 |
6 | Tomato | 11.50 | 6.65 | 5.50 | 9.99 |
7 | Capsicum | 1.00 | 0.58 | 0.00 | 0.00 |
8 | Onion | 2.00 | 1.16 | 0.00 | 0.00 |
9 | Mulberry | 2.50 | 1.45 | 1.00 | 1.82 |
10 | Chilli | 1.75 | 1.01 | 0.00 | 0.00 |
11 | Knol-khol | 0.00 | 0.00 | 0.00 | 0.00 |
II | Intercrop | ||||
1 | Ragi + field bean | 6.00 | 3.47 | 14.00 | 25.43 |
2 | Ragi + pigeon pea + | 26.00 | 15.04 | 4.50 | 8.17 |
III | Perennials | ||||
1 | Mango | 71.00 | 41.07 | 8.50 | 15.44 |
2 | Silver oak | 3.13 | 1.81 | 0.00 | 0.00 |
IV | GCA (acres) | 172.88 | 100.00 | 55.05 | 100.00 |
V | NCA (acres) | 101.00 |
| 40.05 |
|
VI | CI (%) | 170.29 |
| 137.45 |
|
VI | Simpson’s Index | 0.85 |
| 0.77 |
|
Note: GCA- Gross Cropped Area, CI- Cropping Intensity, NCA-Net Cropped Area.
Table 4: Production and productivity of major crops cultivated by beneficiaries and non-beneficiary sample farmers under Yeldur Nala Sub - Watershed Project.
Sl. No. | Crops | Watershed area | Non-watershed area | Difference in productivity (quintals/ac) | ||||
Total area (acre) | Production (quintals) | Productivity (quintals/ acre) | Total area (acre) | Production (quintals) | Productivity (quintals/ac) | |||
1 | Ragi | 37.00 | 378.14 | 10.22 | 20.05 | 134.93 | 6.73 | (3.48) 34.09 |
2 | Tomato | 11.50 | 1469.93 | 127.82 | 5.50 | 643.11 | 116.93 | 10.89 (8.51) |
3 | Horse gram | 5.00 | 34.90 | 6.98 | 1.50 | 6.75 | 4.50 | (2.48) 35.53 |
4 | Mango | 71.00 | 3288.72 | 46.32 | 8.50 | 272.34 | 32.04 | (14.32) 30.92 |
Note: figures in the parenthesis indicates Difference in productivity percentage.
Production of the main cultivated crops in the watershed area observed higher compared to non-watershed area. The productivity of major crops cultivated was higher in watershed beneficiaries compared to non- beneficiaries and difference in productivity was higher in Mango with 14.32 quintals/ac followed by tomato (10.89 quintals/ac). The production and productivity of mango was higher in watershed area when compare to non-watershed area due to distribution of mango seedlings in the watershed area with percentage change in productivity 30.92. There is considerable increase in productivity of all the crops, where higher per cent increase was in horse gram and ragi with 35.53 and 34.09 per cent respectively, due to watershed interventions like farm pond, trench cum bund, check dam and nala bund which increased water availability and further increased yield in the watershed area (Table.4.). The study conducted by Thakur et al. (2014) reported that on an average production and productivity of different crops was found to be increased after the implementation of project.
It was found that the overall cost of cultivation was greater per acre in watershed farmers compared to control group and it was higher in tomato crop with Rs.83977 and Rs.77545 in watershed and non-watershed area respectively and it was lower for horse gram with Rs.23164 and Rs.20641 respectively. The gross returns per acre was also observed higher in watershed beneficiaries compared to non-beneficiaries and it was higher in tomato with Rs.198627/acre Rs.142623/acre respectively. The net returns were higher in watershed area compared to non watershed area and was observed higher in tomato Rs.114650 and Rs.65078 respectively and lower in horse gram Rs.10102 and Rs.4866 respectively (Table 5). These results are in line with findings of Nirankusha (2015) where he reported that per acre respective crop gross and net return received by watershed farmers was substantially greater than that of non-watershed farmers this was because of water and soil conservation activities which enhanced yield of crops.
Net returns per rupee of expenditure was calculated to be higher in watershed area when compared to non -watershed area and was observed higher in tomato (Rs.2.37 and Rs.1.84 respectively) and lower in horse gram (Rs.1.41 and Rs.1.24 respectively) because of improved yield by watershed interventions which further increased net returns of crops.
Table 6 depicts Annual Income of sample farmers in the research area. The study shown that net returns for all crop was higher in watershed area (Rs. 240682) when compare to non-watershed area (Rs.126922) with difference in income of (Rs.113759) which is 47.27 per cent higher than non-watershed area, this is due to soil and water conservation activities like farm pond, trench cum bund, check dam and nala bund increased soil fertility which further enhanced crop yield and farm income. Similar findings were reported by Nirankush (2015) in his study (Table 6).
Table 5: Cost and returns of major crops cultivated by beneficiary and non-beneficiary sample farmers Yeldur Nala Sub - Watershed Project.(Rs/acre)
SI.No. | Crop | Ragi+ Field bean | Ragi+ Field bean+ pigeon pea | Ragi | Horse gram | Tomato | |||||
B | N-B | B | N-B | B | N-B | B | N-B | B | N-B | ||
1 | TVC | 20566 | 18696 | 24492 | 21813 | 19103 | 17223 | 13924 | 12270 | 64077 | 60079 |
2 | TFC | 8490 | 7797 | 8490 | 7797 | 8490 | 7797 | 8490 | 7797 | 8490 | 7797 |
3 | Marketing cost | 1369 | 1168 | 1570 | 1156 | 1243 | 920 | 750 | 575 | 11411 | 9670 |
4 | TC | 30425 | 27660 | 34552 | 30764 | 28836 | 25940 | 23164 | 20641 | 83977 | 77545 |
4 | GR | 45416 | 35187 | 50881 | 38752 | 41040 | 32651 | 33266 | 25507 | 198627 | 142623 |
6 | NR | 14991 | 7237 | 16329 | 7989 | 12204 | 6712 | 10102 | 4866 | 114650 | 65078 |
7 | Returns per rupee of expenditure | 1.49 | 1.27 | 1.47 | 1.26 | 1.42 | 1.26 | 1.41 | 1.24 | 2.37 | 1.84 |
Note: B- Beneficiary, N-B – Non-beneficiary, TC- Total cost, TFC- Total fixed cost, TVC –Total variable cost GR- Gross returns, NR- Net returns.
Table 6: Average annual Income of beneficiary and non-beneficiary farmers under Yeldur Nala Sub - Watershed Project (Rs/farm).
Sl. | Income source |
Beneficiaries | Non- | Difference in income | Percentage change in income (%) |
I | Income from crops | 240682.11 | 126922.64 | 113759.5 | 47.27 |
II | Livestock income | 32967.06 | 27465.92 | 5501.14 | 16.69 |
III | Off-farm and | 10358.25 | 16354.86 | -5996.61 | -34.21 |
IV | Total income | 284007.42 | 170743.42 | 113264 | 39.88 |
Annual income from Livestock per farm was 16.69 per cent higher in watershed area (Rs.32967.06) than the non-watershed area (Rs.27465.92) with the difference in income of (Rs.5501.14) this was due to animal health camps conducted during the implementation of watershed project along with the supply of annual and perennial fodder kits, construction of cattel pond, cattle and sheep sheds helped farmers in maintenance of livestock in watershed area.(Table 6) comparable findings were observed in the studies by Nirankush (2015).
The off-farm and Non-farm income of non-watershed area was high with Rs.16354.86 which is 34.21 per cent higher than watershed area with Rs.10358.25 income. This was because in non-watershed area the farm income is less hence people tends to do other work for their source of income. The total income of watershed area (Rs.284007) was 39.88per cent higher than non-watershed area (Rs.170743) due to all supplemented activities done under watershed project which enhance the livelihood of people.
Constraints faced by beneficiaries in project implementation.
Responses were taken from sample respondents in the study area, where Lack of awareness about benefits of watershed technology and Obstruction for cultural operation by water harvesting structure were first and second major constraint with garret score 71.37 and 64.87 respectively. High Maintenance cost of structures and Uncertain rainfall were ranked third and fourth with score 59.47 and 53.47 respectively. Small and fragmented nature of holdings and Groupism and village politics were ranked least with score 47.70 and 33.97 score respectively by the beneficiaries of Yeldur nala-sub watershed project. (Table 7)
Constraints realized by implementing agency in project implementation.
Constraints realized by implementing agency in project implementation was taken from both the implementers in the study area, where poor participation by the farmers during training programmes and political interference ranked first and second. Failure to recognize advantages of watershed activities by farmers and small and fragmented nature of holdings were third and fourth. Delay in releasing the sanctioned amount ranked least by the implementers during the implementation of the project.(Table 8)
Table 7: Constraints faced by beneficiaries during implementation of the Yeldur Nala Sub - Watershed Project.
Sl. | Constraints faced by farmers | Yeldur nala-sub watershed project. | |
Score | Rank | ||
1 | Lack of awareness about benefits of | 71.37 | I |
2 | Obstruction for cultural operation by water | 64.87 | II |
3 | High Maintenance cost of water harvesting | 59.47 | III |
4 | Uncertain rainfall | 53.40 | IV |
5 | Small and fragmented nature of holdings | 47.70 | V |
6 | Groupism and village politics | 33.97 | VI |
Table 8 :Constraints faced by implementing agencies in implementing Yeldur nala-sub watershed project.
Sl. No. | Implementers | Rank |
1 | Poor participation by the farmers during | I |
2 | Political interference | II |
3 | Failure to recognize advantages of watershed | III |
4 | Small and fragmented nature of holdings | IV |
5 | Limited availability of labour | V |
6 | Delay in releasing the sanctioned amount | VI |
Table 9: Soil and water conservation activities undertaken in the sample farmer’s fields
Sl. | Structures | Yeldur nala-sub watershed project. | ||
Beneficiaries | Managed | Not | ||
1 | Farm ponds | 8 | 7 | 1 |
2 | Field bunds | 1 | 0 | 1 |
3 | Trench cum | 29 | 18 | 11 |
4 | Boulder bund | 0 | 0 | 0 |
To conserve the soil and water in the field, some of the structures were constructed in sample farmer’s field. Farm pond, field bund and trench cum bund were constructed for eight, one and twenty nine farmers respectively, out of which seven farmers maintained farm pond and only eighteen farmers maintained trench cum bund. Farm ponds constructed under watershed projects were efficiently maintained by farmers compared to other water harvesting structures, this was because farm pond benefits the farmer by holding more rain water compared to trench cum bund and field bund and it was very difficult to manage trench cum bund and field bund as weed growth on these bunds was a major problem. (Table.9)
Conclusion
This study gives ample scope for and perfect picture of the economically efficiency and sustainability of watershed activities in watershed area on soil health, water availability and rural livelihood over non-watershed area. Due to soil and water conservation activities ground water table increased, there was less soil erosion resulted in increased crop yield, fodder production was efficiently managed, agroforest activities indicated that the watershed activities, benefited farmers by enhancing their net returns and overall income. Still there is a lack of knowledge about the benefits of watershed among the farmers resulted in poor maintaince of soil and water conservation structures like field bund, trench cum bund, farm pond, check dam and nala bund, Hence there is need to enhance information about the advantage of watershed activities and for formation of watershed farmers’ associations for the maintenance of soil and water conservation structures by watershed development department for the sustainability of the developmental work.
Acknowledgement
I place my deep sense of gratitude to Prabhash Chandra Ray, Commissioner, Watershed Development Department and Rashmi Alias, Deputy Director of Agriculture Watershed Development Department and Shiv kumar, JDA, Kolar and K. Pramod, Technical officer, JDA office, Kolar, Manjunat. N., Agriculture officer, RSK Sri nivaspura, Rajappa and Anjanappa, watershed assistants, RSK, Sri nivaspura taluk kolar districts, Karnataka. for their support during my research.
Conflict of Interest
The author declares no conflict of interest.
Funding Sources
I am thankful to NABARD for providing an opportunity to work under ‘Grameen Chintan Project’ and for extension of financial support to conduct my research.
References
- Anonymous.Ground watershed area information booklet Kolar district, Karnataka. Central ground watershed area board, GOI, 2012;38-64.
- Anonymous.Annual report. 2016-17. Department of Agriculture, Cooperation & Farmers Welfare, GOI, New Delhi, 2017;1-194.
- Anonymous. District irrigation plan – Kolar district. Pradhan Mantri Krishi Sinchayi Yojana (PMKSY), GOK. 2015;1-151.
- Anonymous.Kolar district at glance 2017-18. District statistical office, Kolar.2018;10-12.
- Debasis M., Kumarjit M and Lakshmikanta D. Trend, pattern and determinants of crop diversification of small holders in West Bengal: A district-wise panel data analysis. J. Dev. Agric. Econ.2017;10(4):110-119.
CrossRef - Susheela M.,Singh I.P and Ramji L.M. Cost of cultivation and returns on different cost concepts basis of onion in Rajasthan. Econ.Aff.2016; 61(1): 11-16.
CrossRef - Garrett H. E. and woodworth, R. S. Statistics in psychology and education. Vakils, Feffer and Simons Pvt. Ltd.1969;329.
- Painuli D.K., Goyal, R.K., Bhagwan S, Rajwantkaur K and Roy M.M. Impact Evaluation of Watershed Programs in Jaisalmer District of Rajasthan. Central Arid Zone Research Institute, Jodhpur, India, 2014; 26-30.
- Palanisami K., Bekele S, Joshi P. K., Nedumaran, S. andSuhas, P.W. Impact of watershed projects in India: Application of various approaches and methods. Integrated Watershed Management in Rainfed Agriculture. 2011;19(33): 349-391.
- Thakur D.R., PathaniaM.S. and Thakur R. K. Impact analyasis of integrated watershed project in Swan catchment, Una district of Himachal Pradesh. J.Ext.Educ. 2014; 1-113.
- Nirankusha, S. Impact of watershed development (IWMP) on farm economy in Belagavi district. M.Sc. Thesis (Unpub.), Univ. Agric. Sci., Dharwad. 2015.


