Evaluation of Groundwater Quality in the Vicinity of the Industrial Area (JNPC) of Parawada, Visakhapatnam, Andhra Pradesh, India Utilizing Water Quality Index – A case study
Bujjibabu Miriyala1
 , Sharmila Nurbasha2
and Hari Babu Bollikolla2
*
, Sharmila Nurbasha2
and Hari Babu Bollikolla2
*
1
Department of Environmental Sciences,
Acharya Nagarjuna University,
Guntur,
Andhra Pradesh
India
2
Department of Chemistry,
Acharya Nagarjuna University,
Guntur,
Andhra Pradesh
India
http://dx.doi.org/10.12944/CWE.17.3.29
Copy the following to cite this article:
Miriyala B, Nurbasha S, Bollikolla H. B. Area (JNPC) of Parawada, Visakhapatnam, Andhra Pradesh, India Utilizing Water Quality Index – A case study. Curr World Environ 2022;17(3). DOI:http://dx.doi.org/10.12944/CWE.17.3.29
Copy the following to cite this URL:
Miriyala B, Nurbasha S, Bollikolla H. B. Area (JNPC) of Parawada, Visakhapatnam, Andhra Pradesh, India Utilizing Water Quality Index – A case study. Curr World Environ 2022;17(3).
Citation Manager Publish History

Introduction
Water is a fundamental component of nature since freshwater is required for life to exist on Earth;Water cannot be replaced for any of its purposes1.Ground water quality is commonly assessed using physicochemical parameters, which change significantly as a result of mixing with various types of pollution, seasonal fluctuations, groundwater withdrawal, and so on. Results from certain important physicochemical parameters and heavy metals are needed to compute the purity when evaluating groundwater quality. As a primary supply of drinking water, as well as for agriculture, industry, and a range of recreational activities, groundwater is typically refilled by surface or river water2. As a result of industrial wastewater penetration, agricultural operations & runoffs, mining extracts, and urban sewages carrying harmful chemical components3, among other factors, unexpected pollutant contamination in groundwater has recently been noted; The research area's groundwater quality is impacted by anthropogenic activities4.Considerable variations in water quality can occasionally be attributed to geogenic and anthropogenic influences on drinking water purity indicators5.Prior to the industrial revolution, surface and groundwater quality was adequate in terms of both quality and quantity. Since the 18th century, tremendous growth in industrial establishment has resulted in a frantic increase in anthropogenic activities, making water resources vulnerable to contamination by various pollutants6.Current agricultural practises substantially endanger human health, especially when excessive fertiliser is used, circumstances are unhygienic, and sewage is dumped into groundwater7,8.
In the current study area, groundwater is utilized for drinking, feeding livestock, and domestic needs. The current study region is close to an industrial hub and mineralized; there may be contamination due to contaminated water mixing with surface and groundwater due to percolation. As a result, proper knowledge of a specific groundwater and its quality is required for its utility. In general, quantifying several physicochemical variables to determine water quality is very challenging to do and only gives a partial view of the issue. To express water quality as a single numerical value, a computation is needed to objectively aggregate all relevant parameters9.WQI, which incorporates all features and correlates them to groundwater quality criteria, is the most frequently used indices approach for groundwater analysis as a result of the need for an indices method to evaluate groundwater quality 10,11."Water Quality Index (WQI) is a mathematical expression that is used to translate a significant quantity of data regarding water purity into a single number," is the short definition12 (or) A rating that accounts for the cumulative effect of many parameters of water quality is another definition of WQI. Understanding the issues with water quality is enhanced by bringing together complex data and producing a score that shows the state of the water. built it using logarithmic variables and arithmetic weighting13-15.
Material and Methodology
Material Used for the study:
Newly purchased plastic cans, intense and clean glass bottles, pipettes, burettes, beakers, measuring cylinders, marker pens, sealing tapes, and iceboxes were used as designated materials. During the analysis, Analytical Reagent (AR) grade chemicals from reputable manufacturers such as Merck, Qualigens, and others, as well as Certified Reference Materials (CRMs) traceable to NIST from Merck, Germany, were used. Advanced instruments and calibrated glassware were used and appropriate methods were employed16.
Study Area
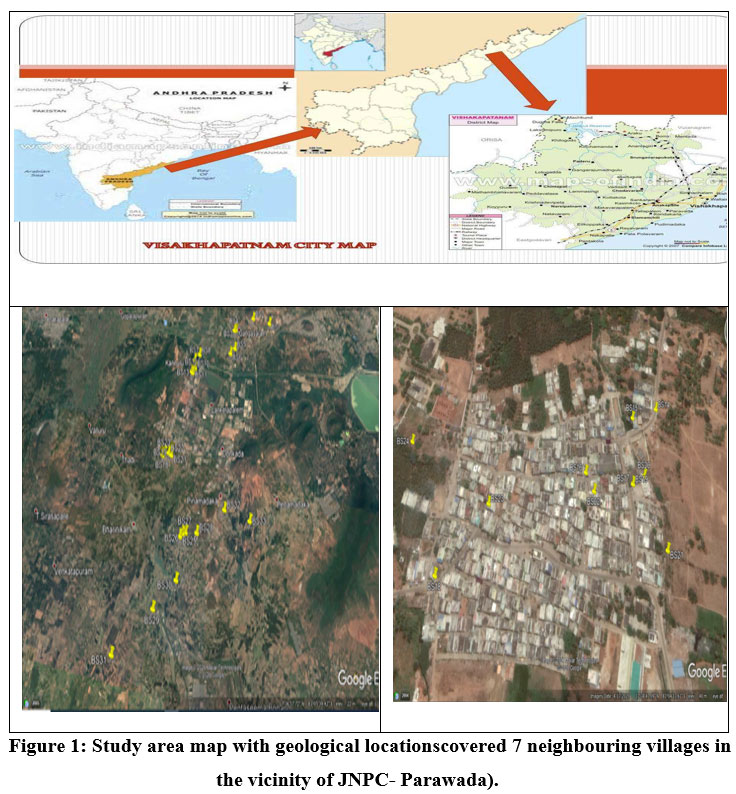
The current research area is in Visakhapatnam's south-west region. It falls under the parawadamandal of Visakhapatnam's rural area. Which are in close proximity to Jawaharlal Nehru Parma City (JNPC). The entire study area is approximately 1 to 10 square kilometers surrounding the JNPC pharma city. This area is also bumpy and sloppy. The area is located between 17°36' and 17°41' N and 83°03' and 83°06'E (Fig.1). 991 females for every 1000 males is the gender split. The minimum temperature in November or December often ranges from 28 to 34 degrees Celsius. The average maximum temperature in May (or) June ranges from 35°C to 42°C. Every year, the northeast monsoon starts in October and the southwest monsoon starts in the third week of April. 1100 to 1208 mm of rain precipitation per year is the average rain fall in the study area. The current study area includes five prominent villages. It covered the entire industrial hub. The public uses groundwater for drinking, cattle feeding, household use, and irrigation. Groundwater contamination may occur as a result of industrial activity. The primary economic source in the area is agriculture, followed by industrial labour work. Paddy is the main crop. There is no scientific drainage system in the study area. Furthermore, the local population is frequently afflicted with fever, diarrhoea, and gastrointestinal diseases. Crop yields are declining year after year. According to the 2011 census, the population of ParawadaMandal is 52605, and the population is expected to grow to 65230 in 2021, and then again in 2022, i.e., 67334. Every year, the population grows by up to 2000 members, who migrate from various places for work17. Additionally, it has been noted that incorrect use of landforms, geological formations, rainfall patterns, and infiltration rates might affect groundwater quality18,19.A photograph of the research region is displayed in Figure 1.
 | Figure 1: Study area map with geological locations covered 7 neighbouring villages in the vicinity of JNPC- Parawada).
|
Sampling Locations
For this study, 33 sampling locations were identified from 7 villages (Figure 2) in the vicinity of JNPC (Jawaharlal Nehru Pharma City), Parawadamandal, Visakhapatnam rural that are covered all around the JNPC: Lankalapalem, China Tadi/Kannuru, Tanam, Parawada, Jallelapalem, Boddavanipalem, and Pinnamadaka. The study area was approximately 1-10 square kilometres. Table 1 contains a list of sampling stations and their details.
Table 1: A list of sampling stations in the study area, along with their geographical locations (groundwater - bore wells).
S.No. | Sample Code | Description of sample | Latitude | Longitude |
Area 01: Lankalapalem Village | ||||
BS1 | Bore well sample was collected at HP Gas go- Dom | 17° 41' 18.852'' N | 83° 6' 40.215''E | |
BS2 | Bore well sample was collected from Reddy mango garden (near Indian Oil petrol bunk) | 17° 41' 22.502'' N | 83° 6' 13.838''E | |
BS3 | Bore well sample was collected at the home of Manyam Srinivasa Rao. | 17° 41' 7.926'' N | 83° 5' 45.765''E | |
BS4 | Bore well sample was collected at the S. Rahava rao residence, D.No.7-54. | 17° 41' 7.083'' N | 83° 5' 43.659''E | |
BS5 | Bore well sample was collected at the Shanti Talent School. | 17° 40' 46.232''N | 83° 5' 45.265''E | |
BS6 | Bore well sample was collected at the Kanakadurga temple's back side. | 17° 40' 40.216''N | 83° 5' 38.518''E | |
Area 02: China Tadi / Kannuru Village | ||||
BS7 | Bore well sample taken near the APGVB bank. | 17° 40' 29.143''N | 83° 4' 42.679''E | |
BS8 | Open well sample collected at the house of Sala Ramana. | 17° 40' 35.583''N | 83° 4' 49.807''E | |
BS9 | Bore well sample collected at the house of P.Venkata Lakshmi | 17° 40' 36.620''N | 83° 04' 49.77''E | |
BS10 | Bore well sample collected at MPP School | 17° 40' 19.992''N | 83° 4' 44.108''E | |
BS11 | Bore well sample was collected at BC colony, near BondaRamulamma's house | 17° 40' 16.320''N | 83° 04' 41.04''E | |
BS12 | Bore well sample was collected from the Panchayati water tank. | 17° 40' 15.600''N | 83° 04'39.07'' E | |
BS13 | Bore well sample taken near the Visakhapatnam Municipal Sub-Zonal Office | 17° 40' 14.491''N | 83°04' 40.46'' E | |
Area 03: Tanam Village | ||||
BS14 | Bore well sample was taken at theBattiNukaraju House. | 17° 38' 55.402''N | 83° 04' 18.86''E | |
BS15 | Bore well sample was collected near thePanchayat's overhead tank. | 17° 38' 55.15'' N | 83° 4' 17.44'' E | |
BS16 | Bore well sample taken from bore hole No.32/013 (01/030). | 17° 38' 52.958'' N | 83° 4' 14.487''E | |
BS17 | Bore well sample was collected at the house of MullapakaApparao bore hole No.32/013 (01/051) | 17° 38' 52.648''N | 83° 4' 17.166''E | |
BS18 | Bore well sample was collected at Anjaneya Swami temple | 17° 38' 49.722''N | 83° 4' 6.567'' E | |
BS19 | Bore well sample was collected at the house of KattaSanyarasirao. | 17° 38' 52.623''N | 83° 4' 17.173''E | |
BS20 | Panchayat water sample was collected at the house of SambangiKumari. | 17° 38' 52.900'' N | 83° 4' 17.84'' E | |
BS21 | Bore well sample was collected near the house of BurraSannyasirao. | 17° 38' 50.485'' N | 83° 4' 18.80'' E | |
BS22 | Bore well sample was collected near the house of ThigiripalliGangaraju. | 17° 38' 52.306''N | 83° 4' 14.93'' E | |
BS23 | A bore well sample was taken at the NTR statue. | 17° 38' 51.885''N | 83° 4' 9.094'' E | |
BS24 | A bore well sample was taken near Z.P.High School. | 17° 38' 54.074''N | 83° 4' 4.303'' E | |
Area 04: Parawada Village | ||||
BS25 | A bore well sample was taken at theVinayaka temple. | 17° 37' 42.35'' N | 83° 04'39.68'' E | |
BS26 | Bore well sample was taken near VisakhaGrameena Bank. | 17° 37' 44.85'' N | 83° 4'42.826'' E | |
BS27 | Borewellsample taken near the main road | 17° 37'45.886'' N | 83° 4'46.729'' E | |
BS28 | Bore well sample was collected at Maridimamba Community Hall, Opposite B.C. Boys Hostel | 17° 37'46.452'' N | 83° 5'1.712'' E | |
Area 05: Other Villages | ||||
BS29 | A bore well sample was taken at the Maridimamba temple in Jallelapalem Village. | 17° 36'46.119'' N | 83° 4'12.457'' E | |
BS30 | Bore well sample was collected at the Pydimamba temple-Parawda-Achutauram road. | 17° 37' 8.713'' N | 83° 4'38.769'' E | |
BS31 | Borewell sample was collected at Overhead water tank inBoddavanipalemVillage | 17° 36'11.660'' N | 83° 3'27.684'' E | |
BS32 | Bore well sample was collected in Pinnamadaka village at Gowthulachanna Colony. | 17° 38' 7.922'' N | 83° 5'37.417'' E | |
BS33 | A bore well sample was taken near Ramalayam in the village of Pinnamadaka. | 17° 38' 1.017'' N | 83° 6'12.106'' E | |
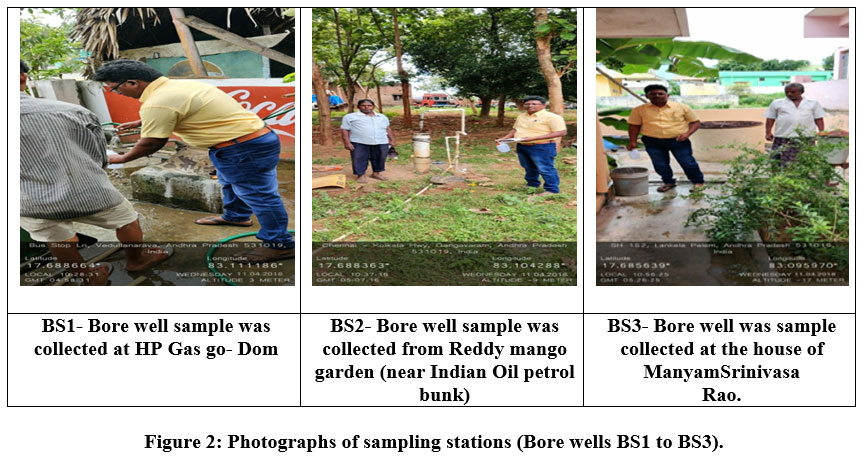 | Figure 2: Photographs of sampling stations (Bore wells BS1 to BS3).
|
Sampling
Seasonal sampling was carried out in the summer, rainy, and winter seasons of 2019 and 2020. Simple random sampling was used to collect samples from the above sampling stations, which are pre-identified locations in the selected villages based on water utilisation or consumption by the local area people in the study area. Water samples were collected in sanitized bottles with a tag and sample code that was screw-capped and correctly labeled, as well as freshly acquired 2-liter plastic cans. For analysis, samples were kept in refrigerators at 4 degrees Celsius and brought to the lab in an icebox. For the preparation of solutions and reagents, reagent grade 02 water (distilled water) with conductivity less than 2 µS/cm, pH between 6.8 and 7.5, and color retention time of more than 10 minutes was employed.
Parameters analysed
The analysis was performed at the Zonal Laboratory, APPCB, Kurnool, and Visakhapatnam using standard methods and techniques outlined in the APHA (22nd, 23rd Edition) and IS 3025 (Part 44): 1993. (Reaffirmed 2014). The Bio-chemical oxygen demand,pH,dissolved oxygen (DO), magnesium (Mg2+), calcium (Ca2+), chlorides (Cl-),total dissolved solids (TDS),total alkalinity (TA),phosphates (PO4-2), sulphates (SO4-2), residual free chlorine, nitrate (NO3-), fluorides (F-),turbidity, ),total hardness (TH),and heavymetals such as iron (Fe+3) and zinc (Zn+2) were analysed. Spectrometers (DR 6000 & DR 2700), specific ion metres, an ICP-OES instrument, an Atomic Absorption Spectrophotometer, incubators, water baths, analytical equipment, and calibrated glassware were used. The findings were compared to BIS (IS-10500: 2012) and WHO designated standards20.
Scope of the Present Study
The residential and industrial zones of Visakhapatnam city's physicochemical features and found several abnormalities. The suitability of groundwater for drinking is insignificant to them. Additionally, an industrial hub is not far from the current research area. As per the knowledge of the author, no specific scientific study was carried out in the current study region. Groundwater is used by the general public for irrigation, home use, feeding livestock, and drinking. Groundwater contamination may occur as a result of industrial activity. There is no scientific drainage system in the study area. Furthermore, the local population is frequently afflicted with fever, diarrhoea, and gastrointestinal diseases. This forms the basis for groundwater quality study and an attempt has been made to evaluate the concentration levels of some physicochemical parameters & heavy metals as well as WQI.
Water Quality Index (WQI):
In 1972, Brown et al. 21 introduced WQI. Horton had originally predicted it in 1965, and modified it in 1972 by Brown & co,for more practical use.The WQI merely offered a single number, analogous to a grade, based on selected water purity metrics, to describe the overall water purity at a specific site and time.WQI is a merged influence of contributing factors on water purity for every water system22.The most effective method for expressing the water quality in a specific region, it provides a simple, stable, and dependable unit of measurement.Policymakers and locals can simply receive the acquired information. This makes it a crucial tool for monitoring and evaluating groundwater23,24 . The water quality of a number of sources in the research region has been found to be favourable based on estimated water quality indices25,15. The computation of the WQ Index and its range in this study was based on a document on Groundwater Quality Assessment Using WQI in Varanasi Dist., U.P., India.
The following formulae were used to determine the Indexof groundwater Quality:
Normally, the WQI is calculated in three steps. Utilize the formula to determine or assign weights (Wi) to the selected water parameters in accordance with their proportional importance to the overall quality of the water.Wi is equal to K/Si, where, K- is constant (K = 1) while, Si- is the standard laid by the BIS or WHO. Used the following equation to solve for Wi and get the relative Wi of the parameter in the first step:
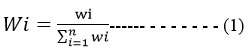
At which "n" is the total number of variables or parameters, "wi" denotes the weights given to each parameter, and "Wi" denotes the weight given to the ith parameter relative to the other parameters.Table 3 contains the measured relative Wi values of each parameter. Some empirical parameters' unit weights (wi) were inversely correlated with the standards recommended for the complying parameters.Brown et al. (1972) defined qi' as the ith parameter's water quality assessment, and the following formula is used to calculate its value:

Here, Si is the parameter's utmost permissible value of the ith parameter as set by the BIS or WHO, and Vi- denotes the parameter's analytical value of the ith parameter.Vo is considered as ideal value for ith parameter in pure water. All ideal values (Vo) for drinking water, with the exception of pH and dissolved oxygen, are taken to be zero26.The ideal pH for natural/pure water is 7.0, while the highest number that is allowed is 8.5.As a result, the pH quality rating is determined by equation 2.1:

where, the analytical pH value is VpH.
The optimal level of dissolved oxygen for drinking water is 14.6 mg/L, whereas the typical permissible limit is 5 mg/L. As a result, its quality grade for DO is determined using the calculation below:

Dissolved oxygen analytical value is referred to as VDO.Using the formula as below, the weighted arithmetic WQI is finally calculated:
According to research in the literature, the WQI values are used to categorise the water into five categories: Suitable for drinking-25; "Slightly contaminated- 26-50; Moderately polluted- 51-75; Severely polluted- 76-100; and >100 is unsuitable for human consumption27,21 .
Table 2: A representative table for water quality metrics that includes ideal values, standard values from the WHO or BIS, and weighting factors.
S.No | Parameter | Vi | Vo | Si | K | Wi |
1 | pH | 7.2 | 7 | 8.5 | 1 | 0.11765 |
2 | DO | 3.9 | 14.6 | 6 | 1 | 0.16667 |
3 | Turbidity | 6.1 | 0 | 1 | 1 | 1 |
4 | TDS | 1840 | 0 | 500 | 1 | 0.002 |
5 | Total Hardness | 701.4 | 0 | 200 | 1 | 0.005 |
6 | Total Alkalinity | 646 | 0 | 200 | 1 | 0.005 |
7 | Cl- | 408.8 | 0 | 250 | 1 | 0.004 |
8 | Sulphates | 242.5 | 0 | 200 | 1 | 0.005 |
9 | Fluoride | 1.06 | 0 | 1 | 1 | 1 |
10 | Nitrate | 40.8 | 0 | 45 | 1 | 0.02222 |
11 | Bio-Chemical Oxygen Demand | 5.4 | 0 | 5 | 1 | 0.2 |
12 | Residual free chlorine | 0 | 0 | 0.2 | 1 | 5 |
13 | Phosphates | 0.3 | 0 | 0.1 | 1 | 10 |
14 | Calcium | 129.7 | 0 | 75 | 1 | 0.01333 |
15 | Magnesium | 91.6 | 0 | 30 | 1 | 0.03333 |
16 | Iron | 0.103 | 0 | 0.3 | 1 | 3.33333 |
17 | Zinc | 0.197 | 0 | 5 | 1 | 0.2 |
|
|
|
|
| EWi | 21.1075 |
Table 3. A sample table for calculating the Water Quality Index mathematically in the research area using indicators of water quality:
S.No | Parameter | Vi-Vo | Si-Vo | qi | qi*Wi |
1 | pH | 0.2 | 1.5 | 13.3333 | 1.56863 |
2 | Dissolved Oxygen | -10.7 | -8.6 | 124.419 | 20.7364 |
3 | Turbidity | 6.1 | 1 | 610 | 610 |
4 | TDS | 1840 | 500 | 368 | 0.736 |
5 | Total Hardness | 701.4 | 200 | 350.7 | 1.7535 |
6 | Total Alkalinity | 646 | 200 | 323 | 1.615 |
7 | Chloride | 408.8 | 250 | 163.52 | 0.65408 |
8 | Sulphates | 242.5 | 200 | 121.25 | 0.60625 |
9 | Fluoride | 1.06 | 1 | 106 | 106 |
10 | Nitrate | 40.8 | 45 | 90.6667 | 2.01481 |
11 | Bio-Chemical Oxygen Demand | 5.4 | 5 | 108 | 21.6 |
12 | Residual free chlorine | 0 | 0.2 | 0 | 0 |
13 | Phosphates | 0.3 | 0.1 | 300 | 3000 |
14 | Calcium | 129.7 | 75 | 172.933 | 2.30578 |
15 | Magnesium | 91.6 | 30 | 305.333 | 10.1778 |
16 | Iron | 0.103 | 0.3 | 34.3333 | 114.444 |
17 | Zinc | 0.197 | 5 | 3.94 | 0.788 |
|
|
|
| EqiWi | 3895 |
| WQI = EqiWi/ EWi | 184.5312838 |
| ||
For easy understanding, the average analytical values were taken from the results.
Results and Discussion:
The results are presented in Table 6 to Table 11. From the results, the following observations are made in Area wise and are detailed below:
The pH has been between 6.52 and 7.94. In the summer of 2020, the BS6 sampling station recorded the highest value, the lowest value was recorded by sampling station BS17, while an average value of 7.32 was noted. It meets the 6.5 to 8.5 BIS requirements. Turbidity levels varied between 0.32 NTU and 2.84 NTU. In the summer of 2020, the BS10 sampling station registered the highest value, the BS01 sampling station had the lowest value, and the mean result was 1.02 NTU. Some samples, ranging from 1 to 5 NTU, do not fulfill BIS criteria. Turbidity was 40.9% higher than the permitted limits at sample stations BS7, BS10, BS9, BS16, BS14, BS18, BS17, BS23, BS24,BS21, BS22, BS25, and BS27; the other stations were well within the norms. No samples have exceeded the maximum allowable limit. The presence of dissolved oxygen in water suggests that it can sustain aquatic life28.2.6 mg/L to 6.9 mg/L was the dissolved oxygen concentration range in the current study. The maximum values were discovered at BS29 sampling station during the winter season of 2020, and the minimum value was discovered at BS21 during the summer season of 2019. The average value was 4.8 mg/L.DO levels were recorded as low during the summer and rainy seasons, but an improvement was observed during the winter season. This could be attributed to lower winter water temperatures and increased atmospheric oxygen solubility. BIS and WHO have not established a standard for DO. Using the oven drying process, total dissolved solids and suspended solids were calculated29. Water with high TDS has less clarity and aquatic plants produce less photosynthesis28.The range of total dissolved solids (TDS) measurements was 375 mg/L to 2976 mg/L. In 2019, the winter season had seen the lowest value at the BS10 sampling station while the rainy season had seen highest value at the BS25 sampling station. The mean result was 1174 mg/L. At sample stations BS18, BS19, BS16, BS17, BS23, BS25, BS21, BS22, and BS26, TDS levels were high. The highest value of these was for BS25. The majority of the samples don't meet the 500 mg/L to 2000 mg/L BIS and WHO requirements. Only 9% of the samples met the standards, 75% of the samples fell between the acceptable and allowable thresholds, whereas 16% went over the permitted limits. The BOD value was in the range of 1.0 to 5.3 mg/L. The BS30 sample site recorded the highest value during the rainy season of 2020, while the BS9 station recorded the lowest value during the summer, with an average value of 2.2 mg/L. BOD levels were minimal in the summer and winter but somewhat elevated in the rainy season. The BIS or WHO have not established a standard for BOD. However, the CPCB of India has set the standard for BOD in surface water at 3 mg/L. More than 3 mg/L BOD is suspect. Total hardness measurements ranged from 177 mg/L to 1418 mg/L. At the BS26 sampling site, the greatest value was found in the summer of 2020, and the minimum value was found at the BS16 sampling station in the winter of 2019. The standard deviation was 503 mg/L. At sampling stations BS3, BS4, BS18, BS23, BS25, and BS26, high Total Hardness Concentrations were recorded;BS26 had the highest value of those measured. The BIS-established Total Hardness 20criteria range from 200 mg/L to 600 mg/L. (IS 10500:2012).Only two samples at sampling station BS32 fell inside the acceptable limits when the findings were compared to the standard, 18% of the samples went beyond the permitted level, and the remaining samples fell somewhere between the desirable and acceptable limits. Most of the areas in the country are mainly having higher concentration of calcium hardness due to geo-genic conditions30.Between 23 mg/L and 298 mg/L of calcium were present. The BS26 sampling station recorded the greatest values during the 2019 monsoon season, and the BS16 sampling station recorded the lowest values during the 2019 winter season. It was noted that the average value was 100 mg/L. Calcium concentrations were found to be high at the BS25 and BS26 sampling stations. At the BS16 and BS21 sampling stations, extremely low concentrations were detected. BIS established calcium standards (IS 10500:2012), ranging from 75 mg/L to 200 mg/L. When compared to the standard, 42.9% of samples were under within acceptable limits. The remaining 51% of samples were evenly distributed, with only 6% of them falling outside of the acceptable range. Between 14 mg/L and 182 mg/L of magnesium were present in the samples. The lowest values were found at BS7 during the rainy season of 2019 and BS10 during the winter season of 2019, while the highest values were found at BS26 sampling station during the summer season of 2020. The average value was discovered to be 61 mg/L. When the results were matched to the standard (IS 10500:2012, i.e. 30 mg/L to 100 mg/L), 18% of the samples reported at BS7, BS28,BS10, BS31,andBS29were well within the allowed limits. The remaining 66% of samples fell somewhere in the center, whereas 16% of samples, specifically, BS3, BS4, BS18, BS25, BS26, and BS27, exceeded the maximum permitted levels. From 218 mg/L to 892 mg/L, the total alkalinity concentrations were found. At the BS17 sampling station, the greatest value was found in the summer of 2020, and the minimum value was found at the BS28 sample station, in the rainy season of 2019. 481 mg/L was the standard deviation. When the outcomes were measured against the reference range (IS 10500: 2012, or 200 mg/L to 600 mg/L).At sample stations BS6, BS23, BS14, BS19, BS21, BS16, BS17, BS25, BS26, BS18, BS22, and BS27, high total alkalinity concentrations were found. No sample was determined to be within allowable limits, and 35.8% of samples were found to be outside of them entirely. The remaining 64.2% of samples fell between acceptable and permitted ranges, with BS17 having the highest value.
Chloride levels ranged from 28 mg/L to 786 mg/L. The maximum value was recorded at the BS25 sampling station during the rainy season of 2019, while the lowest value was recorded at the BS10 sampling station during the winter season of 2020. The average value was 263 mg/L. 58.5% of the samples fall within acceptable limits when the results are compared to the standard (IS 10500: 2012, i.e., 250 mg/L to 1000 mg/L), While the remaining 41.5% are within acceptable and permissible ranges. Sulphate levels ranged from 18 mg/L to 298 mg/L. In the winter of 2019, the BS10 sampling station recorded the lowest values, and the BS25 sampling station reported the highest values during the rainy season of 2020.The average was noted to be 83 mg/L. When the results are compared to the reference (IS 10500: 2012, which ranges from 200 mg/L to 400 mg/L), 91.4% of the samples fall within a tolerable level and the remaining 8.6% fall within acceptable and permissible values. Nitrate concentrations ranged from 0.9 mg/L to 267 mg/L. The BS25 sampling station recorded the greatest values during the rainy season of 2020, and the BS10 sampling station recorded the lowest values during the winter season of 2019. The typical reading was 53 mg/L. The analysis shows that at sampling stations BS2, BS5, BS6, BS9, BS17, BS18, BS21, BS22, BS23, BS25, and BS26 (IS 10500: 2012, i.e. 45 mg/L to No relaxation), the nitrates readings surpassed the permitted limit by 30.8%, while the remaining 69.2% are well within the standard.
Fluoride concentration range from 0.10 to 1.68 mg/L. The highest values were recorded at the BS27 sampling station during the rainy season of 2020, while the lowest values were reported at the BS30 sampling station during the winter season of 2019.The standard deviation was 1.2 mg/L. In many of the monitoring stations, fluoride concentrations were determined to be within safe limits. but exceeded them at a few, including BS6, BS14, BS16, BS22, and BS25. When the results were compared to the BIS standard (IS 10500: 2012, i.e. 1 mg/L to 1.5 mg/L), only 11% of the sample exceeded the permissible limits, 23.7% of the sample falls well within acceptable limits, while the remaining 65.3% falls somewhere between acceptable and permissible limits. The range of phosphorus concentrations was 0.01 mg/L to 0.80 mg/L. The maximum value was found at the BS20 sampling site during the rainy season of 2019, while the lowest value was found at BS8 during the entire season of 2020, with a mean value of 0.3 mg/L recorded. The WHO and BIS have not specified phosphate limits for drinking water, even though the Canadian Department of National Health and Welfare (1969) suggests a maximum of 0.2 mg/L for PO4.51.6% of samples met or exceeded the standards established in 1969 by the Canadian Department of National Health and Welfare. In both years, during both seasons, there was no residual chlorine discovered. The iron concentrations ranged from 0.002 mg/L to 0.946 mg/L. The maximum amount was found at the BS23 sample site during the rainy season of 2020, while the lowest amount was found at BS27 during the entire season. The average value was 0.063 mg/L. When the values were compared to the standard (BIS (IS 10500: 2012, i.e. 0.3 mg/L to No relaxation), only 5.5% of the samples exceeded the standard, with the remaining samples falling within acceptable limits. The sampling stations BS25, BS27, BS28, and BS 33 occasionally went over the limits. Zinc concentrations in the samples ranged from 0.001 mg/L to 0.044 mg/L. The BS25 sample station recorded the highest values during the rainy season of 2020, whereas BS3 and BS4 recorded the lowest values during the summer and winter of 2019. The standard deviation was 0.0065 mg/L. When the values were matched to the guideline (BIS (IS 10500: 2012, i.e., 5 mg/L to 15 mg/L)), all of the samples were discovered to be within the allowed range in both years and then both seasons at all sampling locations.
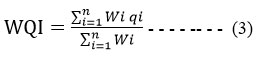
Hydro chemical facies:
The piper line diagram shows the outcomes of major cations (Mg2+, K+, Na+, and Ca2+) and major anions (HCO3-, F-, Cl-, and SO42-). Piper diagram was created using the GW chart programme (version1.260.0). In order to illustrate the total ion concentration using the analytical data, the comparative concentration of the anions and cat ions is represented in the bottom triangles (left side angle cat ions and right side angle anions). Four main hydrochemicalfacies (NaCl, Ca-HCO3, mixed Ca-Na-HCO3, and mixed Ca-Mg-Cl) were found in the current study as a result of transient hardness, high alkalinity, andsalinity.
 | Figure 3: Piper diagram is showing pre-dominant hydro chemical facies in the study area during 2019.
|
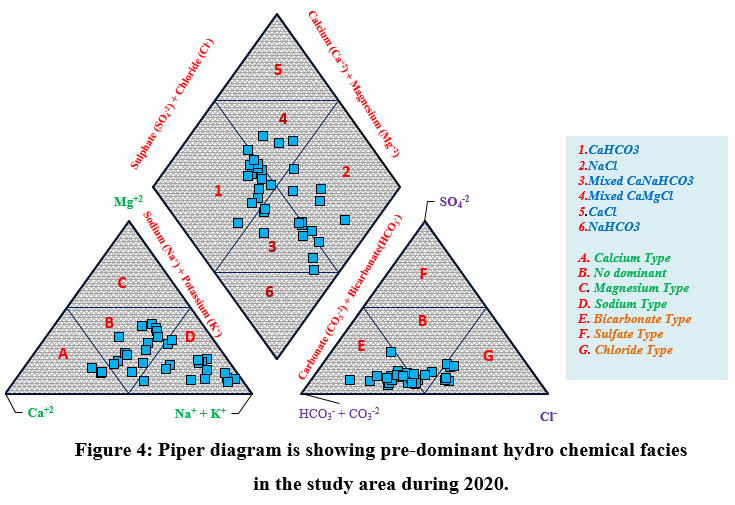 | Figure 4: Piper diagram is showing pre-dominant hydro chemical facies in the study area during 2020.
|
Correlation Analysis
In both seasons, there were both inverse and positive relationships in the correlation coefficient matrix between the various groundwater metrics in the research region. Other parameters had significant correlations with others while others had weaker correlations, and some parameters had negative correlations with others (Tables 3 & 4). There was a significant link between EC to TDS (0.999) followed by TA (0.850), Cl (0.967), and SO4-2 (0.912). TDS is strongly correlated with Mg+ (0.674), TA (0.850), Cl (0.967), SO4-2 (0.912). Calcium & Magnesium were moderately correlated with other parameters but strongly correlated with TH (0.888) & (0.928). Total Alkalinity is strongly correlated with EC (0.850), TDS (0.850) and F- (0.669). SO4-2 is strongly correlated with EC (0.912), TDS (0.910) and Cl-(0.874). pH is negatively correlated with other parameters. Turbidity, Iron, and Zinc were weakly correlated with other parameters.
Table 4: The Correlation coefficient matrix among physicochemical parameters & heavy metals in the Study area during the 2019.
| pH | EC | TDS | Ca+2 | Mg+2 | TH | F- | TA | Cl- | SO42- | Fe | Zn | Turbidity |
pH | 1 | ||||||||||||
EC | -0.0446 | 1 | |||||||||||
TDS | -0.0296 | 0.9993 | 1 | ||||||||||
Ca+2 | -0.2840 | 0.3726 | 0.3671 | 1 | |||||||||
Mg+2 | -0.1836 | 0.6765 | 0.6740 | 0.6548 | 1 | ||||||||
TH | -0.2509 | 0.5935 | 0.5893 | 0.8887 | 0.9285 | 1 | |||||||
F- | 0.0425 | 0.6378 | 0.6368 | 0.1721 | 0.3881 | 0.3200 | 1 | ||||||
TA | 0.0481 | 0.8500 | 0.8502 | 0.1865 | 0.5647 | 0.4342 | 0.6695 | 1 | |||||
Cl- | -0.0534 | 0.9679 | 0.9674 | 0.4239 | 0.7241 | 0.6476 | 0.5728 | 0.7324 | 1 | ||||
SO42- | -0.0749 | 0.9125 | 0.9108 | 0.4151 | 0.5592 | 0.5433 | 0.5273 | 0.6410 | 0.8747 | 1 | |||
Fe | -0.1394 | 0.3612 | 0.3688 | 0.4854 | 0.3947 | 0.4780 | 0.1190 | 0.0867 | 0.4156 | 0.4597 | 1 | ||
Zn | -0.0737 | 0.1177 | 0.1201 | 0.2023 | 0.1782 | 0.2075 | -0.2284 | -0.1537 | 0.2010 | 0.2366 | 0.5506 | 1 | |
Turbidity | -0.2777 | 0.4910 | 0.4864 | -0.0654 | 0.1179 | 0.0394 | 0.4534 | 0.3931 | 0.4262 | 0.5103 | 0.0974 | -0.046 | 1 |
Table 5: The Correlation coefficient matrix among physicochemical parameters & heavy metals in the Study area during the 2020.
| pH | EC | TDS | Ca+2 | Mg+2 | TH | F- | TA | Cl- | SO42- | Fe | Zn | Turbidity |
pH | 1 | ||||||||||||
EC | -0.0695 | 1 | |||||||||||
TDS | -0.0716 | 0.9994 | 1 | ||||||||||
Ca+2 | -0.4137 | 0.4069 | 0.4018 | 1 | |||||||||
Mg+2 | -0.2245 | 0.6802 | 0.6778 | 0.6389 | 1 | ||||||||
TH | -0.3453 | 0.6103 | 0.6062 | 0.8914 | 0.9182 | 1 | |||||||
F- | 0.0247 | 0.6160 | 0.6163 | 0.1917 | 0.3731 | 0.3185 | 1 | ||||||
TA | 0.0256 | 0.8565 | 0.8619 | 0.2363 | 0.5561 | 0.4493 | 0.6512 | 1 | |||||
Cl- | -0.1045 | 0.9658 | 0.9621 | 0.4476 | 0.7346 | 0.6633 | 0.5300 | 0.7393 | 1 | ||||
SO42- | -0.0686 | 0.9120 | 0.9100 | 0.4486 | 0.5680 | 0.5657 | 0.5266 | 0.6407 | 0.8738 | 1 | |||
Fe | -0.1971 | 0.3799 | 0.3616 | 0.4948 | 0.4206 | 0.5026 | 0.1561 | 0.1151 | 0.4285 | 0.5002 | 1 | ||
Zn | 0.0491 | 0.0637 | 0.0567 | 0.2015 | 0.1810 | 0.2104 | -0.2365 | -0.1861 | 0.1631 | 0.1754 | 0.5066 | 1 | |
Turbidity | -0.2588 | 0.4507 | 0.4609 | -0.0395 | 0.1478 | 0.0667 | 0.4564 | 0.3815 | 0.3793 | 0.4559 | 0.0870 | -0.0814 | 1 |
Table 6: shows the seasonally mean values of physicochemical characteristics and the Water Quality Index in Area -01 from 2019 to 2020.
S.No |
Parameter | Sampling codes and its results (Mean Values) | |||||
| BS1 | BS2 | BS3 | BS4 | BS5 | BS6 | ||
| 1 | pH | 7.23 | 7.05 | 7.07 | 7.42 | 7.42 | 7.62 |
| 2 | Dissolved Oxygen | 4.62 | 4.40 | 5.00 | 4.70 | 4.73 | 4.55 |
| 3 | Turbidity(NTU, Max) | 0.62 | 0.91 | 0.90 | 0.66 | 0.75 | 0.87 |
| 4 | Total Dissolved Solids at 105 oC | 951.17 | 793.33 | 1064.00 | 1037.67 | 1707.17 | 1654.00 |
| 5 | Total Hardness as CaCO3 | 554.31 | 513.08 | 660.62 | 651.86 | 507.84 | 459.05 |
| 6 | Total Alkalinity as CaCO3 | 451.50 | 368.83 | 560.67 | 455.67 | 543.00 | 684.00 |
| 7 | Chlorides as Cl- | 152.33 | 145.00 | 223.50 | 245.67 | 518.67 | 376.33 |
| 8 | Sulphates as SO42- | 98.12 | 54.33 | 51.15 | 59.17 | 85.17 | 102.17 |
| 9 | Fluorides as F- | 0.98 | 1.20 | 1.24 | 1.33 | 1.44 | 1.48 |
| 10 | Nitrogen as NO3 | 42.87 | 45.92 | 41.20 | 44.83 | 56.17 | 46.50 |
| 11 | Biochemical Oxygen Demand | 1.93 | 2.35 | 2.03 | 1.97 | 1.88 | 1.58 |
| 12 | Residual Chlorine | 0.00 | 0.00 | 0.00 | 0.00 | 0.00 | 0.00 |
| 13 | Phosphate | 0.31 | 0.40 | 0.19 | 0.10 | 0.11 | 0.25 |
| 14 | Calcium (Ca+2) | 168.84 | 144.67 | 95.17 | 83.98 | 66.62 | 108.67 |
| 15 | Magnesium (Mg+2) | 32.33 | 33.68 | 102.83 | 107.48 | 83.02 | 45.67 |
| 16 | Iron | 0.0868 | 0.0270 | 0.0186 | 0.0337 | 0.0370 | 0.0315 |
| 17 | Zinc | 0.0015 | 0.0015 | 0.0013 | 0.0015 | 0.0014 | 0.0016 |
| EWi | 21.11 | 21.11 | 21.11 | 21.11 | 21.11 | 21.11 | |
| EQiWi | 3384.38 | 4248.32 | 2131.81 | 1286.05 | 1424.24 | 2781.38 | |
| WQI = EQiWi/ EWi | 160.34 | 201.27 | 101.00 | 60.93 | 67.47 | 131.77 | |
Table 7: shows the seasonal mean values of physicochemical characteristics and the Water Quality Index in Area -02 areas from 2019 to 2020.
S.No | Parameter | Sampling codes and its results (Mean Values) | ||||||
BS7 | BS8 | BS9 | BS10 | BS11 | BS12 | BS13 | ||
1 | pH | 7.12 | 7.47 | 7.01 | 7.27 | 7.19 | 7.44 | 7.53 |
2 | Dissolved Oxygen | 4.93 | 4.87 | 5.12 | 5.03 | 4.87 | 4.87 | 4.75 |
3 | Turbidity(NTU, Max) | 1.29 | 0.85 | 1.43 | 2.32 | 0.62 | 0.96 | 0.91 |
4 | Total Dissolved Solids at 105oC | 551.50 | 856.33 | 959.67 | 398.00 | 595.00 | 607.00 | 613.00 |
5 | Total Hardness as CaCO3 | 262.83 | 392.64 | 527.32 | 224.59 | 355.68 | 353.76 | 392.00 |
6 | Total Alkalinity as CaCO3 | 322.00 | 443.50 | 467.67 | 270.17 | 269.50 | 279.33 | 286.67 |
7 | Chlorides as Cl- | 69.83 | 169.83 | 175.33 | 31.00 | 120.08 | 133.67 | 136.83 |
8 | Sulphates as SO42- | 23.83 | 39.00 | 60.83 | 21.33 | 40.33 | 28.67 | 41.83 |
9 | Fluorides as F- | 1.13 | 0.54 | 1.20 | 0.93 | 1.26 | 1.27 | 1.35 |
10 | Nitrogen as NO3 | 24.00 | 21.00 | 56.00 | 1.42 | 31.17 | 29.33 | 10.60 |
11 | Biochemical Oxygen Demand | 1.88 | 3.00 | 1.75 | 2.33 | 2.54 | 1.83 | 2.21 |
12 | Residual Chlorine | 0.00 | 0.00 | 0.00 | 0.00 | 0.00 | 0.00 | 0.00 |
13 | Phosphate | 0.10 | 0.02 | 0.03 | 0.18 | 0.09 | 0.13 | 0.03 |
14 | Calcium (Ca+2) | 79.50 | 60.33 | 75.00 | 64.45 | 89.50 | 84.33 | 104.33 |
15 | Magnesium (Mg+2) | 15.67 | 58.83 | 82.67 | 15.50 | 32.17 | 34.83 | 32.00 |
16 | Iron | 0.0355 | 0.0342 | 0.0251 | 0.0348 | 0.0412 | 0.0483 | 0.0458 |
17 | Zinc | 0.0016 | 0.0018 | 0.0024 | 0.0044 | 0.0040 | 0.0034 | 0.0018 |
| EWi | 21.11 | 21.11 | 21.11 | 21.11 | 21.11 | 21.11 | 21.11 |
| EQiWi | 1314.53 | 373.29 | 616.08 | 2214.82 | 1206.63 | 1581.40 | 633.50 |
| WQI = EQiWi/ EWi | 62.28 | 17.69 | 29.19 | 104.93 | 57.17 | 74.92 | 30.01 |
Table 8: shows the seasonal mean values of physicochemical characteristics and Water Quality Index values in Area -03 A areas from 2019 to 2020.
S.No. | Parameters | Sampling codes and its results (Mean Values) | |||||
BS14 | BS15 | BS16 | BS17 | BS18 | BS19 | ||
1 | pH | 7.35 | 7.57 | 7.72 | 7.01 | 7.11 | 7.80 |
2 | Dissolved Oxygen | 4.60 | 4.52 | 4.73 | 4.62 | 5.07 | 4.70 |
3 | Turbidity(NTU, Max) | 1.31 | 0.89 | 1.66 | 1.33 | 1.59 | 0.87 |
4 |
Total Dissolved Solids at 105 oC | 1372.67 | 1211.83 | 1666.50 | 1782.67 | 2032.33 | 1551.33 |
5 | Total Hardness as CaCO3 | 340.37 | 345.06 | 201.67 | 252.37 | 796.34 | 426.22 |
6 | Total Alkalinity as CaCO3 | 635.67 | 578.33 | 868.00 | 865.33 | 727.83 | 677.17 |
7 | Chlorides as Cl- | 282.67 | 249.33 | 282.67 | 316.00 | 573.17 | 295.00 |
8 | Sulphates as SO42- | 78.17 | 87.83 | 80.50 | 114.67 | 108.83 | 139.50 |
9 | Fluorides as F- | 1.51 | 1.36 | 1.47 | 1.37 | 1.41 | 1.35 |
10 | Nitrogen as NO3 | 39.33 | 10.75 | 28.00 | 49.50 | 70.67 | 41.50 |
11 | Biochemical Oxygen Demand | 2.72 | 2.35 | 2.90 | 3.37 | 1.67 | 3.17 |
12 | Residual Chlorine | 0.00 | 0.00 | 0.00 | 0.00 | 0.00 | 0.00 |
13 | Phosphate | 0.36 | 0.12 | 0.27 | 0.37 | 0.40 | 0.31 |
14 | Calcium (Ca+2) | 75.67 | 50.33 | 27.50 | 36.00 | 118.50 | 69.67 |
15 | Magnesium (Mg+2) | 36.83 | 53.33 | 32.33 | 39.50 | 121.67 | 61.33 |
16 | Iron | 0.0187 | 0.0881 | 0.0214 | 0.0250 | 0.0288 | 0.0266 |
17 | Zinc | 0.0027 | 0.0027 | 0.0026 | 0.0024 | 0.0022 | 0.0028 |
| EWi | 21.11 | 21.11 | 21.11 | 21.11 | 21.11 | 21.11 |
| EQiWi | 3914.84 | 1600.91 | 3083.81 | 4082.00 | 4399.81 | 3413.46 |
| WQI = EQiWi/ EWi | 185.47 | 75.85 | 146.10 | 193.39 | 208.45 | 161.72 |
Table 9: shows the mean values of physicochemical properties in Area -03 B areas. Seasonally during the 2019-2020 study period
S.No | Parameter | Sampling codes and its results (Mean Values) | ||||
BS20 | BS21 | BS22 | BS23 | BS24 | ||
1 | pH | 7.51 | 7.60 | 7.19 | 7.22 | 7.19 |
2 | Dissolved Oxygen | 4.73 | 4.13 | 4.08 | 4.72 | 4.78 |
3 | Turbidity(NTU, Max) | 0.84 | 1.24 | 2.60 | 2.18 | 1.38 |
4 | Total Dissolved Solids at 105 oC | 1120.83 | 1859.33 | 2371.67 | 2390.67 | 863.67 |
5 | Total Hardness as CaCO3 | 284.68 | 293.50 | 281.78 | 608.39 | 338.96 |
6 | Total Alkalinity as CaCO3 | 528.33 | 790.17 | 651.00 | 615.83 | 500.17 |
7 | Chlorides as Cl- | 229.33 | 367.00 | 608.17 | 592.50 | 118.83 |
8 | Sulphates as SO42- | 66.33 | 129.17 | 245.83 | 237.33 | 40.83 |
9 | Fluorides as F- | 1.09 | 1.44 | 1.50 | 1.46 | 1.38 |
10 | Nitrogen as NO3- | 22.83 | 55.00 | 136.17 | 201.17 | 24.20 |
11 | Biochemical Oxygen Demand | 1.32 | 2.44 | 2.93 | 3.39 | 1.96 |
12 | Residual Chlorine | 0.00 | 0.00 | 0.00 | 0.00 | 0.00 |
13 | Phosphate | 0.33 | 0.23 | 0.33 | 0.35 | 0.27 |
14 | Calcium (Ca+2) | 49.50 | 29.67 | 53.83 | 91.00 | 85.00 |
15 | Magnesium (Mg+2) | 39.17 | 53.33 | 35.83 | 92.67 | 30.83 |
16 | Iron | 0.0238 | 0.0203 | 0.0302 | 0.5792 | 0.0410 |
17 | Zinc | 0.0019 | 0.0041 | 0.0051 | 0.0037 | 0.0030 |
| EWi | 21.11 | 21.11 | 21.11 | 21.11 | 21.11 |
| EQiWi | 3523.42 | 2640.80 | 3806.44 | 4683.13 | 3091.95 |
| WQI = EQiWi/ EWi | 166.93 | 125.11 | 180.34 | 221.87 | 146.49 |
Table 10: shows the seasonal mean values of physicochemical characteristics in Area -04 areas from 2019 to 2020.
S.No | Parameter | Sampling codes and its results (Mean Values) | |||
BS25 | BS26 | BS27 | BS28 | ||
1 | pH | 7.02 | 6.86 | 7.44 | 7.49 |
2 | Dissolved Oxygen | 4.13 | 4.22 | 4.83 | 4.93 |
3 | Turbidity(NTU, Max) | 1.46 | 1.00 | 1.56 | 0.61 |
4 | Total Dissolved Solids at 105 oC | 2789.83 | 2310.33 | 1345.33 | 474.67 |
5 | Total Hardness as CaCO3 | 1249.02 | 1367.99 | 753.43 | 292.58 |
6 | Total Alkalinity as CaCO3 | 729.83 | 799.67 | 615.83 | 228.50 |
7 | Chlorides as Cl- | 751.67 | 571.17 | 315.50 | 60.67 |
8 | Sulphates as SO42- | 272.00 | 190.00 | 71.50 | 66.17 |
9 | Fluorides as F- | 1.52 | 1.39 | 1.50 | 1.15 |
10 | Nitrogen as NO3 | 228.33 | 149.50 | 35.67 | 21.50 |
11 | Biochemical Oxygen Demand | 2.80 | 2.16 | 1.57 | 1.18 |
12 | Residual Chlorine | 0.00 | 0.00 | 0.00 | 0.00 |
13 | Phosphate | 0.53 | 0.34 | 35.67 | 0.39 |
14 | Calcium (Ca+2) | 235.33 | 273.67 | 1.57 | 81.50 |
15 | Magnesium (Mg+2) | 160.83 | 166.50 | 104.27 | 21.68 |
16 | Iron | 0.2175 | 0.0413 | 0.1736 | 0.1512 |
17 | Zinc | 0.0259 | 0.0030 | 0.0188 | 0.0180 |
| EWi | 21.11 | 21.11 | 21.11 | 21.11 |
| EQiWi | 5955.48 | 3767.51 | 2197.58 | 4278.56 |
| WQI = EQiWi/ EWi | 282.15 | 178.49 | 104.11 | 202.70 |
Table 11: shows the seasonal mean values of physicochemical characteristics in Area -05 areas from 2019 to 2020.
S.No | Parameters | Sampling codes and its results (Mean Values) | ||||
BS29 | BS30 | BS31 | BS32 | BS33 | ||
1 | pH | 7.40 | 7.14 | 7.51 | 7.49 | 7.52 |
2 | Dissolved Oxygen | 5.45 | 5.45 | 5.52 | 5.47 | 5.33 |
3 | Turbidity(NTU, Max) | 0.66 | 0.47 | 0.51 | 0.45 | 0.58 |
4 | Total Dissolved Solids at 105 oC | 642.17 | 739.83 | 715.00 | 458.83 | 586.17 |
5 | Total Hardness as CaCO3 | 266.06 | 383.54 | 320.42 | 225.06 | 317.35 |
6 | Total Alkalinity as CaCO3 | 266.67 | 283.83 | 301.83 | 266.50 | 322.50 |
7 | Chlorides as Cl- | 142.35 | 208.97 | 180.43 | 56.45 | 98.33 |
8 | Sulphates as SO42- | 38.08 | 45.36 | 29.47 | 26.92 | 32.06 |
9 | Fluorides as F- | 0.77 | 0.58 | 0.71 | 0.69 | 0.66 |
10 | Nitrogen as NO3 | 35.10 | 12.34 | 25.73 | 25.90 | 19.19 |
11 | Biochemical Oxygen Demand | 2.45 | 3.74 | 1.37 | 1.81 | 1.47 |
12 | Residual Chlorine | 0.00 | 0.00 | 0.00 | 0.00 | 0.00 |
13 | Phosphate | 0.29 | 0.17 | 0.13 | 0.10 | 0.20 |
14 | Calcium (Ca+2) | 62.23 | 90.80 | 84.00 | 39.73 | 67.90 |
15 | Magnesium (Mg+2) | 26.92 | 38.15 | 26.93 | 30.60 | 35.95 |
16 | Iron | 0.0205 | 0.0216 | 0.0258 | 0.0179 | 0.03 |
17 | Zinc | 0.0019 | 0.0021 | 0.0025 | 0.0247 | 0.01 |
| EWi | 21.11 | 21.11 | 21.11 | 21.11 | 21.11 |
| EQiWi | 3137.67 | 1855.20 | 1550.01 | 1154.24 | 2218.48 |
| WQI = EQiWi/ EWi | 148.65 | 87.89 | 73.43 | 54.68 | 105.10 |
Water Quality Index
The WQI for 33 sampling stations was shown in various indexes (Table 10). According to the WQI, the following four sampling stations in Area 1 are not suitable for drinking water: BS3, BS1, BS5, BS2, and BS6. is categorized as very poor, while BS4 is classified as poor. According to the WQI, the sampling station BS10 is not suitable for drinking, BS12 is in the very poor category, BS7 is in the poor category, and the remaining sampling stations BS8, BS9, and BS13 are in the excellent category. The sampling stations BS21, BS22, BS16, BS14, BS18, BS23, BS17, BS19, BS20, and BS24 in Area 03 are classified as 'not suitable for drinking' water. Only one sampling station, BS15, is categorized as'very poor.' Area 04 sampling stations such as BS27, BS26, BS25, and BS28 are classified as 'not suitable for drinking' water. Area 05 sampling stations such as BS 29, BS30, and BS33 are categorized as 'not suitable for drinking' water. The sampling station BS31 falls into the very poor category, while the sampling station BS32 falls into the' moderate' water category. Area-3 and Area-4 have the highest values in the entire study area because they are so close to JNPC Pharma. The ground water in the two areas was primarily affected due anthropogenic factors rather than geological conditions. Unsystematic disposal of liquid and solid wastes, i.e. domestic and industrial effluents, is also suspected of contributing to the higher concentration levels in this study area.
Table 12: The Water Quality Index findings for the research region are shown.
Year | 2019 | 2020 |
| ||||||
S.No. | Station code | Summer | Rainy | Winter | Summer | Rainy | Winter | MEAN | |
Area 01: Lankalapalem Village Area |
| ||||||||
1 | BS1 | 161.51 | 148.83 | 128.71 | 163.43 | 233.32 | 126.24 | 160.34 | |
2 | BS2 | 163.75 | 118.36 | 215.69 | 254.79 | 234.25 | 220.79 | 201.27 | |
3 | BS3 | 125.88 | 98.75 | 80.93 | 89.59 | 98.92 | 111.91 | 101.00 | |
4 | BS4 | 40.24 | 54.08 | 70.67 | 68.32 | 53.04 | 79.21 | 60.93 | |
5 | BS5 | 78.79 | 72.56 | 53.14 | 52.87 | 67.2 | 80.28 | 67.47 | |
6 | BS6 | 80.02 | 128.99 | 161.18 | 72.81 | 186.15 | 161.48 | 131.77 | |
Area 02: China Tadi / Kannuru Village Area |
| ||||||||
9 | BS7 | 50.89 | 33.86 | 73.83 | 81.47 | 81.55 | 52.06 | 62.28 | |
10 | BS8 | 14.18 | 20.03 | 23.79 | 14.71 | 14.82 | 18.59 | 17.69 | |
11 | BS9 | 28.03 | 30.72 | 25.28 | 31.32 | 30.59 | 29.18 | 29.19 | |
12 | BS10 | 85.22 | 96.17 | 132.66 | 129.29 | 104.42 | 81.82 | 104.93 | |
13 | BS11 | 50.19 | 52.52 | 41.74 | 79.12 | 70.53 | 48.9 | 57.17 | |
14 | BS12 | 70.26 | 76.47 | 81.45 | 71.53 | 78.33 | 71.48 | 74.92 | |
15 | BS13 | 32.9 | 29.51 | 33.34 | 30.3 | 25.17 | 28.86 | 30.01 | |
Area 03: Tanam Village Area |
| ||||||||
16 | BS14 | 167.08 | 211.03 | 115.28 | 188.73 | 264.31 | 166.38 | 185.47 | |
17 | BS15 | 45.08 | 76.04 | 51.36 | 36.84 | 189.93 | 55.82 | 75.85 | |
18 | BS16 | 130.82 | 169.23 | 118.62 | 117.44 | 190.39 | 150.1 | 146.10 | |
19 | BS17 | 168.42 | 233.89 | 173.91 | 150.93 | 238.6 | 194.6 | 193.39 | |
20 | BS18 | 177.98 | 217.24 | 204.39 | 196.02 | 237.73 | 217.33 | 208.45 | |
21 | BS19 | 142.34 | 170.96 | 128.86 | 151.49 | 215.61 | 161.04 | 161.72 | |
22 | BS20 | 39.69 | 390.59 | 203.41 | 247.7 | 69.97 | 50.21 | 166.93 | |
23 | BS21 | 129.41 | 154.55 | 99.87 | 90.81 | 170.37 | 105.65 | 125.11 | |
24 | BS22 | 175.86 | 242.71 | 179.25 | 157.3 | 233.92 | 92.97 | 180.34 | |
25 | BS23 | 178.82 | 264.31 | 264.72 | 204.25 | 241.21 | 177.91 | 221.87 | |
26 | BS24 | 115.47 | 167.94 | 128.98 | 141.65 | 175.09 | 149.77 | 146.48 | |
| Area 04: Parawada Village Area |
| |||||||
27 | BS25 | 270.66 | 335.36 | 241.28 | 203.03 | 360.18 | 282.38 | 282.15 | |
28 | BS26 | 167.49 | 236.4 | 116.76 | 167.25 | 244.13 | 138.92 | 178.49 | |
29 | BS27 | 83.76 | 103.6 | 78.93 | 125.15 | 173.91 | 59.34 | 104.12 | |
30 | BS28 | 162.79 | 198.27 | 217.09 | 205.95 | 268.51 | 163.61 | 202.70 | |
| Area 05:Other Villages Area. |
| |||||||
31 | BS29 | 141.31 | 203.54 | 114.95 | 94.88 | 227.92 | 109.31 | 148.65 | |
32 | BS30 | 66.03 | 106.11 | 52.73 | 75.26 | 161.24 | 65.98 | 87.89 | |
33 | BS31 | 47.15 | 60.67 | 54.75 | 64.88 | 161.43 | 51.71 | 73.43 | |
34 | BS32 | 31.36 | 65.59 | 46.35 | 27.35 | 107.67 | 49.79 | 54.69 | |
35 | BS33 | 65.93 | 108.06 | 106.61 | 122.87 | 143.12 | 84.03 | 105.10 | |
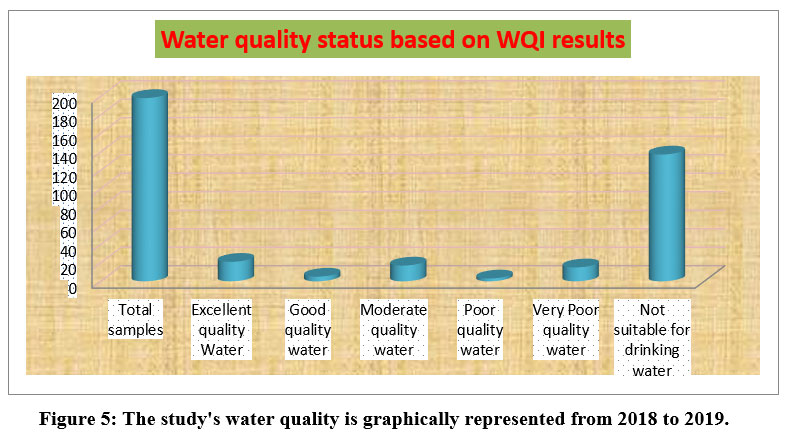 | Figure 5: The study's water quality is graphically represented from 2018 to 2019.
|
Conclusions
The WQI ranges from 14.18 to 390.6 for 33 stations. The majority of the stations are not suitable for drinking. Out of 198 samples, 21 are classified as having excellent water quality, 5 as having good water quality, 17 as having moderate water quality, 3 as having poor water quality, 15 as having very poor water quality, and the remaining 137 are classified as not meet for drinking purpose. Although 69.19% of the samples may have been present, most of them were unfit for human consumption.The percentage of very good water quality is only 10.6%. Area 2 sample stations BS8, BS9, and BS13 have excellent water quality. The water of moderate quality is present at one sampling location. Only three sampling sites contain water that is poor. The most severely impacted sample locations were those in Areas 3 and 4. The water at the majority of the sampling stations was found to be unsafe for drinking or domestic use based on the observations mentioned above. In some samples, the physicochemical parameter characteristics were also recorded in an abnormal state. During the rainy season, many disparities were discovered.
Scope for further study
The current investigation shows that the studied area's local ground water is being affected. Further, research should be done to determine the elements, such as septic tank percolation, industrial activity, seawater intrusion, and air quality monitoring, that have an impact on the quality of the groundwater in this region.Surface water studies should also be done in the area. The current study will support effective planning and management of the drinking water resources that are already available.
Recommendations
Groundwater is primarily impacted in the villages of Parawada and Tanam. As a result, alternate drinking water sources must be provided for these villagers, as well as the construction and development of scientific sewage systems and made channels to avoid ground water contamination.
Remedial measures
This study area is a highly mineralized area. Some parameters are showing higher values. Hence, the following water purification methods are recommended to minimize the abnormal concentration of the above-mentioned parameters. They are ultra-filtration, flocculation, precipitation, reverse osmosis, ion exchange technique, slow sand filtering, and membrane filtering. Moreover, flotation ion exchange and electrochemical deposition are some best useful techniques for the removal of pollutants and contaminants to purify groundwater.
Acknowledgements
The authors are thankful to the Department of Environmental Sciences, Acharya Nagarjuna University, Nagarjuna Nagar for constant encouragement.
Author contribution
M. Bujjibabu conceptualised, methodology, analysis and investigation. Dr. Sharmila N-Review of literature manuscript preparation, etc. Dr. B. Hari Babu supervised the work and editing.
Data availability
The author analysed the data and used it in the current study(Detailed data available with author).
Testimonies
Ethics approval- NA.
Consent for publication - All the authors reviewed, and agreed for the publication of final draft.
Competing interests - NA.
References:
- Sylverster, A., (2003) Quality of surface water, River Birim as a case study. Dept of Chemistry, KNUST, Kumasi, Ghana. pp 34.
- Krishan A, Mishra RK, Khursheed A , (2022)Assessment of water quality using water quality index: a case study of the River GomtiLucknow, Uttar Pradesh, India. UrbanWater J. page.520-530. https:// doi. org/ 10. 1080/ 15730 62X. 2022. 20322 10.
CrossRef - Amirabdollahian M, Datta B (2013) Identification of contaminant source characteristics and monitoring network design in groundwater aquifers: an overview. J Environ Prot 4: page. 26–41.
CrossRef - Rubia Khan, D. C. Jhariya (2017) Groundwater quality assessment for drinking purpose in Raipur city, Chhattisgarh using water quality index and geographicinformation system, Journal of the Geological Society of India.90, page.69-76.
CrossRef - Tyagi, Shweta, Prashant Singh, RajendraDobhal, D.P. Uniyal, Bhavtosh Sharma, and Rakesh Singh, (2015) Spatial and temporal variations in quality of drinking water sources of Dehradun district in India", International Journal of Environmental Technology and Management. vol. 18(5/6), page. 375-399.
CrossRef - Al-Sudani HIZ (2019) A review on groundwater pollution. Int J Recent EngSci (IJRES) 6(5): page. 2349–7157.
CrossRef - Panigrahi T, Das KK, Dey BS, Panda RB, (2012) Assessment of Water Quality of river Sono, Balasore. Int J Environ Sci 3: page. 49–56.
- Arjun Ram, S. K. Tiwari, H. K. Pandey, Abhishek Kumar Chaurasia, Supriya Singh, Y. V.Singh (2021) Groundwater quality assessment using water quality index (WQI) under GIS frame work, Applied Water Science.(2021) 11:46, page.1-20; https://doi.org/10.1007/s13201-021- 01376-7.
- Mishra S, Kumar A (2021) Estimation of physicochemical characteristics and associated metal contamination risk in the Narmada River. India Environ Eng Res 26 (1) :190521.Volume 26(1);page. 1-11. https:// doi. org/ 10. 4491/ peer. 2019. 521.
CrossRef - Ewaid SH, Abed SA, Al-Ansari N, Salih RM (2020) Development and evaluation of a water qualityindex for the Iraqi rivers. Hydrology 7:67, page.1- 14. https:// doi. org/ 10. 3390/ hydrology7030067.
CrossRef - Nong X, Shao D, Zhong H, Liang J (2020) Evaluation of water quality in the South-to-North Water Diversion Project of China using the water quality index (WQI) method. Water Research,Volume.178:1-6;115781. https:// doi. org/ 10. 1016/j. waters. 2020. 115781.
CrossRef - Stambuk-Giljanovic, (1999) Water quality evaluation by index in Dalmatia. Water Res. 33, page.3423-3440.
CrossRef - Reza, R., Singh G (2010) Heavy metal contamination and its indexing approach for river water. Int. J. Environ. Sci. Technol. 7, page.785-792. https://doi.org/10.1007/BF03326187.
CrossRef - Horton, R.K., (1965) An index number for rating water quality. J. Water Poll. Cont. Fed. 37, page. 300-306.
- Ali SY, Sunar S, Saha P, Mukherjee P, Saha S, Dutta S (2021) Drinking water qualityassessment of river Ganga in West Bengal, India through integrated statistical and GIS techniques. Water SciTechnol 84: page 2997–3017. https:// doi. org/ 10. 2166/ wst. 2021. 293.
CrossRef - APHA (American Public Health Association - 1994) Standard method for examination of water and wastewater, NW, DC.
- District hand book–Visakhapatnam – 2016 &utilizing Google as a resource.
- Pawar, R.S., Panaskar, D.B., Wagh, V.M.(2013) Characterization of ground water using Groundwater quality index of Solapur industrial belt, Maharashtra. Int. J. Res. Eng.Technol.2, page. 31-36.
- Prashant Singh, RajendraDobhal, Richa Seth, Ravinder Singh Aswal, Rakesh Singh, DP Uniyal, Bhavtosh Sharma (2015 ) Spatial and Temporal Variations in Surface WaterQuality of Pithoragarh District, Uttarakhand (India), Analytical ChemistryLetters.Volume 5 (5), pages 267-290.
CrossRef - BIS (1991 / 1993 / 2003 / 2010/2017) IS 10500 -2012: Amendments: 1993, 2003, 2010 & 2017. Drinking Water Bureau of Indian Standards.
- Brown, R.M., McClelland, N.J., Deininger, R.A., O’Connor, M. F., (1972) A Water quality Index-crashing, the psychological barrier, Proc. 6th Annual Conference, Advances in Water Pollution Research. page. 787-794.
CrossRef - Kakati, S.S., Sarma, H.P., (2007) Water quality index of drinking water of Lakhimpur district. Indian J. Environ. Prot. 27, page.425-428.
- Chauhan, A., Pawar, M., Lone, S.A, (2010) Water quality status of golden key lake inClement town, Dehradun, Uttarakhand. J. Am. Sci. 6(11): page. 459-464.
- Sahu, B.K., Panda, R.B., Sinha, B.K., Nayak (1991) Water quality index of the river Brahmani at Rourkela Industrial complex of Orissa. J. Eco-toxicol. Environ. Moni. Volume .1, page. 169-175.
- Sinha, D.K., Shilpi, S., Ritesh, S (2004) Water quality index for Ram Ganga River at Mordabad. Poll. Res. 23, page. 527-531.
- Tripaty J. K., Sahu, K. C., (2005) Seasonal hydrochemistry of groundwater in the barrier-spit system of Chilika lagoon. J. Environ. Hydrol. 12, page 1-9.
- Abhishek, C.K., Pandey, H.K., Tiwari, S.K., Ram, P., Pandey, P., Arjun, R.,(2018) Groundwater quality assessment using Water Quality Index (WQI) in parts of Varanasi District, Uttar Pradesh, India. J. Geol. Soc. India. 92, page.76-82. https://doi.org/10.1007/s12594-018-0955-1.
CrossRef - Jasmine P.( 2020) Water quality index of Aedesaegypti (L) breeding sites in southern coastal areas of India, Indian Journal of Science and Technology. 13(12): page.1310-1315. https://doi.org/ 10.17485/IJST/v13i12.87
CrossRef - Seth, Richa, et al. (2016) Water quality evaluation of Himalayan rivers of Kumaun region, Uttarakhand, India. Applied Water Science 6(2) page.137-147.
CrossRef - Bairu, A, N Tadesse, and S Amare (2013) Use of geographic information system and water quality index to assess suitability of groundwater quality for drinking purposes in Hewane areas, Tigray, Northern Ethiopia, Ethiopian Journal of Environmental Studies and ManagementVol. 6 No.2, page. 110- 123.
CrossRef


