Indoor and Outdoor Air Quality Assessment of SO2 and NO2 in Suburban Schools in Imphal, Manipur
Rajukumar Khumukcham
and Raju Singh Khoiyangbam
*

1
Department of Forestry and Environmental Science,
Manipur University,
Canchipur Imphal,
Manipur
India
http://dx.doi.org/10.12944/CWE.17.3.11
Copy the following to cite this article:
Khumukcham R, Khoiyangbam R. S. Indoor and Outdoor Air Quality Assessment of SO2 and NO2 in Suburban Schools in Imphal, Manipur. Curr World Environ 2022;17(3). DOI:http://dx.doi.org/10.12944/CWE.17.3.11
Copy the following to cite this URL:
Khumukcham R, Khoiyangbam R. S. Indoor and Outdoor Air Quality Assessment of SO2 and NO2 in Suburban Schools in Imphal, Manipur. Curr World Environ 2022;17(3).
Download article (pdf)
Citation Manager
Publish History

Introduction
Intensification of air pollutant levels in urban areas has become a significant problem with fast economic growth, especially in metropolitan cities.1 Majority of air pollution fatalities occur in developing countries, where laws are not adequately enforced and emission standards are less stringent.2 In India, traffic emissions are a significant source of air pollution and associated damage to human health.3 Vehicle emissions are problematic for human health, road safety, and the global environment.4 However, there is uncertainty in vehicle emission estimations in India due to the lack of reliable emission factors representing real-world driving data.5 The complicated impacts of urban-scale urban forms on air pollution are poorly understood.6 Air quality in the indoor environment is a critical determinant of the level of comfort, health status, and well-being of the building residents.7 Understanding the importance of good Indoor Air Quality (IAQ) in school is the backbone of developing an effective IAQ program.8 Good air quality in classrooms becomes an essential need for children in their learning ability and benefits their health. Students, teachers, and staff working in classrooms with poor air quality may develop chronic and acute health issues. Although clean air may be a fundamental human right, many schoolchildren worldwide do not access it, posing an increased risk of sickness and pollution.9 Microclimate in the classroom is one of the crucial indicators of whether the environment is healthy or unhealthy.10 Children are highly vulnerable to air pollutants that impact their respiratory system, leading to asthma, allergic rhinitis, and eczema due to their air-breathing pattern and lower body mass index.11 As per the World Health Organisation (WHO) report, the primary air pollutants, such as SO2, NO2, CO2, O3, and Particulate Matter (PM), affect human health, causing severe diseases among various age groups.12 Sulphur dioxide is one of the primary gaseous effluents released from the combustion of sulphur-containing fuels, and the pollutant is the main issue of air pollution problems in developing countries.13 Sources of air pollutants in urban areas include transportation sectors, power plants, industrial boilers, incinerators, petrochemical plants, aircraft, and ships.14 Oxides of nitrogen are detrimental to the human respiratory system, and NOx is directly or indirectly involved in ozone and particulate formation.15 Exposure to high levels of air pollutants poses a higher risk of developing chronic illnesses like cardiovascular disease in children, creating complicated health issues later in life.16 Children who attend schools near roadways face the potential risk of exposure to various contaminants arising from roads, thereby, are more prone to hazardous health impacts.17 As a result of a poor public transport network, residents in Imphal increasingly rely on private vehicles in and around Imphal city.18 The current investigation aimed to evaluate the concentrations of NO2 and SO2 in three suburban roadside schools situated along the National Highways passing through Imphal city.
Materials and Methods
Study area
Manipur is a hilly state on the Indo-Myanmar border in northeastern India. Imphal, the capital city (24.7210 N & 24.8830 N and 93.8870 E & 93.9820 E) of Manipur, is situated in a small mountain valley embedded in the offshoot hilly tract of the Himalayas. Imphal valley occupies about 10% of the state’s geographical area, situated at 786 m a.m.s.l. By catering to administrative, commercial and other local needs, Imphal serves as the gateway city, connecting mainland India with the Southeast Asiatic countries. The present study was conducted in three suburban schools in Imphal. The schools taken up for the current study are SU-1: Manipur Public school, Koirengei, SU-2: Standard Robarth Higher Secondary school, Canchipur, and SU-3: Children’s Training school, Langol in Imphal. Out of the three, the first two schools are situated along the National Highway (SU-1 and SU-2 are located along the NH-2 and NH-102, respectively), while the third is located in a residential area. The study was conducted for eleven months (March 2018 – February 2019), covering three seasons, viz. the pre-monsoon, monsoon and winter. The instrument was run for eight hours on each air sampling day, starting from 8 am to 4 pm. Sampling campaigns were reported twice a month, covering 22 samplings in each school in the eleven months study period. The main air pollution sources in the suburban areas of Imphal include vehicular emissions, small enterprises, diesel-powered electric backup generators (especially in commercial and settlement zones), diesel-run mobile tower generators, domestic activities, etc.
Table 1: Some characteristics of the schools under study
Parameters | SU-1 | SU-2 | SU-3 |
Location | Residential | Residential | Residential |
Distance from NH | ~10 m | ~5 m | ? |
Educational Standard | 1st to 12th | 11th and 12th | Pre-nursery to 10th |
Total No. of students | ~ 950 | ~ 450 | ~ 400 |
Source of pollutants | Transportation & Domestic | Transportation & Domestic | Domestic |
Details of Air Monitoring Room | |||
Standard | 3rd Standard | 11th Standard | 1st Standard |
No.of occupants during sampling | 28±05 | 43±05 | 22±05 |
Type of Room | Classroom | Classroom | Classroom |
Building type (Floor) | Concrete (Ground floor) | Concrete (Ground floor) | Concrete (Ground floor) |
Sampling and analysis
Measurements of NO2 and SO2 were conducted parallelly inside the classroom and in the outside environment of the schools. The NO2 and SO2 concentrations in the air were measured using portable gaseous samplers (Envirotech APM 433). The concentration of SO2 was analysed following the standard methods described by the Improved West and Gaeke method.17 The airborne NO2 level was analysed following Modified Jacob and Hochheiser method.19 The respective absorbing solution (30 mL) for the two gases was lodged in separate midget impingers for carrying out the sampling. The sampling air was bubbled through the respective absorbing agent at the rate of 1 Litre Per Minute (LPM). The NO2 and SO2 content in the air was determined colourimetrically (Genesys 180) at 540 nm and 560 nm wavelengths respectively.
Statistical analysis
The variation in the concentrations of NO2 and SO2 during the study period was evaluated using the One-way ANOVA with Tukey (HSD) Post Hoc test. SPSS software was employed for the statistical calculations.
Results and Discussion
The results obtained during our assessment of SO2 and NO2 in the suburban schools of Imphal are presented in Tables 2 and 3. In the three suburban schools, the concentrations of indoor SO2 for the entire study period ranged between 2.5 and 7.7 ?gm-3, and the mean was 4.7±1.1 ?g m-3. The corresponding level of SO2 in outdoor air during the same period ranged between 2.7 and 8.4 ?gm-3 with a mean of 5.2±1.2?g m-3. For NO2, the indoor concentrations ranged between 5.0 and 13.9?gm-3, while the outdoor concentration ranged between 5.0 and 15.1 ?g m-3. The mean SO2 and NO2 content in the indoor and outdoor air for the three schools for the entire study period were 4.9±1.5 ?g m-3 and 9.2±3.0 ?g m-3. Dambajamts et al.(2019).20 reported that the two-year mean levels of SO2 in schools in Ulaanbaatar, Mongolia ranged between 4.4 ppb and 10.1 ppb, while the highest concentrations ranged between 36 ppb and 63 ppb. Salonen et al.(2019).21 concluded that the average levels of NO2 in schools ranged between 6.00 and 68.5 ?g m-3, and concentrationin office environments ranged between 3.40 and 56.5 ?g m-3. The levels of the two studied gaseous pollutants in the classroom reported by these authors are comparatively higher than the observations obtained in the current study. Clean air is a concern in the megacities in India, as the content of fine particulates, SO2, and NO2, are frequently found to exceed the limits of the National Ambient Air Quality Standards (NAAQS).22 However, many authors claimed that air pollutants like NO2 and SO2, even at low concentrations, may cause harmful effects on human health.23-25 Children are most at risk for health problems related to air pollution.26
Table 2: Seasonal SO2 concentrations in the suburban schools
Schools | Indoor(µg m-3) | Outdoor(µg m-3) | ||||
Pre-monsoon (N=18) | Monsoon (N=24 | Winter (N=24) | Pre-monsoon (N=18) | Monsoon (N=24) | Winter (N=24) | |
Avg±SD | Avg±SD | Avg±SD | Avg±SD | Avg±SD | Avg±SD | |
SU-1 | 5.2±1.8 | 3.2±0.5 | 6.2±0.4 | 5.6±1.9 | 3.8±0.9 | 7.3±0.7 |
SU-2 | 6.2±0.8 | 4.6±0.9 | 5.4±0.5 | 6.8±0.7 | 4.6±0.7 | 6.3±0.6 |
SU-3 | 4.3±0.8 | 3.0±0.2 | 4.2±1.0 | 4.8±1.0 | 3.5±0.4 | 4.5±1.2 |
All-SU | 5.2±1.4 | 3.6±0.9 | 5.3±1.1 | 5.7±1.5 | 4.0±0.8 | 6.0±1.4 |
Table 3: Seasonal NO2 concentrations in the suburban schools
Schools | Indoor(µg m-3) | Outdoor(µg m-3) | ||||
Pre-monsoon (N=18) | Monsoon (N=24) | Winter (N=24) | Pre-monsoon (N=18) | Monsoon (N=24) | Winter (N=24) | |
Avg±SD | Avg±SD | Avg±SD | Avg±SD | Avg±SD | Avg±SD | |
SU-1 | 8.1±1.1 | 6.8±1.4 | 13.0±0.6 | 9.3±1.3 | 7.9±1.4 | 14.2±0.7 |
SU-2 | 10.3±1.9 | 8.9±1.9 | 10.8±1.1 | 12.9±1.9 | 9.8±2.3 | 11.9±1.8 |
SU-3 | 6.7±1.1 | 5.9±0.6 | 7.0±2.6 | 7.0±1.7 | 6.5±0.9 | 7.7±3.2 |
All-SU | 8.4±2.0 | 7.2±1.8 | 10.3±3.0 | 9.7±2.9 | 8.1±2.1 | 11.3±3.4 |
The mean concentrations of the two air pollutants were recorded as highest during the winter, and the concentrations decreased consecutively in the following two seasons. During the winter, the SO2 in classrooms ranged between 3.0 and 6.7 ?g m-3. The NO2 content in the classrooms during the same season ranged between 5.0 and 13.9 ?g m-3 (Table 2 & 3). The outdoor concentrations of the two gases during winter ranged between 3.0 and 8.4 ?g m-3(SO2) and 5.0 and 15.1 ?g m-3 (NO2). Seasonal concentration of the two respective gases during winter was 6.0±1.4 ?g m-3and 11.3±3.4 ?g m-3. The content of SO2 and NO2 in the classroom during the pre-monsoon was between 2.8 and 7.7 ?g m-3and 5.4 and 12.8 ?g m-3. The corresponding levels of the two gases in the campus ambient air during pre-monsoon were between 3.1 and 8.4 ?g m-3and between 5.0 and 14.5 ?g m-3, and the average gaseous content in the air was 5.7±1.5 ?g m-3 and 9.7±2.9 ?g m-3. In monsoon, the content of SO2 in the air ranged between 2.5 and 5.7 ?g m-3, and for NO2, it ranged between 5.1 and 11.1 ?g m-3. In the same period, the SO2 in the outdoor environment was from 2.7 to 5.4 ?g m-3) while the content of NO2 ranged between 5.1 and 14.5 ?g m-3 with respective mean values of 4.0±0.8 ?g m-3 and 8.1±2.1 ?g m-3. Lower gaseous pollutants in the schools during monsoon and pre-monsoon seasons might be due to persistent rainfall and the prevailing turbulent meteorological conditions. In contrast, ambient air is considerably drier during winter, and the washout of pollutants by precipitation is almost non-existent. Mukta et al.(2020).27, in a study at Gazipur, Bangladesh, observed mean seasonal NO2 values of 45.1 ppb, 33.5 ppb, and 13.9 ppb, respectively, during winter, pre-monsoon, and monsoon. The researchers claimed that the washout effect of precipitation lowered the gas concentration during the rainy season. Bodor et al.(2020) 28 believed that seasonal fluctuations in energy usage and air stability influence lower concentrations of air pollutants during warmer times and higher concentrations during the winter. Chutia et al.(2020)29 also observed a pronounced ambient SO2 seasonality over India, with the maximum occurring during winter and a minimum during the monsoon. The authors attributed the winter-maximum concentrations to weaker chemical sink, stagnant meteorological conditions, and elevated emissions. In a satellite-derived correlation, Lin et al.(2019) 30 concluded that higher temperature and relative humidity favour the condensation of SO2 and NO2 into sulfate and nitrate aerosols. The temporal variations (monthly and seasonal) of SO2 and NO2 concentrations in indoor and outdoor environments are presented in Figure 1.
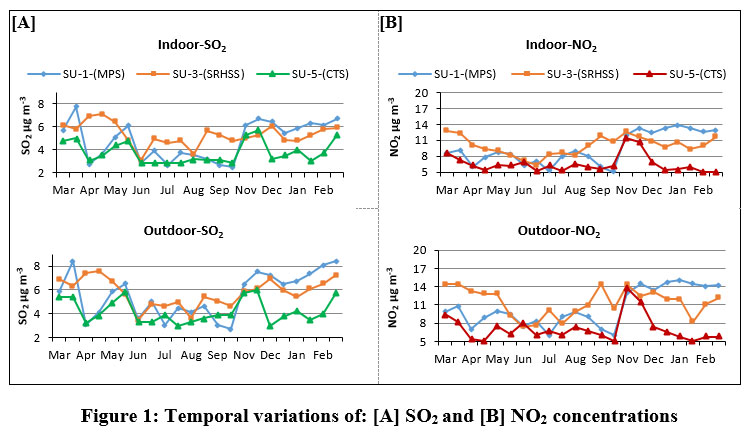 | Figure 1: Temporal variations of: [A] SO2 and [B] NO2 concentrations.
|
The monthly variations of the two pollutants in the classrooms and the ambient air of the three schools are depicted in Figure 1. The highest indoor concentration of SO2 (7.7 µg m-3) occurred during March. However, the peak outdoor concentration (8.4 µg m-3) occurred in two months (March and February) in SU-1. The comparatively higher SO2 and NO2 concentrations obtained in the current study during the pre-monsoon and winter might be due to high temperatures and low humidity. A significant seasonal variation in the concentrations of SO2 was observed between the pre-monsoon and monsoon samplings (at p< 0.001) and also between the monsoon months and winter months (at p< 0.001). For NO2, a significant variation in the concentrations of the gas was observed only between the monsoon and winter (at p< 0.001).
The lowest SO2 concentrations in the schools were observed during September for the indoor (2.5 µg m-3) as well as outdoor (2.7 µg m-3) environments; both were observed in the SU-1. Similarly, for the NO2, the highest concentration was observed during January in both the indoor (13.9µg m-3) and outdoor air (15.1µg m-3) of the SU-1. During the study, the lowermost indoor air pollutant levels (5.0 µg m-3) occurred during February in the SU-3, while the lowermost outdoor pollutant levels (5.0 µg m-3) occurred in January and April in SU-3. The SU-1 is located along the road, while the school SU-3 is situated in a rural residential area. Dandotiya et al., (2019)31 observed that the adverse health consequences of air contaminants were lower in well-vegetated areas than in high-traffic metropolitan areas. It is noteworthy to mention here that the overall mean concentrations of the SO2 (4.9±1.5 µg m-3), as well as NO2 (9.2±3.0 µg m-3), were well below the prescribed limit recommended by NAAQS (SO2 – 50 µg m-3 annual and 80 µgm-3 24-hrs mean; NO2 – 40 µg m-3 annual and 80 µgm-3 24-hrs)19 and the WHO32(40 µg m-324-hrs mean for SO2, and 25µg m-324-hrs mean for NO2). Salonen et al.(2019)21 reported that the concentrations of NO2 in the school and the office were well below the WHO-recommended concentrations.
I-O relationship
The indoor and outdoor relationship of the two gases was deduced with the help of linear regression (Figure 2). The mean I/O ratio was well below one for both the SO2 (0.89±0.07) and NO2 (0.90±0.09). Analysis of the classroom and campus air contaminations of the two gases exhibit a positive correlation, SO2 (r= 0.96), and NO2 (r= 0.96), and was significant (p < 0.001), showing that outdoor air pollutant sources influenced the air quality in the classrooms. The concentrations of NO2 in the outdoors may be considered a reliable predictor of indoor NO2 levels.21 Majd et al.(2019)33 opined that pollutants significantly contributing to indoor exposure were mainly related to outdoor sources, indicating a strong correlation between indoor concentrations with outdoor sources.
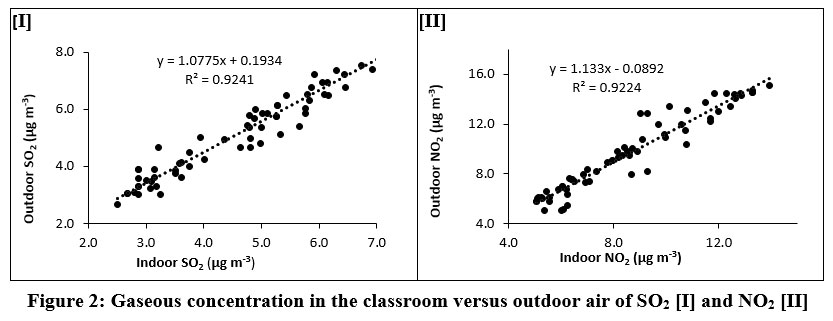 | Figure 2: Gaseous concentration in the classroom versus outdoor air of SO2 [I] and NO2 [II].
|
Conclusion
In modern times, proper monitoring of air quality in schools has become highly necessary due to a host of multiple underlying factors. Some of the pertinent reasons compelling air quality analysis in schools are the ever-increasing traffic volume near schools, mushrooming of schools near the roadside, children’s sensitivity to air contaminants, the time children spend in the schools, the crowded working space in classrooms, etc. The current study investigated the status of air quality in the schools in the suburban area of Imphal city with respect to the content of SO2 and NO2. The peak SO2 (7.7 µg m-3), as well as NO2 (13.9 µg m-3) in classroom air, were observed in a school (SU-2) located very close to a heavy-traffic road. In contrast, the lowest concentration of the two gases in the classroom was observed in a school (SU-3) in a suburban residential area. Air pollutants released from transportation remain the primary cause of air contamination in the city and its surrounding suburban areas. Season-wise, the classrooms’ highest concentrations of SO2 and NO2 were observed in winter, while the lowest concentrations of the gases were observed during the rainy season. The higher concentrations of gaseous pollutants in the schools during winter might be due to decreased humidity and the prevailing atmospheric conditions. The levels of gaseous pollutants in the campus and classrooms of the schools were found to be positively correlated. The I/O ratio indicated that the outdoor polluting sources of the two gases influenced indoor air concentrations. However, the levels of the two gaseous pollutants observed during the current study were within the safe concentration range recommended by the WHO and NAAQs Standards.
Acknowledgement
The first author is thankful to the Manipur university authority for providing the University Research Fellowship.
Conflict of Interest
The authors do not have any conflict of interest.
Funding Sources
There is no funding sources.
References
- Min J, Euijune K, Youngjin W. The Relationship between Economic Growth and Air Pollution—A Regional Comparison between China and South Korea.Int. J. Environ. Res. Public Health. 2020; 17(8): 2761; https://doi.org/10.3390/ijerph17082761
CrossRef - United Nations Environment Programme (UNEP). Air pollution hurts the poorest most. 2019; Available from: https://www.unep.org/news-and-stories/story/air-pollution-hurts-poorest most#:~:text=From%20Lagos%20and%20Lahore%20to,and%20air%20quality%20is%20better. (Accessed on 15th April 2022).
- Hakkim H, Kumar A,Sinha B, SinhaV. Air pollution scenario analyses of fleet replacement strategies to accomplish reductions in criteria air pollutants and 74 VOCs over India.Atmospheric Environment: X. 2022;13:100150.https://doi.org/10.1016/j.aeaoa.2022.100150
CrossRef - Kebede L, Tulu G.S, Lisinge R.T. Diesel-fueled public transport vehicles and air pollution in Addis Ababa, Ethiopia: Effects of vehicle size, age and kilometers travelled.Atmospheric Environment: X. 2022; 13: 100144. https://doi.org/10.1016/j.aeaoa.2021.100144
CrossRef - Nagendra R, Debbarma S, Phuleria H.C. Development of real-world emission factors for on-road vehicles from motorway tunnel measurements.Atmospheric Environment: X. 2021; 10: 100113. https://doi.org/10.1016/j.aeaoa.2021.100113
CrossRef - Liang Ze, Wei F, Wang Y, Huang J, Jiang H, Sun F, Li S. The Context-Dependent Effect of Urban Form on Air Pollution: A Panel Data Analysis. Remote Sens. 2020; 12: 1793.https://doi.org/10.3390/rs12111793
CrossRef - US Environmental Protection Agency (USEPA). Indoor Air Pollution and Health. 2021; Available from: https://www.epa.gov/indoor-air-quality-iaq/introduction-indoor-air-quality (Accessed on 10th April 2022).
- US Environmental Protection Agency (USEPA). Reference Guide for Indoor Air Quality in Schools. 2021; Available from: https://www.epa.gov/iaq-schools/reference-guide-indoor-air-quality-schools https://www.epa.gov/iaq-schools/reference-guide-indoor-air-quality-schools(Accessed on 3rdJune 2022)
- World Economic Forum.How clean air in schools improves children’s health and learning ability.2021; Available from:https://www.weforum.org/agenda/2021/11/how-clean-air-schools-improves-childrens-health-and-learning?utm_source=facebook&utm_medium=social_scheduler&utm_term=Education%2C%20Skills% 20and%20Learning&utm_content=02 %2F11%2F2021%2022%3A00&fbclid=IwAR3h4Vz1I7WHLGTX35NlT1QcG-x1lsIYQ7N9oRsMN5YoXfwu74ha9CAYUG8(Accessed on 22nd April 2022).
- Pulimeno M, Piscitelli P, Colazzo S, Colao A, Miani A. Indoor air quality at school and students’ performance: Recommendations of the UNESCO Chair on Health Education and Sustainable Development & the Italian Society of Environmental Medicine (SIMA). Health promotion perspectives. 2020; 10(3): 169–174.https://doi.org/10.34172/hpp.2020.29
CrossRef - Salvi S.S, Kumar A, Puri H, Bishnoi S, Asaf B.B, Ghorpade D, Madas S, Agrawal A, Kumar A. Association between air pollution, body mass index, respiratory symptoms, and asthma among adolescent school children living in Delhi, India.Lung India. 2021; (5): 408-415 doi: 10.4103/lungindia.lungindia_955_20.
CrossRef - United Nations Economic commission for Europe (UNECE). Air pollution and health.2020; https://unece.org/air-pollution-and-health(Accessed on 12th April 2022).
- Yaseen S, Skinder B. M, Ahmad S. Khoiyangbam R.S. Temporal variation of SO2 and NO2 concentrations around Parichha Thermal Power Plant, India. J. of Environmental Chemistry and Ecotoxicology 2014; 6(2): 6-12. https://academicjournals.org/journal/JECE/article-full-text-pdf/6DC19EF44504 (Accessed on 25 November 2022).
- Dandotiya B, Jadon N, Sharma H K. Effects of Meteorological Parameters on Gaseous Air Pollutant Concentrations in Urban Area of Gwalior City, India. Environmental Claims Journal. 2018;1–12. https://doi.org/10.1080/10406026.2018.1507508.
CrossRef - Zaraab M, Boersma K.F, Eskes H, Gonc H.D, JordiVilà-Guerau de Arellano J.V.G, Swaluw E, Schuchd W, Veldersde G.J.M. Reductions in nitrogen oxides over the Netherlands between 2005 and 2018 observed from space and on the ground: Decreasing emissions and increasing O3 indicate changing NOx chemistry.Atmospheric Environment: X. 2021; 9:100104https://doi.org/10.1016/j.aeaoa.2021.100104
CrossRef - World Health Organization (WHO). More than 90% of the world’s children breathe toxic air every day. 2018; Available fromhttps://www.who.int/news/item/29-10-2018-more-than-90-of-the-worlds-children-breathe-toxic-air-every-day#:~:text=Air%20pollution%20also%20impacts%20neurodevelopment,cardiovascular%20disease%20later%20in%20life. (Accessed on 25th March 2022)
- Khoiyangbam R.S. Air quality in schools located along the national highway in Jhansi city. Recent Research in Science and Technology. 2010; 2(4): 63-68.Available from: https://updatepublishing.com/journal/index.php/rrst/article/download/413/399(Accessed on 13th August 2022)
- Khumukcham R.K, Khoiyangbam R.S. Distribution of Gaseous pollutants SO2 and NO2, in the urban roadside schools in Imphal City. Journal of Biodiversity and Environmental Sciences. 2021; 19(3):17-22.Available from: https://innspub.net/jbes/distribution-of-gaseous-pollutants-so2-and-no2-in-the-urban-roadside-schools-in-imphal-city/(Accessed on 13th August 2022)
- Central Pollution Control Board. CPCB Guidelines for the Measurement of Ambient Air Pollutants VolumeI. 2009; Available from https://cpcb.nic.in/openpdffile.php?id=UmVwb3J0RmlsZXMvMjdfMTQ1ODExMDQyNl9OZXdJdGVtXzE5Nl9OQUFRTVNfVm9sdW1lLUkucGRm(Accessed on 27th March 2022)
- Dambajamts E.U, Seiji K, Masayuki S, Takaki S, Mari M, Yoshiko Y, Saijaa N, Toshimasa N. Coal burning-derived SO2 and traffic-derived NO2 are associated with persistent cough and current wheezing symptoms among schoolchildren in Ulaanbaatar, Mongolia. Environmental Health and Preventive Medicine. 2019. 24(1): 66–. https://doi.org/10.1186/s12199-019-0817-5
CrossRef - Salonen H, Salthammer T, Morawska L. Human exposure to NO2 in school and office indoor environments.Environment International. 2019; 130: 104887. https://doi.org/10.1016/j.envint.2019.05.081https://doi.org/10.3390/s19040905
CrossRef - Guttikunda S.K, Goel R, Pant P. Nature of air pollution, emission sources and management in the Indian cities. Atmospheric environment 2014; 95: 501-510. https://doi.org/10.1016/j.atmosenv.2014.07.006
CrossRef - Khan M.A.H, Rao M.V, Li, Q. Recent Advances in Electrochemical Sensors for Detecting Toxic Gases: NO2, SO2 and H2S.Sensors. 2019; 19: 905.https://doi.org/10.3390/s19040905
CrossRef - Dedoussi I.C, Eastham S.D, Monier E, Barrett S.R.H. Premature mortality related to United States cross-state air pollution.Nature. 2020; 578: 261–265. https://doi.org/10.1038/s41586-020-1983-8
CrossRef - Hu M, Wang Y, Wang S, Jiao M, Huang G, Xia B. Spatial-temporal heterogeneity of air pollution and its relationship with meteorological factors in the Pearl River Delta, China.Atmos. Environ. 2021; 254:118415. https://doi.org/10.1016/j.atmosenv.2021.118415
CrossRef - Pandey J. S, Kumar R, Devotta S. Health risks of NO2, SPM and SO2 in Delhi (India). Atmospheric Environment. 2005; 39(36): 6868–6874. https://doi.org/10.1016/j.atmosenv.2005.08.004
CrossRef - Mukta T, Hoque M, Sarker M, Hossain M, Biswas G. Seasonal variations of gaseous air pollutants (SO2, NO2, O3, CO) and particulates (PM2.5, PM10) in Gazipur: an industrial city in Bangladesh. Advances in Environmental Technology. 2020; 6(4): 195-209. https://dx.doi.org/10.22104/aet.2021.4890.1320
- Bodor Z, Bodor K, Keresztesi Ã.G, Szép, R. Major air pollutants seasonal variation analysis and long-range transport of PM10 in an urban environment with specific climate condition in Transylvania (Romania).Environmental Science and Pollution Research. 2020;27: 38181–38199 https://doi.org/10.1007/s11356-020-09838-2
CrossRef - Chutia L, Ojha N, Girach I.A, Pathak B, Sahu L.K, Bhuyan P.K. Seasonal Evolution of Sulfur Dioxide Over the Indian Subcontinent.URSI Radio Science Letters, 2020; 2:https://doi.org/10.46620/20-0046.
CrossRef - Lin, C.A, Chen Y.C, Liu C.Y, Chen, W.T, Seinfeld J. H, Chou, C.C.K. Satellite-Derived Correlation of SO2, NO2, and Aerosol Optical Depth with Meteorological Conditions over East Asia from 2005 to 2015.Remote Sensing. 2019; 11(15): 1738–. https://doi.org/10.3390/rs11151738
CrossRef - Dandotiya B, Sharma H. K, and Jadon N. Role of urban vegetation in particulate pollution control in urban areas of Gwalior City with special reference to SPM. Advances in Bioresearch . 2019; 10 (1):97–103. https://www.researchgate.net/profile/Banwari-Dandotiya/publication/335973127_Role_of_Urban_Vegetation_in_Particulate_ Pollution_Control_in_Urban_Areas_ of_Gwalior_City_with_Special_Reference_to_SPM/links/5d87a736299bf1996f933e36/ Role-of-Urban-Vegetation-in-Particulate-Pollution-Control-in-Urban-Areas-of-Gwalior-City-with-Special-Reference-to-SPM.pdf. (Accessed on 23th November 2022)
- World Health Organization. WHO global air quality guidelines: particulate matter (?PM2.5 and PM10)?, ozone, nitrogen dioxide, sulfur dioxide and carbon monoxide. World Health Organization. ?2021; Available from https://apps.who.int/iris/handle/10665/345329.(Accessed on 16th May 2022)
- Majd E, McCormack M, Davis M, Curriero F, Berman J, Connolly F, Leaf P, Rule A, Green T, Clemons E.D, Gummerson C, Koehler K. Indoor air quality in inner-city schools and its associations with building characteristics and environmental factors. Environmental research. 2019; 170: 83–91. https://doi.org/10.1016/j.envres.2018.12.012
CrossRef


