Land Use/ Cover Change Detection in High-Altitude Mountain Landscapes: A Case of Pangi Valley, Western Himalaya (India).
Suresh Chand
*
 , Karanjot Kaur Brar
and Ashish Kumar
, Karanjot Kaur Brar
and Ashish Kumar
1
Department of Geography,
Panjab University,
Chandigarh,
India
http://dx.doi.org/10.12944/CWE.17.3.21
Copy the following to cite this article:
Chand S, Brar K. K, Kumar A. Land Use/ Cover Change Detection in High-Altitude Mountain Landscapes: A Case of Pangi Valley, Western Himalaya (India). Curr World Environ 2022;17(3). DOI:http://dx.doi.org/10.12944/CWE.17.3.21
Copy the following to cite this URL:
Chand S, Brar K. K, Kumar A. Land Use/ Cover Change Detection in High-Altitude Mountain Landscapes: A Case of Pangi Valley, Western Himalaya (India). Curr World Environ 2022;17(3).
Download article (pdf)
Citation Manager
Publish History

Introduction
Mountains can be considered a fragile ecosystem that provides a variety of essential global commodities and services. These ecosystems are widely threatened by globalization and the increasing pressure over the territory, besides to climate change, which is affecting the mountain ecosystems as well as livelihoods of the concerned population.1,2 The market driven globalization focusing on the exploitation of natural resources which seems incompatible with local diversity, fragility, inaccessibility, and marginality of these regions.3 In the recent decades, human found to be the most important factor in transforming the mountain ecosystems,4 the period, that is termed as the era of ‘anthropocene’.5 The human response to environmental processes at varying temporal and spatial extent has led to the emergence of the perspective of ‘human-nature interaction’ focusing on the function of human in shaping the earth.6 The principal human-induced activities threatening the high mountain ecosystems due to its complex topography combined with climatic and biological diversity are; unplanned land use, farming on steep slopes, overgrazing, overexploitation of community forests, and urbanization.7
The determinants of global change such as land use and climate change are affecting the high mountain areas despite their remoteness and low population density.8,9 Anthropogenic actions are rapidly changing the terrestrial environment and causing changes in land use and cover, which contribute to global environmental change.10 Global warming leading to an upward shift in LULC types towards higher altitudes, causing a shift in the timber line and the loss of alpine pastures and glaciers thus making the physical landscape of alpine regions vulnerable.11,12 The land use of a particular region exhibits the interaction between physical and economic elements influenced by various landscape characteristics.13 High altitude landscapes hold steep meteorological and topographical gradients, which pose a significant obstruction for ecological research.14 Whereas, recent advancement in geospatial techniques has enable geographers to uncover spatio-temporal variability of even remote highlands.15 Remote sensing combined with Geographic Information Systems (GIS) allows analyzing and monitoring diverse natural resources, as well as identifying and forecasting changes over different time and space.16 One of the broadly used GIS based analysis for land monitoring is LULC changes helping to identify the spatial patterns of landscape as well as the underlying processes functioning in the area.17 In the history of remote sensing, a variety of change detection techniques have been employed to identify changes at the earth's surface.18 For image classification of such uneven high-altitude locations, MLC, a popular supervised classification algorithm, is the best approach.19 Thus, the monitoring and mapping of LULC and its effects is important for sustainable natural resource planning and management.20,21
The recent studies in the Western Himalayan region have shown that in high altitude regions, the vulnerability to natural hazards is closely associated to the human interventions, particularly the change in LULC.22,23 In recent decades, a rapid growth of local roads and infrastructure construction led to increased hazards and further putting pressure on the land use pattern of the Pangi valley.24 However, there is a lack of work done on the remote areas of Western Himalayan region using GIS techniques such as Pangi Valley. Thus, the present work makes it possible to assess the land dynamics of the region with the help of advanced geospatial techniques. The objectives of the study is to represent the temporal patterns of LULC for the year 1992, and 2021 and to assess the transformation in LULC between 1992 to 2021, in the Pangi tehsil of Chamba district, Himachal Pradesh, India. The outcome of the present work will be helpful for the policy-making agencies in future sustainable landscape planning and management strategies. These results must be understood considering the particular context of the study area, where some factors can be particular. The results and recommendations can be extrapolated across multiple scales once we understand the impact of these particular factors.25
Material and Methods
Study Area
The Pangi tehsil is situated in the extreme north-western part of the Chamba district as well as the state of Himachal Pradesh, India (Fig.1). It is squeezed between two subsystems of the Himalaya, the Zanskar and Pir-Panjal range. It contains 16 panchayats, 106 revenue villages out of which 60 villages are inhabited. It supports about 18868 persons (Indian Population Census, 2011) with an area of roughly 1,520 km2. The altitude varies from 1,975-6,400 meters and the mean elevation of the peaks is 5,181 meter. The location of settlements or inhabited area found only upto 3,600 meter. The whole valley drained by the Chenab River and its glacial/snow fed perennial tributaries. The climate of the valley is semi-arid and the agro-climatic conditions ranging from cold to dry zone. It is characterized by cool summers with less rainfall from summer-monsoon and mostly receives precipitation in the form of snow in harsh winters. In winters from four to five months, passes blocked due to snowfall, which keeps the peoples of the valley, confined to their houses as a result less intercommunication with the outside world.
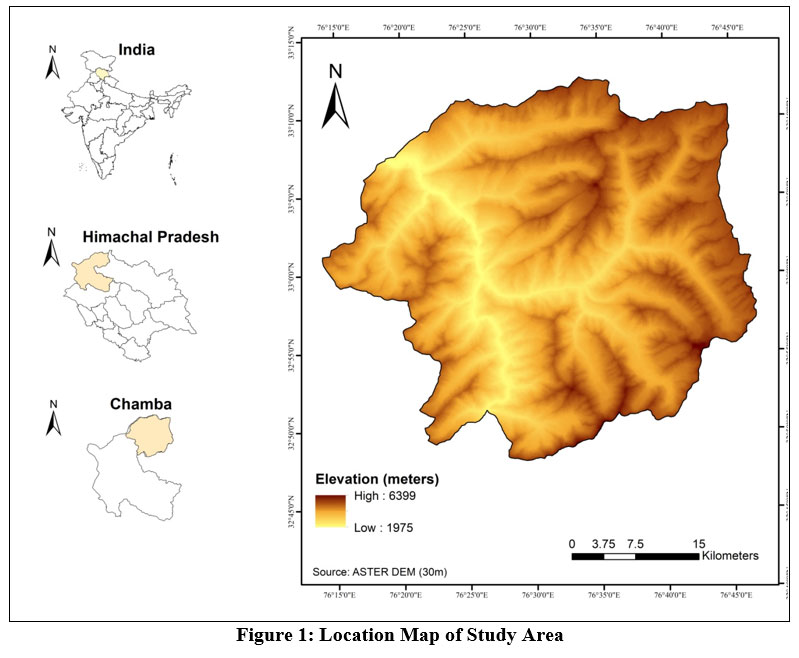 | Figure 1: Location Map of Study Area
|
Data Sources and Methodology
The present study has used both secondary as well as primary sources of data collection. The primary sources includes, field surveying and imagery collection. In secondary sources, the land use/cover change has been analyzed using multi-temporal satellite imageries of LANDSAT extracted from United States Geological Survey (USGS) including LANDSAT-5 TM and LANDSAT-8 OLI/TIRS (Table 1) for the period of 1992 and 2021 respectively. The spatial resolution of visible bands for both images are 30 meter while the spatial resolution of panchromatic band for the image of 2021 is 15 meters which is used to sharpen the image to get a more detailed perspective. The satellite images have been selected for the second and fourth week of October because, during this period, the area remains cloud-free and the snow cover tends to be least except in the locations of perpetual snow cover. In addition to the satellite images, some secondary data has been also collected from the Topographical Sheets (1:50000) and a Digital Elevation Model (DEM) of the region. The topographical sheets act as the geographical reference system or base. The DEM has been used to eliminate the areas above 3,600 meters from the MSL to avoid the misclassification of agricultural land and built-up area. Table 1 shows a brief description about the datasets of multi-temporal satellite imageries.
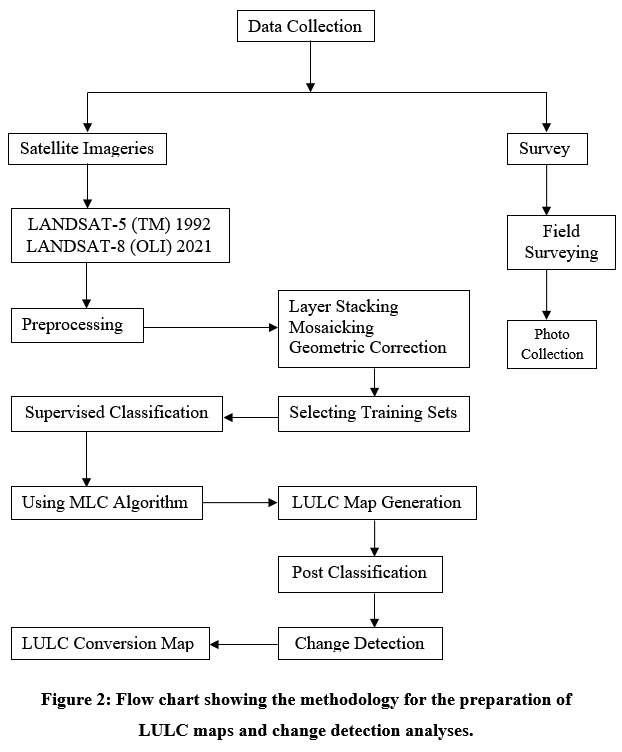 | Figure 2: Flow chart showing the methodology for the preparation of LULC maps and change detection analyses.
|
Table 1: Satellite Imagery Dataset.
| Sr. No. | Data Type | Sensor | Path/Row | Source | Date of Acquisition | Spatial Resolution |
| 1 | LANDSAT 5 | TM | 148/37 | Earth Explorer (USGS) | 24/10/1992 | 30 M |
| 4 | LANDSAT 8 | OLI/TIRS | 148/37 | Earth Explorer (USGS) | 08/10/2021 | 30 M |
Source: USGS
In order to analyze the land use/cover pattern and change, the satellite images has been processed in ERDAS Imagine 2014 (Fig. 2). A total of seven classes of LULC were delineated i.e. agriculture/horticulture land, built-up land, barren land, forest cover, pasture land, water bodies, and snow cover. Each class was given training samples for different images with the help of existing satellite images and Google Earth Pro. The satellite images were classified by applying Maximum Likelihood Classification (MLC) algorithm, which is one of the commonly used image classification method. After classification process, the images were compared and processed for post classification. In post classification process, change detection technique was applied to show the conversion within LULC classes. The change detection required similarity of pixels in all the satellite images. For this, the satellite image of 2021 (15 meters) was resampled to 30 meters resolution using closest neighbor algorithm for the comparison. Finally, the LULC transformation matrix was prepared to show the distribution and scale of change in several categories.
Analysis and Discussions
After independence, the process of development in tribal regions got its momentum during the fifth five-year plan (1974-79) when the concept of tribal sub-plan introduced and Pangi and Bharmaur tehsils of Chamba district were come under Integrated Tribal Development Projects (ITDP). The main objective of this sub-plan was to strengthening the process of socio-economic development and to improve the quality of life of the concerned population.26 Negi B.S. (2011) discussed that since the implementation of MNREGS in 2005, a rapid growth of local roads and tracts has witnessed in the Pangi valley, which results in landslide and further putting pressure on the land use/cover pattern.24 As a result, these roads promoted cash crops, horticulture development further cause a great inflow of tourists and migrant laborers in the valley. These developmental factors have led to a noticeable change in the land use/cover pattern in the study area, as found in the similar studies in adjacent western Himalayan region. Singh R.B. (1998) has shown that unparalleled population growth and developmental activities are putting pressure on the fragile and natural hazard prone landscapes of the Western Himalayan region.27 Oinam et al. (2005) has predicted that the increase in developmental and constructional activities impacting adversely on the physical landscape in the cold desert region of Lahaul valley.28 Chandel et al. (2013) discussed that changing human-environmental and socio-economic dynamics have not only harmed the natural environment but also enhanced people’s vulnerability to natural disasters in upper Beas basin.29 Negi et al. (2022) revealed that forest margins and pastures adjacent to villages have shrunk, and found decline in barren land which shows active encroachment over natural cover in the upper Beas valley.30 Therefore, the present study is an attempt to observe such land use/cover changes in the study area with the help of remote sensing technology and Geographic Information System. The remotely sensed analysis has shown the spatial distribution of LULC pattern for the period 1992-2021. The satellite images for 1992 and 2021 are classified into seven categories (Fig. 3) and their statistics are listed in Table 2.
LULC Pattern during 1992
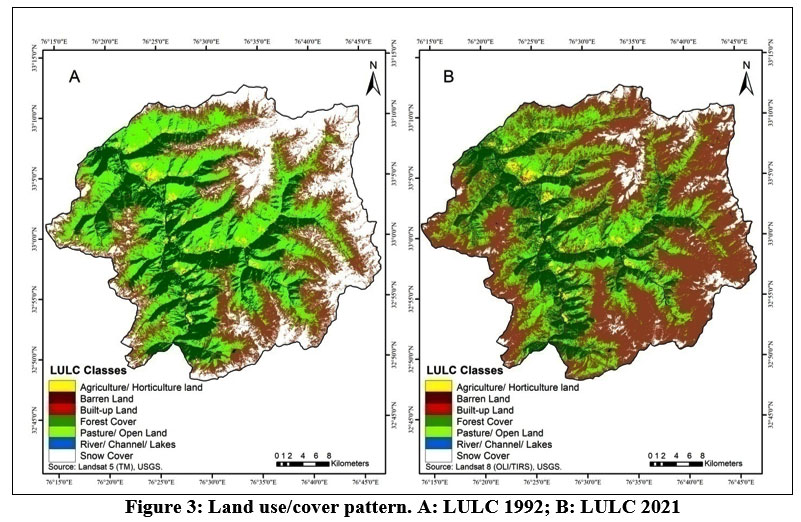
In the year 1992, the majority of the area of Pangi valley was under pastureland, which constitutes 30.7 per cent (467.9 km2) of the total area (Table 2 and Fig 3a). The area under barren/rocky surface and snow cover comprises of about 25.7 per cent (392.1 km2) and 22.1 per cent (335.4 km2) respectively. The permanent snow cover occupies the entire northern and eastern border of Pangi Tehsil and shown extended downward near to the habitation in every sub-valley of the region. The barren surface showing majority of its dominance just below the permanent snow cover in the whole region. The area under forest cover was 19.2 per cent (292.4 km2) of the total area exhibits linear pattern along every windward slope or sun shadow portions of the valley with densely vegetative covered. Agriculture/horticulture land, water bodies, and built-up land covered an area of 1.5 per cent (23.8 km2), 0.4 per cent (6.4 km2), and 0.1 per cent (2.1 km2) respectively. The settlements of the study area follows linear pattern in the left bank of Chenab along mountain spurs and alluvial fans of tributary streams due to less area available for habitation because Sach pass makes uplands more steep sloping. On the other hand, the area along the right bank of the Chenab follows cluster settlement pattern, because this settlement pattern prevent the houses from snow storms, except Shour and Purthi village, that follows linear pattern because these villages are located in dense forest area along the Chenab. The agricultural land of the study area exhibits southern sloping pattern with terraced farming. The LULC statistics during 1992 shows less anthropogenic intervention on the study area, as a greater number of natural categories dominated the area.
Table 2: Land use/cover change (1992-2021)
Sr. No. | Land Use/Cover Categories | 1992 | 2021 | LULC Change (1992-2021) | |||
| Area | Area | Area | |||||
| (km2) | (per cent) | (km2) | (per cent) | (km2) | (per cent) | ||
| 1 | Agriculture/Horticulture Land | 23.81 | 1.57 | 26.96 | 1.77 | 3.15 | 13.23 |
| 2 | Barren Land | 392.15 | 25.79 | 774.56 | 50.95 | 382.41 | 97.52 |
| 3 | Built-up Land | 2.09 | 0.14 | 4.13 | 0.27 | 2.05 | 98.56 |
| 4 | Forest Cover | 292.46 | 19.24 | 231.12 | 15.20 | -61.34 | -20.97 |
| 5 | Pasture Land | 467.96 | 30.78 | 369.2 | 24.28 | -98.76 | -21.10 |
| 6 | River/Streams | 6.42 | 0.42 | 7.35 | 0.48 | 0.93 | 14.49 |
| 7 | Snow Cover | 335.48 | 22.07 | 107.05 | 7.04 | -228.43 | -68.09 |
| Total: | 1520.37 | 100.00 | 1520.37 | 100.00 | |||
Source: Landsat 5 (TM), Landsat 8 (OLI/TIRS), USGS.
LULC Pattern during 2021
The majority of the area in 2021 was under barren/rocky surface comprises 50.9 per cent (774.5 km2) of the total area (Table 2 and Fig. 3b). The expansion occurred in the areas previously occupied by permanent snow cover and along the pasturelands of every sub-valley due to constructional activities. The total area under snow cover was 7.1 per cent (107.1 km2) showing a decreasing trend mostly in the uppermost northeastern parts of the valley. The statistics also reveal that the area under pastureland and forest cover was 24.2 per cent (369.2 km2) and 15.2 per cent (231.1 km2) respectively, which also showing a decreasing trend in the form of fragmented pasturelands and forests further replaced by barren surfaces. Although, the classes of agriculture/horticulture land, water bodies and built-up land, comprising 1.7 per cent (26.9 km2), 0.4 per cent (7.3 km2) and 0.2 per cent (4.1 km2) area respectively showing an increasing trend. New settlements are following linear pattern along the newly constructed local roads upto higher altitudes in the valley. Agriculture land also spreads along the roads as well as towards pasturelands of high altitudes in the form of agriculture/orchards expansion in the valley.
LULC Change Analysis
The analysis of Table 2 shows that the snow cover has drastically reduced from 22.1 per cent (335.4 km2) in 1992 to 7.1 per cent (107.1 km2) in 2021 with a net decrease of 68.1 per cent
 | Figure 3: Land use/cover pattern. A: LULC 1992; B: LULC 2021
|
(228.4 km2). The reduction in the snow cover is the impact of global warming. The area under pastureland shows a substantial reduction from 30.7 per cent (467.9 km2) in 1992 to 24.2 per cent (369.2 km2) in 2021, with a net reduction of 21.1 per cent (98.7 km2). The decrease in pastureland is mainly occurred due to anthropogenic factors i.e. expansion of land for agriculture/horticulture activities and growth of local roads and infrastructure in the valley. The forest cover in the area shows a significant reduction from 19.2 per cent (292.4 km2) in 1992 to 15.2 per cent (231.1 km2) in 2021 with a net decrease of 20.9 per cent (61.3 km2). The decrease in forest cover is the effect of deforestation for developmental activities as well as for household fuel/timber wood requirements. Also shows an altitudinal shift of agriculture/horticulture land owing to road connectivity in the study area.
The analysis illustrates that the area under barren/rocky surface shows a drastic change from 25.7 per cent (392.1 km2) in 1992 to 50.9 per cent (774.5 km2) in 2021, with a net increase of 97.5 per cent (382.4 km2). This huge change has mainly occurred due to the shrinking of snow cover, road construction and increasing landslides/avalanches in the valley. The agricultural land shows a slight increase from 1.5 per cent (23.8 km2) in 1992 to 1.7 per cent (26.9 km2) in 2021 with a net increase of 13.2 per cent (3.1 km2). This addition is attributed to the encroachment of adjacent land for cultivation and agricultural land expansion along the newly constructed local roads upto high altitudes in the valley. The water spread area such as rivers, streams and lakes has also witnessed a slight increase in the area from 0.42 per cent (6.4 km2) in 1992 to 0.48 per cent (7.3 km2) in 2021 with a net addition of 14.4 per cent (0.9 km2). This addition occurred mainly due to the occurrences of Glacial Lake Outburst Floods (GLOFs) which has resulted in the broadening of drainage basin in the right bank tributaries of the Chenab in the Great Himalayan Range (Plate 1) and formation of new lakes due to global warming in the areas previously occupied by perpetual snow. The study also reveals that the built-up area has broadened from 0.1 per cent (2.1 km2) in 1992 to 0.2 per cent (4.13 km2) in 2021, with a net addition of 98.5 per cent (2.1 km2). This addition is mainly attributed to the growth of population during the study period as well as the process of urbanization along the newly constructed roads and tracts in the valley.
LULC Transformation Analysis
The LULC transformation matrix from 1992 to 2021 shown in Table 3 and Fig. 4 represents the spatial transformation of one LULC class into another. Interpretation from LULC change detection matrix reveals significant land cover changes in Pangi valley for the study period. Result illustrates that about 217.8 km2 of area with the highest conversion recorded from snow cover to barren/rocky surface. This conversion attributed to the frequent decline of snow cover in the uppermost areas of northeastern parts of the Pangi valley resulted in extended barren surface or moraines. Earlier these areas were either snow covered or the barren surface below the snow cover. Another massive conversion of 175.3 km2 detected from pastureland into barren land. This is mainly occurred due to the development of local roads (Plate 2) and infrastructure construction as well as increased hazards i.e. landslides and avalanches etc in the valley. About 53.1 km2 of the forest cover converted into pastureland. This conversion is occurred due to the deforestation activities in order to meet the fuel/timber wood requirements of increasing population and for developmental activities as well. About 47.8 km2 of barren land converted into pastureland. This conversion is mainly attributed to the conversion of the side slopes of moraines into grasslands due to global warming (Plate 3) and decreased grazing activities. This decreased grazing is the result of the fact that in earlier times, shepherds who came from adjoining Churah and Bharmaur Tehsils were restricted for cattle grazing along the right bank of Chenab River who were earlier, allowed to graze in the whole Pangi region.
Table 3: Land use/cover transformation matrix (1992-2021)
| Land Use/Cover Transformation Matrix | |||||||||
| Classes | Forest | Pasture | Barren | Snow | River | Agriculture | Built-up | Total Loss | LULC 1992 |
| Forest | 191.29 | 53.02 | 47.35 | 0.002 | 0.01 | 0.67 | 0.12 | 101.17 | 292.46 |
| Pasture | 31.45 | 253.37 | 175.37 | 0.07 | 2.08 | 4.95 | 0.67 | 214.59 | 467.96 |
| Barren | 6.76 | 47.81 | 332.80 | 4.41 | 0.31 | 0.05 | 0.005 | 59.35 | 392.15 |
| Snow | 0.58 | 14.05 | 217.81 | 102.56 | 0.48 | 0.00 | 0.00 | 232.92 | 335.48 |
| River | 0.78 | 0.27 | 0.90 | 0.005 | 4.45 | 0.01 | 0.001 | 1.97 | 6.42 |
| Agriculture | 0.23 | 0.64 | 0.31 | 0.00 | 0.02 | 21.04 | 1.57 | 2.77 | 23.81 |
| Built-up | 0.03 | 0.04 | 0.02 | 0.00 | 0.00 | 0.24 | 1.76 | 0.33 | 2.09 |
| Total Gain | 39.83 | 115.83 | 441.76 | 4.487 | 2.90 | 5.92 | 2.369 | ||
| LULC 2021 | 231.12 | 369.20 | 774.56 | 107.05 | 7.35 | 26.96 | 4.13 | 1520.37 | |
Source: Landsat 5 (TM), Landsat 8 (OLI/TIRS), USGS.
About 47.3 km2 of forest cover converted into barren land. This is mainly occurred due to the deforestation activities made by community during the study period and occurrence of GLOFs has also lead to deforestation in the upper reaches of major tributaries. Pastureland and barren land converted into forest cover by 31.4 km2 and 6.7 km2 respectively. This conversion is attributed to the plantation activities made by the Forest Department and the establishment of Saichu Wildlife Sanctuary as well. In spite of this upland settlements inhabited at higher elevation in alpine forest zone have developed their own committees (Praja System) for the conservation of only Bhoj-Patra (Betula Utilis) forests, also enhances agro-forestry in these areas. These communities have decided not to harvest any fuel wood or plant bark for household purposes because this tree grows very slowly. ‘Praja’ decide the duration of the bar on exploitation of any kind of major forest produce from the forest. About 14.1 km2 of snow cover converted into pastureland. This is mainly occurred due to the conversion of glaciers/ moraines into grassland due course of time (Plate 4), as an impact of climate change. About 4.4 km2 of barren land converted into snow cover. This conversion indicates climatic variability or the accumulation of snow/glaciers in the previously covered moraines or barren surfaces. About 2.1
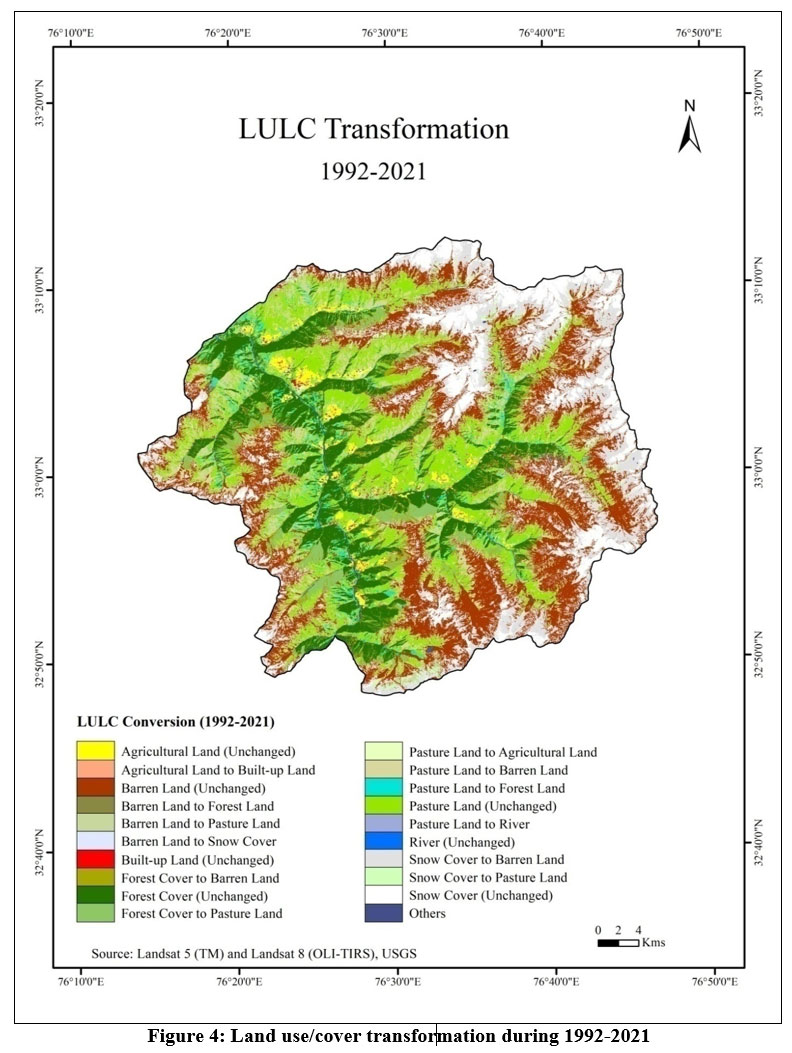 | Figure 4: Land use/cover transformation during 1992-2021.
|
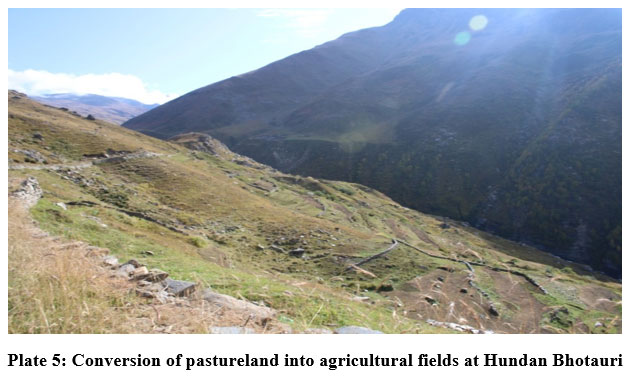
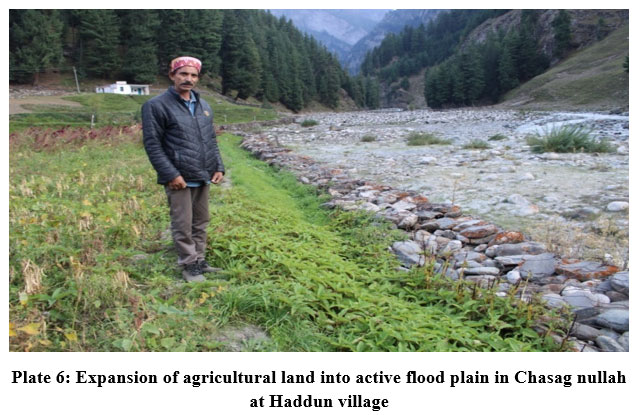
km2 area of pastureland converted into water bodies, this conversion directly indicates to flooding in the valley. About 0.4 km2 area of snow cover converted into water bodies. This is occurred due to the formation of new lakes caused by snow melting in the previously occupied perpetual snow cover locations. Pastureland and forest cover converted into agricultural land by 4.9 km2 and 0.6 km2 respectively. This conversion mainly occurred due to the encroachment of land for agriculture/horticulture activities (Plate 5). As a result, this conversion led to the development of horticulture and orchards expansion in the valley. About 1.5 km2 of agricultural land converted into built-up area due to increasing population and the process of urbanization. About 0.6 km2 area of pastureland converted into built-up area. This conversion occurred due to the expansion of settlements along the local roads in the valley. About 0.1 km2 area of water-bodies converted into agriculture land. This conversion is occurred mainly attributed to the expansion of agricultural fields into active flood plains (Plate 6).
Overall Net Gain and Loss
The transformation matrix also illustrates overall net gain and loss in different LULC classes from 1992-2021. Barren/rocky surface being a major land cover class in the valley shows a huge net gain of 441.7 km2 that indicates to the impact of global warming and rapid growth of developmental activities during the period, on the other hand receives a net loss of 59.3 km2 that indicates to the decreased grazing activities in upland meadows and natural growth of grasslands in the side slopes of moraines. The area under snow cover receives a net loss of 232.9 km2 that indicates to the shrinking of the permanent snow cover, on the other hand attained a net gain of 4.4 km2 that indicates to climatic variability during the period. The area under pastureland shows a net loss of 214.5 km2 that indicates to roads construction and associated hazards further causing a severe impact on the grassland ecology of the region, on the other hand receives a net gain of 115.8 km2 that indicates to the expansion of grasslands in uppermost parts nearby the previously occupied barren surface. The area under forest cover shows a huge loss of 101.1 km2 that indicates to deforestation activities made by community for household purposes and developmental activities, causing a threat to the biodiversity conservation in the valley, on the other hand receives a net gain of about 39.8 km2 which indicates to plantation made by both Forest Department and community. The area under river/streams/lakes shows a net gain of 2.9 km2 that indicates to broadening of drainage basin and formation of lakes caused by global warming during the period, on the other hand receives a net loss of 1.9 km2 that indicates to the decline in small glacial-fed distributaries.
The area under agriculture/horticulture land shows a net gain of 5.9 km2 which indicates to the growth of agricultural land along the newly constructed roads and encroachment of adjacent pastures and forests, on the other hand receives a net loss of about 2.7 km2 that indicates to the expansion of settlements along the local roads and the residential and commercial requirements of growing population during the period. The area under built-up land has also experienced a net gain of 2.3 km2 that indicates to the process of urbanization in few market centers as well as along the local roads in the valley, on the other hand receives a net loss of 0.3 km2 that indicates to the decline in transit houses situated at alpine meadows (gahars) and few houses situated in the Protected Forest areas.
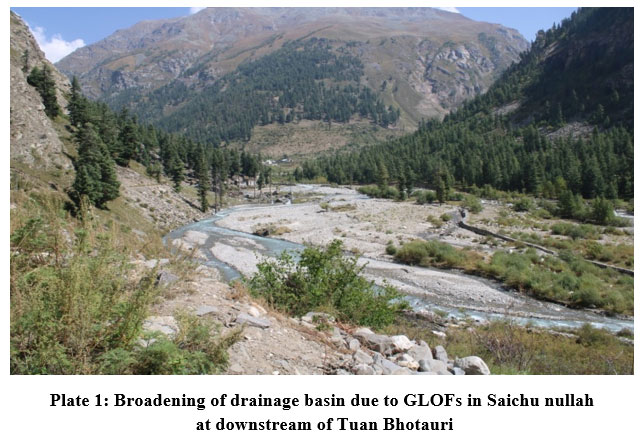 | Plate 1: Broadening of drainage basin due to GLOFs in Saichu nullah at downstream of Tuan Bhotauri.
|
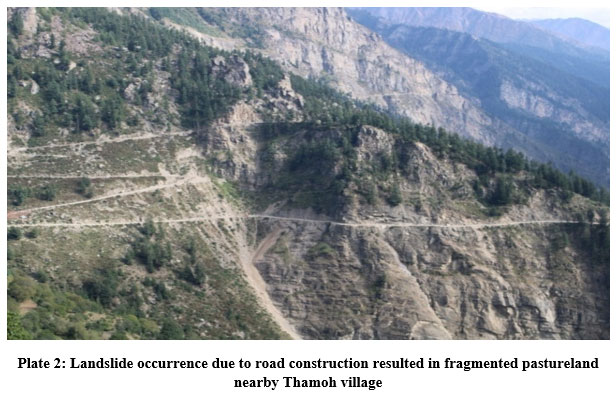 | Plate 2: Landslide occurrence due to road construction resulted in fragmented pastureland nearby Thamoh village
|
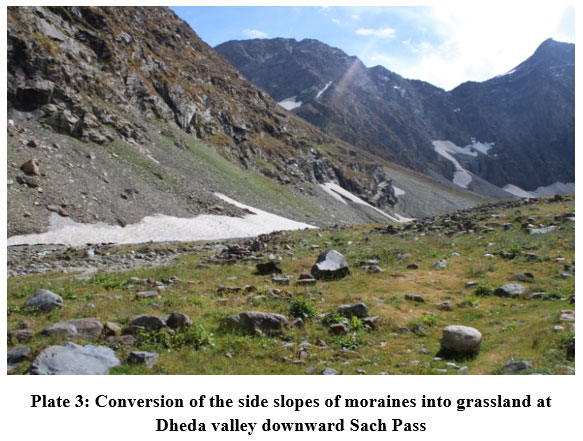 | Plate 3: Conversion of the side slopes of moraines into grassland at Dheda valley downward Sach Pass.
|
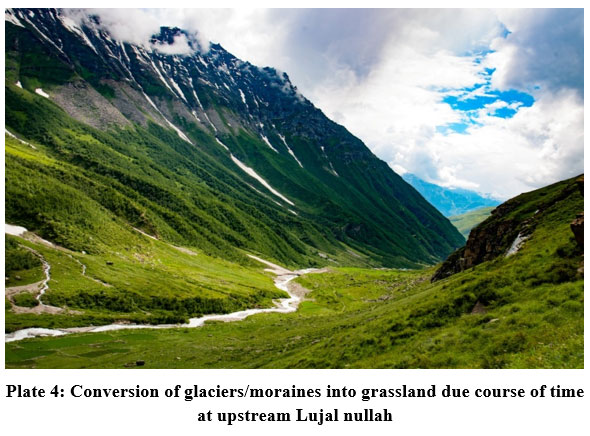 | Plate 4: Conversion of glaciers/moraines into grassland due course of time at upstream Lujal nullah
|
 | Plate 5: Conversion of pastureland into agricultural fields at Hundan Bhotauri.
|
 | Plate 6: Expansion of agricultural land into active flood plain in Chasag nullah at Haddun village.
|
Source: Field Survey, 2019
Conclusions
Along this study, we show how mountainous landscapes are going to widely threatened by tremendous anthropogenic pressure in this era of globalization and economic liberalization. The present study area has witnessed huge changing patterns of LULC especially after the implementation of MNREGS in 2005, in the form of developmental activities. We have demonstrated how barren/rocky surfaces were massively transformed during the study period. This transformation mainly attributed to shrinking of snow cover, which has enhanced the occurrences of GLOFs and pose a severe threat on biodiversity in the region. A rapid pace of roads and infrastructure construction is leading to fragmented forests and pastures further leading to mass wasting, landslides and avalanches in the valley. The decrease in pastures is putting pressure on the livelihood sustainability of highly livestock dependent tribal community. These changing patterns of LULC are distressing physical landscape as well as sustainable livelihood options of the Pangwal community. In spite of this, upland villages of alpine vegetation zone has developed their community councils for the conservation of Betula Utilis (Bhoj-Patra) forests, and enhanced agro-forestry showing a positive strategy to cope with the impact of climate change. Although, the infrastructural developments provides the ease of access but still, it is necessary for the policy makers and planners to have a sustainable development mechanism for the better planning, implementation and management of the projects in such fragile high-altitude landscapes.
Acknowledgement
The present work is supported by the research grant (UGC-JRF) from University Grant Commission with grant number F.15-9(June 2015)/2015(NET).
Conflict of Interest
The authors do not have any conflict of interest.
Funding Sources
The present work is supported by the research grant (UGC-JRF) from University Grant Commission with grant number F.15-9(June 2015)/2015(NET).
References
- Balsa-Barreiro J, Li Y, Morales A. Globalization and the Shifting Centers of Gravity of World's Human Dynamics: Implications for Sustainability. J. Clean. Prod. 2019; 239, 117923.
CrossRef - Maselli D. Promoting Sustainable Mountain Development at the Global Level. Mt Res Dev. 2011; 32(1): 64-70.
CrossRef - Jodha N. S. Globalization and Fragile Mountain Environments. Mt Res Dev. 2000; 20(4): 296-299.
CrossRef - Steffen W, Grinevald J, Crutzen P, Mcneill J. The Anthropocene: Conceptual and Historical Perspectives. Phil Trans R Soc A. 2011; 369(1938): 842-867.
CrossRef - Slaughter R. A. Welcome to the Anthropocene. Futures. 2011; 44(2): 119-126.
CrossRef - Kates R. W. The human environment: The Road Not Taken, the Road Still Beckoning. Ann Assoc Am Geogr. 1987; 77(4): 525-534.
CrossRef - Ahmad A. Environmental Impact Assessment in the Himalayas: An Ecosystem Approach. Ambio. 1993; 22(1): 4-9.
- Kohler T, Maselli D. (Eds.). Mountains and Climate Change: From Understanding to Action. Bern, Switzerland: Geographica Bernensia; 2009.
- Rodríguez D. R, Bomhard B. Mapping Direct Human Influence on the World's Mountain Areas. Mt Res Dev. 2012; 32(2): 197-202.
CrossRef - Turner B, Meyer, W. B, Skole D. L. Global Land-Use/Land-Cover Change: towards an Integrated Study. Ambio. 1994; 23(1): 91-95.
- Qi X. L, Xu H. J, Chen T, Shan S. Y, Chen S. Y. Effects of Climate Change, Coal Mining and Grazing on Vegetation Dynamics in the Mountain Permafrost Regions. Ecol. Inform. 2022; 69, 101684.
CrossRef - Tasser E, Leitinger G, Tappeiner U. Climate Change Versus Land-Use Change—What Affects the Mountain Landscapes More?. Land use policy. 2017; 60: 60-72.
CrossRef - Jalal D. S, Pant B. R, Joshi R. C. Environmental Study in Himalayan Region. New Delhi: Anmol Publishers; 2001.
- Loffler J, Finch O. Spatio-Temporal Gradients between High Mountain Ecosystems of Central Norway. Arct Antarc Alp Research. 2005; 37(4): 499-513.
CrossRef - Marston R. A. Land, Life, and Environmental Change in Mountains. Ann Assoc Am Geogr. 2008; 98(3): 507-520.
CrossRef - Munsi M, Malaviya S, Oinam G, Joshi P. K. A Landscape Approach for Quantifying Land-Use and Land-Cover Change (1976–2006) in Middle Himalaya. Reg Environ Change. 2010; 10(2): 145-155.
CrossRef - Twisa S, Buchroithner M. F. Land-Use and Land-Cover (LULC) Change Detection in Wami River Basin, Tanzania. Land. 2019; 8(9): 136.
CrossRef - Chughtai A. H, Abbasi H, Karas I. R. A Review on Change Detection Method and Accuracy Assessment for Land Use Land Cover. Remote Sens. Appl.: Soc. Environ. 2021; 22, 100482.
CrossRef - Diallo Y, Hu G, Wen X. Applications of Remote Sensing in Land Use/Land Cover Change Detection in Puer and Simao Counties, Yunnan Province. Am. J. Sci. 2009; 5(4): 157-166
- Mishra P. K, Rai A, Rai S. C. Land Use and Land Cover Change Detection Using Geospatial Techniques in the Sikkim Himalaya, India. Egypt J Remote Sens Space Sci. 2020; 23(2): 133-143.
CrossRef - Vivekananda G. N, Swathi R, Sujith A. V. L. N. Multi-Temporal Image Analysis for LULC Classification and Change Detection. Eur. J. Remote. Sens. 2021; 54(2): 189-199.
CrossRef - Chandel V. B. S, Brar K. K, Chauhan Y. RS & GIS Based Landslide Hazard Zonation of Mountainous Terrains a Study from Middle Himalayan Kullu District, Himachal Pradesh, India. Int J Geomat Geosci. 2011; 2(1): 538-551.
- Thakur N, Rishi M, Keesari T, Sharma D. A, Singh R. Assessment of Changes in Land Use and Land Cover Patterns Using RS and GIS: A Case Study of Upper Beas Basin of Kullu Valley in Western Himalayas. Anusandhan. 2018; VII (XIV): 1-10.
- Negi B. S. Impact of Developmental Activities on Tribal Area of Himachal Pradesh: A Case Study of Pangi Block. Himachal Pradesh Univ J. 2011; 1: 102-110.
- Balsa-Barreiro J, Menendez M, Morales A. J. Scale, Context, and Heterogeneity: the Complexity of the Social Space. Sci. Rep. 2022; 12(1): 1-12.
CrossRef - Hasnain N. Tribal India. 6th ed. New Delhi: Palaka Prakashan; 2001.
- Singh R. B. Land Use/Cover Changes, Extreme Events and Ecohydrological Responses in the Himalayan Region. Hydrol Process. 1998; 12(13?14): 2043-2055.
CrossRef - Oinam S. S, Rawat Y. S, Khoiyangbam R. S, Gajananda K. H. W. A. I. R. A. K. P. A. M, Kuniyal J. C, Vishvakarma S. C. R. Land Use and Land Cover Changes in Jahlma Watershed of the Lahaul Valley, Cold Desert Region of the Northwestern Himalaya, India. J. Mt. Sci. 2005; 2(2): 129-136
CrossRef - Chandel V. B. S, Brar K. K, Kahlon S. Land Use/Cover Change and its Implications for Kullu District of Himachal Pradesh, India. Int J Geomat Geosci. 2013; 3(3): 538-551.
- Negi V, Chandel V. B. S, Brar K. K. Landscape Change Analysis of Upper Beas Valley, India Using Corona and Planetscope Imageries. Punjab Geogr. 2022; 18: 8-30.


