Spatial Pattern of Covid-19 in Relation to Population Density: A Case Study in Assam (India)
Satyendra Hazarika
*
and Niha Dutta

1
Department of Geography,
Darrang College,
Tezpur,
Assam
India
http://dx.doi.org/10.12944/CWE.17.3.22
Copy the following to cite this article:
Hazarika S, Dutta N. Spatial Pattern of Covid-19 in Relation to Population Density: A Case Study in Assam (India). Curr World Environ 2022;17(3). DOI:http://dx.doi.org/10.12944/CWE.17.3.22
Copy the following to cite this URL:
Hazarika S, Dutta N. Spatial Pattern of Covid-19 in Relation to Population Density: A Case Study in Assam (India). Curr World Environ 2022;17(3).
Download article (pdf) Citation Manager Publish History

Introduction
COVID-19 is a global catastrophic pandemic that has destabilized the entire humanity during 2020-21 in terms of their life and livelihood. World Health Organization (henceforth WHO) is continuously working on various dimensions of COVID-19 issues including data collection to general health care and specific prevention including vaccination etc. By end of January 2020, 20 countries had reported COVID-19, that gone up to 54 in February, and 202 by end of March that further rises to 212 by April 2020. It thus quickly literally becomes a global health crisis, excluding Antarctic and few islands of the Pacific. In India where the third wave of COVID-19 is already pending, the country is battling with 25 million cases since the pandemic began. Thus, the country ranked the second highest confirmed infections cases after the United States of America.
According to a WHO global report, worldwide 243,857,028 confirmed COVID cases are detected (as on October 2021) that includes 4,953,246 deaths. India has 34,202,202 confirmed COVID cases (which are just about 14% of the global COVID cases) with 455,068 deaths, representing 9.2% of the global COVID deaths (WHO report). According to the latest updated global statistics total coronavirus cases is 599,283,402, that includes 6,467,402 death and 573,275,931 recovery (as on 19th August 2022).
Another interesting observation is that places having high density like cities and metropolitan etc. have faster spread of the disease than places in isolation and lesser density. Among the Indian states Maharashtra reported the highest confirmed COVID-19 cases of over 6.6 million cases, followed by Kerala and Karnataka (as on October 2021), where Assam stand at 17th position in terms of confirmed cases. The paper is a spatial analysis of district level COVID-19 pattern in state of Assam, India in relation to its district population density and affect per 10000 of population, where database during the first wave of the pandemic is taken into consideration for the necessary analysis.
Relevant studies of COVID and population dynamics
At global level COVID-19 and population correlation is established by various researchers, considering various population related parameters like: density, urban population, economic status etc. In a district level study at Bangladesh a positive relationship value of R=0.876 is observed between COVID-19 spread and density pattern of population, which is high degree of relationship. (1)
The use of geospatial tools may also play critical role in understanding the various dimensions of COVID-19. Another study has (2020) demonstrated the relevance of geospatial analysis for effective decision making and addressing the critical issues related to spread of the disease over space and time. (2)
Carballada and Balsa-Barreiro (2021) demonstrated how the application of geospatial analysis to fine-grained data must be urgently adopted for optimal decision making in real and near-real time. (3)
Another metropolitan level study has shown both direct and indirect impact of number per unit area on the COVID-19 infection and mortality rate for 913 metropolitan counties. The study found that metropolitan population is a significant predictor of infection rate. Larger metropolitan have higher infection and higher mortality. (4)
Since the outbreak of COVID-19 as a global pandemic, its studies have been undertaken by academicians across disciplines. Some of the fields of studies are: genetics of the disease and its spatio-temporal mutation, medical emergencies out of the disease, various socio-economic, demographic and politico-cultural impacts assessment during and after the outbreak of the pandemic, lockdown impact in various dimensions like on health, education, economy, children psychology etc. The attempt in this paper is a demographic district level study of the initial COVID-19 outbreak in relation to population density in state of Assam, India. Some of the related studies are incorporated herewith that are undertaken at global and national level.
In Indian context, a study by Arif and Sengupta has explained how population density in a given unit of area affects the spread of the corona virus, its contact and subsequent diffusion. The study unfolded a positive relation between population density and the disease spread. They highlighted the study based on state level assessment in four south Indian states of Kerala, Tamil Nadu, Karnataka and Telengana . (5)
In places of high density and places where people live in close contact, there is a scope of higher spread of contagious diseases, including one like corona-virus. The study at district level have unfolded a moderately positive relation between the virus and the density of population structure of those districts. (6)
A select metropolitan level study in India between inhabitants against a given unit of area and its effects on transmission of corona virus have observed a strong correlation between both of them with R=0.842 (2021). (7)
Population density is endorsed as a catalyst factor for the proliferation of COVID-19 in Algeria cities, where a strong correlation is observed between population density and spread of the virus (2020). (8)
Study area: The study area covered in this paper is the state of Assam, India. The analysis is done at district level to investigate the correlation of district level population density and COVID cases. Figure-1 have indicated the outline map of the study area.
 | Figure 1: Location Map of Study Area
|
Objectives
The main objectives of this research paper are as follows
To find out the COVID-19 affected zones in relation to population density pattern at district level, Assam.
To find out COVID confirmed cases per 10,000 of district population, Assam.
To find out the correlation between population density and COVID confirmed cases.
Research question:
Is population density in a possible key determinant of the risk of COVID-19 transmission?
Methodology: As a district level analysis the paper tries to investigate the correlation of the confirmed COVID-19 cases (during 1st wave) and population density of the districts of Assam. For that secondary data base of population density (census, 2011) and COVID-19 confirmed cases from COVID-19 desk board, government of Assam is taken into consideration. Karl Pearson’s correlation method is used for the analysis of the relation, which is further tested with t-test application. A cartographic representation is also constructed using GIS platform to observe the COVID-19 zones in relation to population density pattern.
In addition to the ‘r’ analysis, there is also a projection of district-wise COVID-19 confirmed cases in Assam per 10,000 populations. It has been arranged in descending order and presented in form of a trend line.
 | Figure: 2 The flow chart of the research methodology
|
Discussion and analysis
Within Assam the first confirmed case of the virus was detected on 31st March 2020 from Karimganj district. It was the 3rd confirmed case in North-East India after one case each from Manipur and Mizoram. Till 28th February, 2021 the Govt. of Assam has confirmed a total of 63,950 cases in which 18,670 are in active mode. To date, with 70.58%, 45,138 patients have recovered and 167 deaths (0.26%) have been reported in Assam.
District level COVID-19 zones
As indicated in table: 1 a district level COVID zoning is done as low, moderate and high , in relation to population density. Based on data a district-wise zones of confirmed cases till 28th February, 2021, is represented through choropleth map on GIS platform (Figure:3) in which Kamrup Metro district is considered as the hotspot for COVID-19 with 20,663 confirmed cases in Assam. Along with Kamrup Metro, Nagaon, Jorhat, Dibrugarh, Tinsukia and Cachar districts are also fall under the category of high zone with more than 3000 cases in each district. These are also the district having highest population density zone (>800 person/ sqkm.). On the other hand, Goalpara, Kokrajhar, Barpeta, Baksa, Chirang, Bongaigaon, Nalbari, Udalguri, Morigaon, Karbi-Anglong, Dima Hasao, Hailakandi, Karimganj, Sivasagar, Lakhimpur and Dhemaji districts come under the category of low COVID zone with less than 1500 cases, representing lowest population density zone (<400 person/ sqkm). The remaining districts falls under moderate category both in terms of COVID confirmed cases and population density, with cases in between 1500-3000 with density between 400-800 person/ sq km.
The choropleth map is based on 2011 census data for which newly formed districts including Hojai, Biswanath Chariali, Majuli, Charaideo and West Karbi Anglong are not included here.
Table 1: Zones of Covid Confirmed Cases and Population Density
ZONE (Based on COVID Confirmed Cases) | DISTRICTS | DENSITY | DISTRICTS |
Low | Goalpara, Kokrajhar, Barpeta, Baksa, Chirang, Bongaigaon, Nalbari, Udalguri, Morigaon, Karbi-Anglong, Dima Hasao, Hailakandi, Karimganj, Sivasagar, Lakhimpur and Dhemaji. | Low (Below 400) | Dima Hasao, Karbi Anglong, Kokrajhar, Sonitpur, Dhemaji, Tinsukia, Dibrrugarh, Jorhat, Golaghat, Chirang and Baksa. |
Moderate | Dhubri, Kamrup Rural, Sonitpur, Golaghat and Darrang. | Moderate (400-800) | Goalpara, Barpeta, Morigaon, Nagaon, Lakhimpur, Sivasagar, Cachar, Karimganj, Hailakandi, Bangaigaon, Kamrup Rural, Nalbari, Darrang and Udalguri. |
High |
Kamrup Metro, Nagaon, Jorhat, Dibrugarh, Tinsukia and Cachar.
|
High (Above 800) |
Kamrup Metro and Dhubri. |
Source: COVID zones are based on COVID 19 Dashboard – Govt. of Assam (https://covid19.assam.gov.in/) (9)
Population Density zones are based on Census Report, 2011.
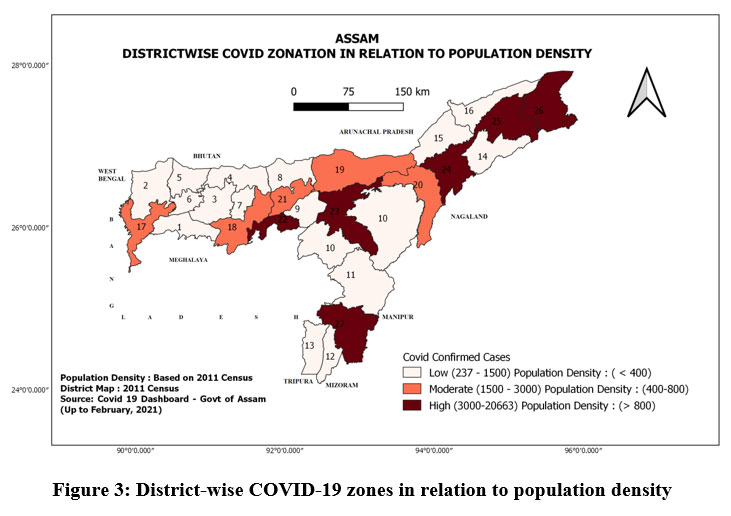 | Figure 3: District-wise COVID-19 zones in relation to population density.
|
Among the various controlling factors that give direct or indirect inputs towards daily rise of COVID cases, urban population and population density followed by availability of testing laboratories, doctors, other health workers, bed in public health centers, govt. hospitals, population below national poverty line, percentage of marginal workers and percentage of the elderly population etc. are the most prominent one. Areas with higher number of people are expected to have more cases as population density is one of the most important promoting factors of COVID-19. For this purpose, here an attempt is made to study about the interrelationship between population density and COVID cases in Assam.
Trend Analysis of COVID cases/ per 10,000 Population: Analysis of district-wise COVID-confirmed cases per 10,000 people of Assam is estimated as shown in table: 2. It has been arranged in descending order and projected through a trend line as indicated by figure: 4. The graph has clearly shown much higher cases/ per 10,000 people in Kamrup metro district (164.78/ per 10,000 people), which is also the highest district in terms of total confirmed cases. Rests of the district [i]are falling way behind at below 40/per 10,000 people.
Table 2: District wise COVID-19 Confirmed Cases per 10000 People, Assam (as on oct. 2021)
Name of the districts | Total confirmed case | Total district population | COVID Cases /10000 People |
Kamrup Metro | 20663 | 1253938 | 164.78 |
Jorhat | 3358 | 1092256 | 30.74 |
Dibrugarh | 3927 | 1326335 | 29.61 |
Tinsukia | 3366 | 1327929 | 25.35 |
Golaghat | 2387 | 1066888 | 22.37 |
Hailakandi | 1387 | 659296 | 21.04 |
Darrang | 1907 | 928500 | 20.54 |
Kamrup (Rural) | 2902 | 1517542 | 19.12 |
Cachar | 3302 | 1736617 | 19.01 |
Bangaigaon | 1113 | 738804 | 15.06 |
Nagaon | 3895 | 2823768 | 13.79 |
Nalbari | 948 | 771639 | 12.29 |
Sonitpur | 2351 | 1924110 | 12.22 |
Lakhimpur | 1266 | 1042137 | 12.15 |
Dima Hasao | 237 | 214102 | 11.07 |
Udalguri | 758 | 831668 | 9.11 |
Dhubri | 1723 | 1949258 | 8.84 |
Karimganj | 1025 | 1228686 | 8.34 |
Dhemaji | 502 | 686133 | 7.32 |
Morigaon | 638 | 957423 | 6.66 |
Barpeta | 1121 | 1693622 | 6.62 |
Karbi Anglong | 632 | 956313 | 6.61 |
Goalpara | 658 | 1008183 | 6.53 |
Chirang | 280 | 482162 | 5.81 |
Baksa | 487 | 950075 | 5.13 |
Kokrajhar | 408 | 887142 | 4.59 |
Sibsagar | 529 | 1151050 | 4.59 |
Data Source: Confirmed COVID-19 Cases are based on COVID-19 Dashboard – Govt. of Assam
Total Population data is based on Census Report, 2011. (10)
 | Figure 4: District-wise confirmed COVID cases/ 10,000 population.
|
Calculation of Correlation: Based on district-wise population density and COVID confirmed cases, ‘r’ is calculated using Karl Pearson correlation, which is further, tested using t-test. The result is enlisted in table: 3 & table: 4 respectively.
Table 3: Correlation
|
| Population Density | COVID Confirmed Cases |
|---|---|---|---|
Population Density | Pearson Correlation | 1 | .641** |
Sig. (2-tailed) |
| .000 | |
N | 27 | 27 | |
COVID Confirmed Cases | Pearson Correlation | .641** | 1 |
Sig. (2-tailed) | .000 |
| |
N | 27 | 27 | |
**. Correlation is significant at the 0.01 level (2-tailed). |
| ||
To show the relation between population density and COVID confirmed cases Karl Pearson’s Correlation Coefficient is calculated as it’s a statistical tool to examine the association between two variables as well as whether two variables are positively or negatively related and what is the intensity of their relationship. From the table 3 it is cleared that there exist a positive correlation in between population density and COVID confirmed cases as the value of R is 0.641 which is in between 0.5 to 1. However, without applying the t test isn’t feasible to generalize this positive relationship for all the districts.
Table 4: Paired Samples t-Test.
|
| Paired Differences | t | df | Sig. (2-tailed) | ||||
|---|---|---|---|---|---|---|---|---|---|
|
| Mean | Std. Deviation | Std. Error Mean | 95% Confidence Interval of the Difference | ||||
|
| Lower | Upper | ||||||
Pair 1 | COVID confirmed cases - PopulationDensity | 1.795E3 | 3695.848 | 711.266 | 332.860 | 3256.918 | 2.524 | 26 | .018 |
Here, t value is highly positive and the p value is < .05 so, it is cleared that there is a relation between population density and COVID confirmed cases which is statistically significant also. Thus, it may be concluded that this positive correlation is applicable for all the districts.
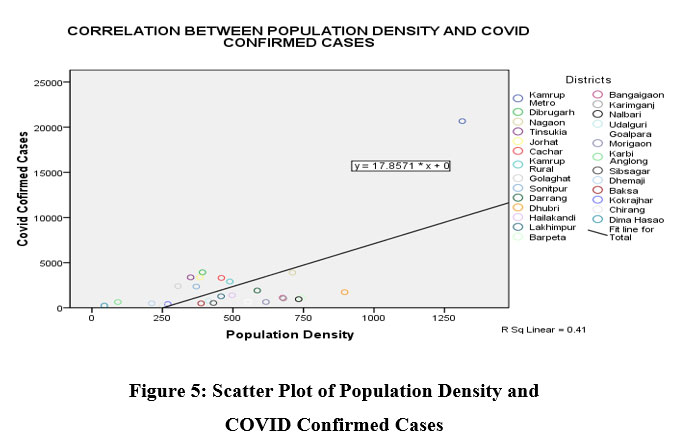
 | Figure 5: Scatter Plot of Population Density and COVID Confirmed Cases
|
Figure 5 shows that district of Kamrup Metro followed by Dibrugarh, Tinsukia, Jorhat, Cachar, Kamrup Rural, Golaghat, Sonitpur, Kokrajhar, Dhemaji, Chirang, Karbi Anglong and Dima Hasao fall above the fit line and rest are below the same.
Findings
Based on the study it has been observed that Kamrup Metropolitan has the highest COVID cases, which is also the highest population density belt. It has also indicated the highest COVID affect/10000 population. Overall the state as a whole have a positive correlation between confirmed COVID cases and population density, which is moderately correlated with a ‘r’ value of .641. Some of the finding of the study is summarized in the following ways:
Till 28th February, 2021 the Govt. of Assam has confirmed 167 people succumbed to COVID, while with 70.58%, 45,138 patients have recovered out of 63,950 confirmed cases in which 18,670 are in still active mode.
Among the various controlling factors large population size (especially urban population) with high density plays a dominant role in raising daily mark of COVID cases in Assam.
The trend of COVID affect per 10000 people has indicated highest cases in Kamrup Metroploitan (164.78/ per 10,000 people), which is also the highest district in terms of total confirmed cases. Rests of the district are falling way behind at below 40/per 10,000 people.
As per the Karl Pearson’s Correlation Coefficient there exist a positive relationship in between population density and COVID confirmed cases as the value of ‘r’ is 0.641 which is in between 0.5 to 1. In this regard, with high population density Kamrup Metro district has become the hotspot for COVID-19 with 20,663 confirmed cases in Assam, with highest affect per 10,000 people.
Kamrup Metropolitan district followed by Dibrugarh, Tinsukia, Jorhat, Cachar, Kamrup Rural, Golaghat, Sonitpur, Kokrajhar, Dhemaji, Chirang, Karbi Anglong and Dima Hasao fall above the line of best fit and rest are below the same.
Acknowledgement
Myself Dr. Satyendra Hazarika the first author of the paper have acknowledged the help of my co-author in executing my concept, especially in the making of the GIS map of the theme.
Conflict of Interest
The authors declare no conflict of interest in the completion of the work.
Funding Sources
The authors haven’t received any financial support for the publication of the research article.
References
- Alam, M.Z., Is population density a risk factor for communicable diseases like COVID-19-a case of Bangladesh, Asia pacific Journal of Public Health, 2021
- Pardo E. F., Billa L., Spatial Analysis and GIS in the study of COVID-19: a review, Science Direct, 2020, volume 739,
- Carballada and Balsa-B., Geospatial Analysis and Mapping Strategies for Fine-Grained and Detailed COVID-19 Data, with GIS, https://www.mdpi.com/2220-9964/10/9/602. 2021
- Hamidi S., Sabouri S., Ewing R., Does Density Aggravate the COVID-19 Pandemic?, Journal of American Planning Association, 2020, vol.86, No.4, p1
- Arif M., Sengupta S., Nexus between population density and novel coronavirus (COVID-19) pandemic in the south Indian states: A geo-statistical approach, Environment, Development and Sustainability, 2021, 23 (7), 10246-10274
- Bhadra A., Mukherjee A, Sarkar K., Impact of population density on Covid-19 infected and mortality rate in India, Modelling Earth Systems and Environment, 2021, 7(1), 623-629
- Dwivedi S., Misra S., Agnihotri R., Kumar V., Sharma P, Sinam G., Pandey V., Environmental Disease, vol.06, issue:04, 2021
- Kadi N., Khelfaoui M., Population density, a factor in the spread of COVID-19 in Algeria: A statistical study, Bulletin of Health the National Research Centre, 2020
- Covid-19 database of Assam, https://covid19.assam.gov.in/
- District Census Handbook, Assam 2011
- WHO Coronavirus (Covid-19) dashboard, https://covid19.who.int


