Suitable Site Selections for Artificial Recharge Structure in Bandalli Watershed. Chamarajanagar District, Karnataka, India Using Remote Sensing, and GIS Techniques.
Pradeepraju N * , Nagaraju D and Sudeep S R
1
Department of Studies in Earth Science,
Manasagangotri, University of Mysore,
Karnataka
India
http://dx.doi.org/10.12944/CWE.17.3.20
Copy the following to cite this article:
Pradeepraju N, Nagaraju D, Sudeep S. R. Suitable Site Selections for Artificial Recharge Structure in Bandalli Watershed. Chamarajanagar District, Karnataka, India Using Remote Sensing, and GIS Techniques. Curr World Environ 2022;17(3). DOI:http://dx.doi.org/10.12944/CWE.17.3.20
Copy the following to cite this URL:
Pradeepraju N, Nagaraju D, Sudeep S. R. Suitable Site Selections for Artificial Recharge Structure in Bandalli Watershed. Chamarajanagar District, Karnataka, India Using Remote Sensing, and GIS Techniques. Curr World Environ 2022;17(3).
Download article (pdf) Citation Manager Publish History


Introduction
The primary sources of water depend upon the nature of precipitations; for these sources, mainly the storage role is essential and the role of recharge of water based on the role of the Physiographical components is highly significant. Under the water table, fully saturated soils and geological formations contain subsurface water. Therefore, safe groundwater abstraction and good groundwater management are critical for the resource's long-term viability1. One of the recommended management strategies is artificial groundwater replenishment2. Natural groundwater replenishment is slow and is influenced by the pedology and geology of the area. Groundwater levels will decline if it is utilized at a faster rate than its natural replenishment2. In the long run, this depletes groundwater resources, making the natural replenishment of groundwater reserves more difficult.
Artificial groundwater replenishment is becoming increasingly significant. Artificial recharging is the technique of excess surface water moving from the earth’s surface to subsurface water-bearing layers, where it can be stored for future use through an artificial system. Seepage from streams, lakes and ponds, as well as irrigation return flow from canals and fields, aquifer interflows and urban recharge is all sources of aquifer recharge. Natural recharge, on the other hand, comes from natural sources. Artificial recharge is using water to refill an aquifer's water supply. The storage of the water will calculate through the water level in the existing bore wells or open wells through the aquifer test. Some things to think about Natural recharge comes from precipitation that falls on the earth's surface and travels underground, while artificial recharge comes from human actions that intentionally or incidentally replenish an aquifer. Artificial recharge systems have proven to be effective in aquifer preservation and replenishment. Rainwater conservation refers to directly collecting rainfall, using it as needed and recharging the groundwater. Artificial recharging involves collecting as well as conserving precipitation water that variously leaks toward the ground or runoff stream networks3. As a result, artificial recharge was carried out using the spreading approach to raise the water table and gradually lower salinity. Finding a suitable location for water recharge has necessitated careful consideration adopting Remote Sensing and Geographic Information System (GIS) techniques. The probable locations for artificial recharge structures can be found using Remote Sensing and GIS, as a consequence part of them have even tried through develop check dams, gully occlusion and percolation tanks using illustration satellite data. Emphases should be placed on factors including raindrops, soil types, drainage, slope and land use/land cover when determining sites for artificial recharging structures. The models were created using ArcGIS software to evaluate which locations were most appropriate for a recharge.
Materials and Methods
Study Area
Bandalli watershed is roughly prevailing southwestern section of the Hanur taluk of Chamarajanagar district, Karnataka. The total geographical study zone of the Bandalli watershed is 400sq.km; it comes under the Survey of India toposheet numbers 57H/4 and 57H/8 on a scale of 1: 50,000. The study area lies partly in semi-forest (reserved) and partly in the maidan tract and is situated in the southwestern part of Karnataka state between 12°09?56.3“North latitude and 77°21?06.5” East longitude. The area falls into the Archean-Proterozoic Gneiss of Southern Karnataka, which is classified as semi-arid, with Gneisses occupying the total area. The study area belongs to one of the five taluks of the Chamarajanagar district. It is one of the 30th districts in Karnataka state, predominately dependent on agriculture. It shows low, narrow, alluvial plain structures. (Fig.1)
It is one of the locations where a significant water shortage exists due to various factors like excessive extraction, low infiltration rates, a lack of recharging methods and others. In addition, it is regarded as one of the state's most heavily exploited areas. There are more than 54 communities within the study area. The area is tropical; the average annual rainfall is 800mm in evaporation and evapotranspiration levels vary from 50 to 80%. The following strategies were used within the current study.
 | Figure 1: Location map of the study area.
|
Data collection
The data processing of the area creates various thematic maps. Later, maps were used to evaluate the water recharge and the amount of water available in the area. The analysis tool in Arc-GIS was used to produce multiple thematic maps of Lu/Lc, Geomorphological including drainage structures considered for delineating artificial recharge structures. Soil, rainfall, runoff and Digital evaluation models were used in this investigation. (DEM), soil type maps together with rainfall data were converted for runoff evaluation and water recharging using remote sensing data (Land sat satellite images 8 operational land imager). It uses Satellite sources taken away United States Geological Survey (USGS) database and is georeferenced to (Universal Transverse Mercator) UTM zone 43, WGS 84 at a 30m resolution. DEM was used to create the drainage layer, slope and topographic maps. The research area lineament and hydro soil map were created using coverage developed by the Geological Survey of India. The Regional Ground Water Department of Chamarajanagar district provided monthly and annual water level and rainfall data for 2008-2021, as determined by the four meteorological stations in the study area.
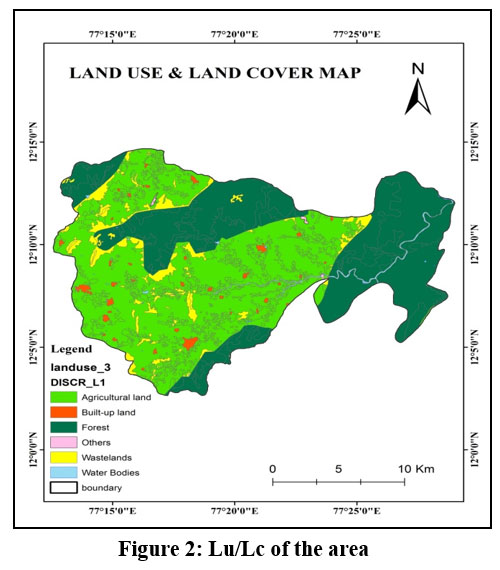
Land use and land cover
Land cover studies and land usage features are criteria for determining a good site for recharge structure2. Land use/cover change and rainfall affect the river basin’s hydrological response and its impact on the changing Lu/Lc on Watershed runoff have been a source of concern among hydrologists. This is essential for runoff evaluation because as the initial abstraction decreases, the runoff rate increases4. As a result, it is critical to detect changes in the watershed's runoff feature due to Physiographic changes. Land information is related to runoff, which is formed by precipitation in a specific Period due to increased recharge, whereas vegetation areas are covered with low runoff areas2. The land cover/use thematic map was assessed by using supervised distribution. Waterbody, forest region and demographic features are classified into five primary types of land resources.
These areas of Lu/Lc were intended to recognize and map the various Lu/Lc classifications4. Major Lu/Lc elements are buildup land, cropland, fallow land, plantation, forest and scrub forest; a total of 43% showing the area falls beneath agriculture resting Forest including scrub land accounted for 32% moreover 25% of the total area respectively (Fig.2). Although these sites have good groundwater recharge structure, they are often limited. Therefore, they cannot be used for any groundwater extraction activities8.
 | Figure 2: Lu/Lc of the area.
|
Geomorphology
Geomorphologic land formations can play an essential role in hard rock terrain because they are generated by relief, slope, weathering extent, distinct materials that have been weathered and the overall ensemble of groundwater regime5. Because of its importance in groundwater circulation and storage study, geomorphology was given the highest weight6. Hilltop weathering, linear features/ dykes, structural hills, residual hills and pediment/valley floor are some of the landforms in the area. Due to un-fractured rock, minimal infiltration and primarily runoff-oriented behavior, these units are considered poor potential zones. It is illustrated in shallowly obscured pediment, moderately obscured pediment, profound pediment, and classified, moderately buried pediplain. (Fig.3)
 | Figure 3: Geomorphology of the area.
|
 | Figure 4: Lithology of the area.
|
Drainage system and soil
The stream has a dendritic to sub-dendritic drainage pattern. There are many minor irrigation and percolation tanks in the area, which are built across the rivers and streams. (Fig.5)
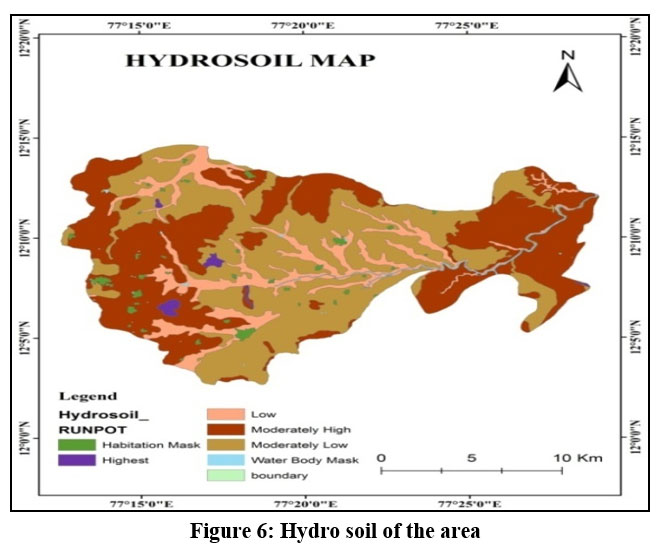
Clay soil, clay loam soil, gravelly loam sand, red soil and other types of soil cover most of the area. These soils are ideal for growing various vegetables, crops and seeds. Soil's role of permeability is an important characteristic that influences the recharging as well as storage as concerns water through the Porous concerning soil layers7. The amount of sand and clay in the soil determines the textural class9. Because of their ability to hold more water, very fine and medium-grained sizes of soil are better suited for artificial recharge10. The soil that is best for artificial recharge studies of higher retention and high infiltration11. Clay soil has a very high runoff depth, which allows for low infiltration, and sand soil has a decreased runoff depth, which allows for more infiltration. (Fig.6)
 | Figure 5: Drainage of the area
|
 | Figure 6: Hydro soil of the area.
|
Table 1: Hydrological Soil class and comparable Soil textures.28
Soil class | Runoff explanation | Soil Texture |
? | Low runoff potential because as regards huge infiltration rate | Sand, loamy sand, as well as sandy loam |
? | A little infiltration rates lead through moderate runoff potential | Silty loam and loam |
? | High/moderate runoff potential because as regards lagging infiltration rates | Sandy clay loam |
? | High runoff potential among shallow infiltration | Clay loam, silty clay loam, sandy clay, silty clay, and clay |
Stream order
A stream order map was created using the hydrological characteristics extracted from the spatial analysis tool13. The elementary provenience concerning surface water is the watershed28, which is utilized for the survival of humans and Physiographic features14. The stream's layout was determined by the connections between its major drainage features at the various Stream classification refers to the movement of surface runoff and allows for the recharge process of the area based on the size of the watershed, and its significant role is important. The order analysis is significant for mapping rainwater conservation streams because higher stream orders have lower permeability and infiltration12. The study region has six stream orders, the largest being the first, in two and three, and the minimum being the sixth. (Fig.7)
 | Figure 7: Stream order of the area.
|
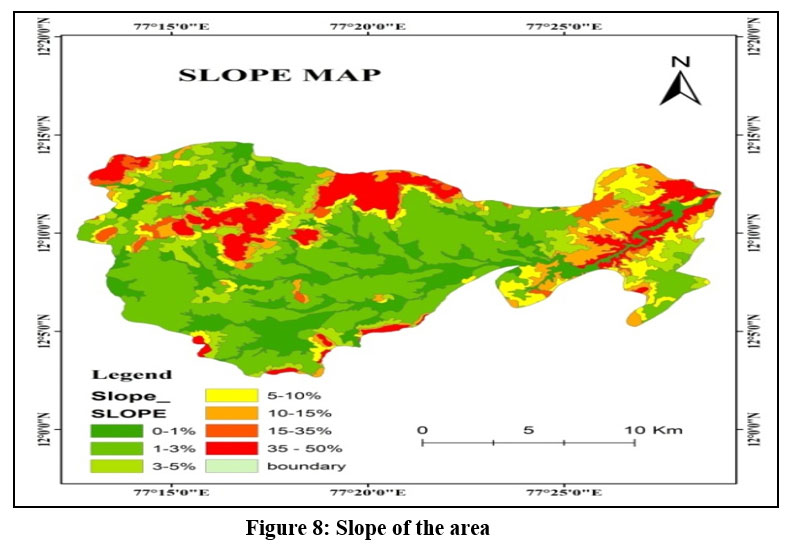
Slope
The slope tool determined the sharpest descent fall from within the cell by calculating the topography, the lower slope of the area and the steeper portion of the morphology. The Watershed size and the role of the morphology features is straight or undulating to determine the process of recharge site is a critical criterion for determining the optimal site for artificial recharge to obtain the channel's enormous capacity for storing data15. The number of materials and process of recharge factors of the consideration required to build dams is all affected by the slope parameter16. The slope is one of the most crucial factors to consider in determining flood-spreading areas. Runoff is more erosive on steep slopes because Water velocity is proportional to the slope and depth of the ground. The goal is to spread water over a vast area in the form of a thin film that flows downhill gently without disturbing the soil17. Gentle slopes are ideal for artificial recharge because the retained water by the artificial recharge structure will be larger than infiltrations at structures in steep places, according to the slope classes map (Fig.8).
 | Figure 8: Slope of the area
|
Table 2: Integrated Mission for Sustainable Development Slope distribution
Sl.No | Slope class | Slope % |
? | Closely level | 0 - 1 |
? | Very gently sloping | 1 – 3 |
? | Gently sloping | 3 – 5 |
? | Moderately sloping | 5 – 10 |
? | Steadily sloping | 10 – 15 |
? | Very steep sloping | >35 |
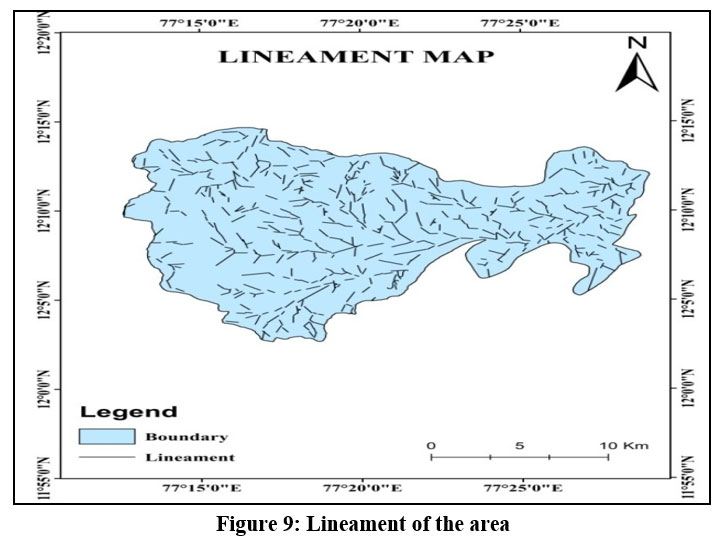
Lineament
Lineament refers to linear image large-scale structural controlled elements including structural weaker, fractures, structural flaws, joints, drainage lines and rock formation boundaries. It provides the pathways for groundwater movement and is critical hydrologically for supplying groundwater flow channels19. Its effect on lithology through water percolates downstream, indicating potential artificial recharge sites. Lineament's role was necessary based on rocks because they combine secondary porosity, permeability and intergranular properties to impact groundwater circulation. Groundwater recharge zones are defined as regions where two or more lineaments cross. Lineaments operate as superior conduits for groundwater movements in hard rock topography and the combination of major lineaments is topographically depressed to create groundwater recharging10. It was most of the areas of different directions. (Fig.9), through precipitation is capable of infiltrating and can travel for several kilometers, and potential sites for artificial recharging were discovered.
 | Figure 9: Lineament of the area.
|
Rainfall
The study area receives roughly 45 percent of its rainfall during the southwest monsoon season; moreover, there are four rain gauge stations prevailing study area. The average rainfall in the area is 800mm, and the average low rainfall is 450mm in the central part as concerns the study area. It is lowest in the district's northwestern section and rises in its southeastern section.
Water levels fluctuate between 3.4m and 14.5m after and before the monsoon (Table 3). The average Pre-monsoon along with Post-monsoon water levels is 8.2metres to 17.8metres, respectively. The highest water level fluctuation in the area was visual in the center including southern parts concerning the research area.
Table 3: Monthly along with Annual Water levels statistics of the Bandalli watershed.
Year | Jan | Feb | Mar | Apr | May | Jun | Jul | Aug | Sep | Oct | Nov | Dec | Annual |
2008 | 13.20 | 12.80 | 12.50 | 12.40 | 14.80 | 13.80 | 14.0 | 14.30 | 13.60 | 13.80 | 13.0 | 12.40 | 160.60 |
2009 | 14.4 | 14.20 | 14.20 | 14.50 | 15.20 | 15.30 | 15.30 | 15.70 | 15.50 | 14.50 | 14.40 | 14.40 | 177.60 |
2010 | 15.00 | 15.15 | 15.60 | 14.20 | 14.38 | 16.00 | 16.34 | 17.35 | 17.22 | 17.82 | 17.10 | 17.62 | 193.78 |
2011 | 18.56 | 18.20 | 18.35 | 15.71 | 15.85 | 15.93 | 15.73 | 15.65 | 15.82 | 15.15 | 14.55 | 15.62 | 195.12 |
2012 | 15.65 | 15.65 | 15.65 | 15.25 | 15.75 | 16.80 | 17.10 | 16.20 | 16.48 | 16.50 | 16.20 | 16.50 | 193.98 |
2013 | 16.00 | 16.55 | 16.20 | 16.70 | 16.90 | 16.80 | 17.50 | 17.68 | 15.48 | 14.12 | 15.98 | 17.35 | 197.26 |
2014 | 15.38 | 16.68 | 16.60 | 17.44 | 17.60 | 16.00 | 16.50 | 17.05 | 15.80 | 14.95 | 15.50 | 16.80 | 196.30 |
2015 | 17.00 | 17.30 | 17.45 | 17.45 | 17.44 | 16.25 | 16.20 | 16.25 | 16.36 | 16.45 | 16.30 | 14.70 | 199.15 |
2016 | 15.00 | 15.90 | 16.15 | 17.00 | 14.70 | 13.50 | 12.80 | 12.85 | 12.75 | 12.70 | 12.95 | 13.10 | 169.40 |
2017 | 14.10 | 14.90 | 14.85 | 14.95 | 15.40 | 14.08 | 14.11 | 14.28 | 11.60 | 9.15 | 9.12 | 10.09 | 157.44 |
2018 | 10.25 | 10.03 | 10.31 | 9.60 | 10.31 | 8.29 | 9.91 | 10.22 | 10.56 | 8.73 | 9.05 | 9.37 | 116.63 |
2019 | 9.70 | 10.36 | 10.69 | 11.31 | 11.25 | 10.63 | 10.96 | 11.45 | 11.67 | 10.44 | 9.90 | 9.92 | 128.28 |
2020 | 10.18 | 10.90 | 11.40 | 11.10 | 12.13 | 11.23 | 11.00 | 10.56 | 9.62 | 9.45 | 9.73 | 9.90 | 127.20 |
2021 | 10.11 | 10.68 | 11.35 | 13.18 | 12.38 | 13.23 | 13.31 | 13.63 | 13.69 | 13.44 | 11.48 | 9.71 | 146.19 |
Artificial recharge site selection
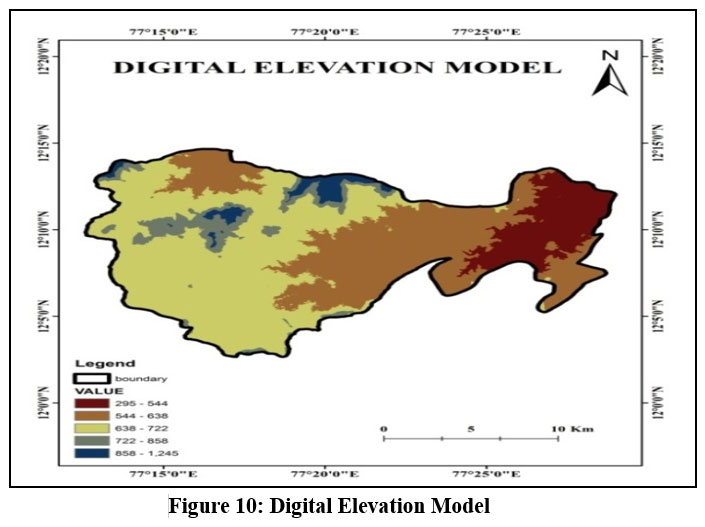
Artificial recharge uses artificial techniques to supplement the natural circulation of subsurface water from surface water formations11. Construction of various artificial recharge structures like infiltration galleries to the zone of Aeration to a zone of Saturation facilities, check dams and Predation Pits through to the subsurface are two methods for accomplishing this17. The porosity and permeability of the underlying lithological units in hard rock locations are insufficient. The amount of water taken out of the aquifers in these locations is insufficient to replenish the groundwater. In the development of watersheds, artificial recharge procedures are taken. Using integrated GIS along with Remote Sensing to plan for propriety sites being artificial recharge structures can be a potent tool. (Fig.10) However, in the state of Karnataka, this sophisticated technology has not yet found widespread use for this purpose. In this study, integrated Remote Sensing and GIS studies successfully recommend a viable place for future artificial recharge structures in the Bandalli watershed. The location was chosen solely based on hydrogeological considerations. (Fig.11)
 | Figure 10: Digital Elevation Model.
|
 | Figure 11: Location map of Artificial recharge area.
|
Selection of Artificial Recharge Site
In selecting the best sites for artificial recharge, studies are using the best modern techniques of remote sensing, and GIS applications are useful2. The initial step in such an investigation was to pinpoint the components that make recharge possible. The present artificial recharge system investigated various hydro geomorphological features and meteorological parameters, geology, soils and slope in the study area. Depending on this discovery, a set of guidelines has been designed through make out every ideal site considering artificial recharge as well as determine the exact locations.
Result and Discussion
Selection of Artificial recharge structures is critical for the maximum recharge Pedological of the area. The area of role characteristics and the preparation of various parameters derived from the software. The site selection map, drainage and lithology depend on the terrain. Identifying potential places for groundwater development and the selection of recharge structure and the study region has been potential groundwater recharge due to numerous characteristics5. All the elements recommended artificial groundwater recharge and aid in weighting depending on their ability to hold water. The Geomorphological role is significant for the recognition of land-use/land cover thematic maps for its significant role in the recharge of groundwater6. The slope map was created using contours from the SOI toposheets and contour intervals. Based on the IMSD (Integrated Mission for Sustainable Development) categorization, the slope has been divided into six groups (Table.2). Since the terrain is practically flat and the infiltration rate is relatively high, the area with a slope of 0 to 1% falls into the ‘very good’category23. The area with a 1 to 3% slope is gone into ‘good’ as groundwater recharge through kind of undulant topography among runoff. It has a 3 to 5% slope, relatively high runoff and low infiltration22. More than 35% of section prevail advised ‘poor’ through above slopes24. Most of the study area is encompassed by virtually flat slopes, with gentle and moderate slopes. This slope classification is employed to analyze locating and site selection for recharging underground water in the study region. Lithology is a crucial factor to consider when supporting areas suitable for artificial recharging since there is a significant influence on Precipitated water runoff andinfiltration4. Because of its low relief, it offers excellent opportunities for infiltration and recharges groundwater. Process the study region is underlain by Achaean crystalline rock masses; prominent rock exposures include Epidote/hornblende gneiss, Migmatites, Granodiorite, Pink granulite and Charnockite, which cover more than 60% of the whole area. (Fig.4)
The initial study stage is the infiltration and recharging of water through the surface to a subsurface process by various aquifer systems. Hydrological soils are divided into four categories: high, low, moderately high and moderately low. The study area is dominated by the general hydrological soil group, relatively low and high (Fig.6). The drainage pattern has revealed the porosity and permeability of the ground. A dendritic drainage pattern has been discovered in this study area (Fig.5). Selection sites for new structures play a vital role in nature, giving pedological support. Geology like every area, Geomorphology, Lu/Lc, drainage factors and terrain morphology are the most critical tools for groundwater recharge, and most of the area is flat surface8. To recommend the infiltration galleries, check dams, bunds and natural wells structures to store the water to directly or indirectly recharge groundwater. The superior study has authenticated the prospects in regard to using remote and Geographical Information systems as demarcating particular artificial groundwater recharge structures. This resulted in the determination that the region is suitable for an artificial recharging structure. (Fig.11)
Conclusion
Low rainfall, excessive runoff and evaporation are some of the factors contributing to the Bandalli watershed water scarcity. The various elements of the morphometric process are the results of the site selection revealed in the study region's northern portion. The results of the works have been sites are20% showing the area is suitable along with resting 15% as concern the area are excellent sites for recharge with low suitability and suitable recharge structures. The selection of the sites for needful information on topography, pedology, geology and morphometry role was significant. Average rainfall measurements from 2000 to 2020 were utilized to evaluate the runoff depth using the soil preservation model. When choosing the sites suited using artificial recharging, a combination of geology and land use/land cover, Geomorphology, hydrosoil and digital elevation models has proven to be quite effective. The current research demonstrates that recharge locations lower-order streams are likely to be present on a gentle slope and deliver artificial replenishment to a vast area. The groundwater prospect is the result of a systematic effort that considers the primary governing aspects that determine the yield of water and artificial recharge sites regarding groundwater standards. In addition, this research computed maps required for groundwater investigation planning and execution.
Acknowledgment
The author would like to thank the Chairman for supporting and providing laboratory facilities at the Department of Studies in Earth Science. University of Mysore, Mysuru-570006.
Conflict of Interest
The authors do not have any conflict of interest.
Funding Sources
There is no funding or financial support for this research work
References
- Abraham, M.K. & Mohan, S. (2015). Effectiveness of Artificial Recharge Structures in Enhancing Groundwater Storage: A Case Study. Indian Journal of Science and Technology. 8. 10.17485/ijst/2015/v8i20/81596.
- Anbazhagan, S., Ramasamy, S.M. & Das Gupta, S. Remote Sensing and GIS for artificial recharge study, runoff estimation and planning in Ayyar basin, Tamil Nadu, India. Environ Geol 48, 158–170 (2005). https://doi.org/10.1007/s00254-005-1284-4.
- Abanish Kumar, Shruti Kanga, Ajay Kumar Taloor, Suraj Kumar Singh, BojanDurin, Surface runoff estimation of Sind river basin using integrated SCS-CN and GIS techniques, HydroResearch,4,2021, Pages 61-74, ISSN 2589-7578,https://doi.org/10.1016/j.hydres.2021.08.001.
- Rashid, M., Lone, M.A. & Ahmed, S. Integrating geospatial and ground geophysical information as guidelines for groundwater potential zones in hard rock terrains of south India. Environ Monit Assess 184, 4829–4839 (2012). https://doi.org/10.1007/s10661-011-2305-2.
- Pandey A., Chowdary, V.M., Mal, B.C. and Dabral, P.P. (2011) Remote Sensing and GIS for Identification of Suitable Sites for Soil and Water Conservation Structures. Land Degradation and Development, 22, 359-372. http://dx.doi.org/10.1002/ldr.1012.
- Mohammed, A., Balasubramanian, A., Kondoh, A., Rokhmatuloh, R., and Mustafa, A.J. 2003. Hydro geomorphological mapping using remote-sensing techniques for water resource management around palaeo channels. Geoscience and Remote Sensing Symposium, IGARSS-APOS; 03. In: Proc. IEEE Intl. Toulouse, France. 5, 3317-3319.
- Salah Hamad, Nilanchal Patel. “Chapter 8 Surface Water Potential and Suitable Sites Identification for RWH in the Semi-Arid and Arid Watershed of WadiSammalus, Northeast Libya Using GIS and Remote Sensing Approach”, Springer Science and Business Media LLC, 2022.
- Mondal, M.S.; Sharma, N.; Kappas, M.; Garg, P.K. Critical Assessment of Land Use Land Cover Dynamics Using Multi-Temporal Satellite Images. Environments 2015, 2, 61-90.https://doi.org/10.3390/environments2010061.
- Bakhtiar Osman Khzr&Gaylan Rasul Faqe Ibrahim &Ariean Ali Hamid &Shwan Ahmad Ail, 2022. “Runoff estimation using SCS-CN and GIS techniques in the Sulaymaniyah sub-basin of the Kurdistan region of Iraq,” Environment, Development, and Sustainability: A Multidisciplinary Approach to the Theory and Practice of Sustainable Development, Springer, vol. 24(2), pages 2640-2655.
- Kudrna, K. and Sindelaoova, M. 2006. Principles of hydrogeomorphology as a basic precondition for the solution of the territorial structure of a unitary system of agricultural, forest, and water management. Journal of Central European Agriculture, 7(4): 669-676.
- Anand, B., Karunanidhi, D. & Subramani, T. Promoting artificial recharge to enhance groundwater potential in the lower Bhavani River basin of South India using geospatial techniques. Environ SciPollutRes28, 18437–18456 (2021).https://doi.org/10.1007/s11356-020-09019-1
- Rawat, Kishan& Mishra, Anil Kumar & Ahmed, Nayan. (2017). Surface runoff estimation over heterogeneous foothills of Aravalli mountain using medium resolution remote sensing rainfall data with soil conservation system-curve number method: A case of semi-arid ungauged Manesar Nala watershed: Semi-arid ungauged Manesar Nala watershed. Water and Environment Journal. 31. 10.1111/wej.12243.
- Satapathy, Ipsita& Syed, Tajdarul. (2015). Characterization of groundwater potential and artificial recharge sites in Bokaro District, Jharkhand (India), using remote sensing and GIS-based techniques. Environmental Earth Sciences. 74. 10.1007/s12665-015-4474-8.
- Jagannathan Krishnamurthy, Arul Mani, Venkatakrishnan Jayaraman, M Manivel, Groundwater resources development in hard rock terrain - an approach using remote sensing and GIS techniques, International Journal of Applied Earth Observation and Geoinformation,2, Issues3–4,2000, Pages204-215, ISSN1569-8432,https://doi.org/10.1016/S0303-2434(00)85015-1.
- Singh, J P & Singh, Darshdeep&Litoria, Pradeep. (2014). Selection of Suitable Sites for Water Harvesting Structures in Soankhad Watershed, Punjab using Remote Sensing and Geographical Information System (RS&GIS) Approach-A Case Study. Journal of the Indian Society of Remote Sensing. 37. 21-35. 10.1007/s12524-009-0009-7.
- Jha, Madan & Chowdary, V. & Kulkarni, Y. & Mal, Bimal. (2014). Rainwater harvesting planning using geospatial techniques and multicriteria decision analysis. Resources, Conservation and Recycling. 83. 96–111. 10.1016/j.resconrec.2013.12.003.
- Pandey, A.; Chowdary, V.M.; Mal, B.C.; Dabral, P.P. Remote sensing, and GIS for identification of suitable sites for soil and water conservation structures. Land Degrad. Dev. 2011, 22, 359–372.
- Chowdary, Mythili& D., Ramakrishnan & Srivastava, Yash & Chandran, Vinu&Jeyaram, A. (2009). Integrated Water Resource Development Plan for Sustainable Management of Mayurakshi Watershed, India Using Remote Sensing and GIS. Water Resources Management. 23. 1581-1602. 10.1007/s11269-008-9342-9.
- Fatima Ezzahra El Ghazali, Nour-EddineLaftouhi, Ahmed Fekri, Giovanni Randazzo, MyriamBenkirane. “Enhancing the success of new dam implantation under semi-arid climate, based on a multicriteria analysis approach: Case of Marrakech region (Central Morocco)”, https://ui.adsabs.harvard.edu/abs/2021OGeo...13..313E.
- Alene, A., Yibeltal, M., Abera, A. et al. Identifying rainwater harvesting sites using integrated GIS and a multi-criteria evaluation approach in semi-arid areas of Ethiopia. Appl Water Sci 12, 238 (2022). https://doi.org/10.1007/s13201-022-01756-7
- B.C. Sundara Raja Reddy, N. Jayaraju, G. Sreenivasulu, U. Suresh, A.N. Reddy, Heavy metal pollution monitoring with foraminifera in the estuaries of Nellore coast, East coast of India, Marine Pollution Bulletin, Volume 113, Issues 1–2,2016, Pages 542551, ISSN0025326X, https://doi.org/10.1016/j.marpolbul.2016.08.051.
- N.S. Magesh, N. Chandrasekar, John Prince Soundranayagam, Delineation of groundwater potential zones in Theni district, Tamil Nadu, using remote sensing, GIS and MIF techniques, Geoscience Frontiers, Volume 3, Issue 2,2012, Pages 189-196, ISSN 1674-9871, https://doi.org/10.1016/j.gsf.2011.10.007.
- A. Chowdhury. “Integrated remote sensing and GIS-based approach for assessing groundwater potential in West Medinipur district, West Bengal, India”, International Journal of Remote Sensing, 01/2009.
- Alivia Chowdhury. “Delineation of groundwater recharge zones and identification of artificial recharge sites in West Medinipur district, West Bengal, using RS, GIS, and MCDM techniques”, Environmental Earth Sciences, 01/2010.
- A. Geetha Selvarani, K. Elangovan, C. Siva Kumar. “Evaluation of groundwater potential zones using electrical resistivity and GIS in Noyyal river basin, Tamil Nadu”, Journal of the Geological Society of India, 2016.
- Bhunia, Gouri Sankar, Nandini Chatterjee, and Dilip Kumar Pal. “Identification of groundwater potential zone of Nawada district, Bihar (India) – a study based on remote sensing and GIS platform”, Hydrology Research, 2014.
- Keiji Amamiya, Katsuhiko Saido, Seon-Yong Chung, Toshihiko Hiaki, Dong Soo Lee, Bum Gun Kwon. “Evidence of transport of styrene oligomers originated from polystyrene plastic to oceans by runoff”, Science of The Total Environment, 2019.
- H. C. Prasad, P. Bhalla, S. Palria. “Site Suitability Analysis of Water Harvesting Structures Using Remote Sensing and GIS – A Case Study of Pisangan Watershed, Ajmer District, Rajasthan”, ISPRS - International Archives of the Photogrammetry, Remote Sensing and Spatial Information Sciences, 2014.
- “Geospatial Technologies in Land Resources Mapping, Monitoring and Management”, Springer Science and Business Media LLC, 2018.


