The Estimation of Small Metal Traces of Cd (II) from the Alloy and Water Effluents using Fast and Accurate Extractive Spectrophotometric Method with Newly Developed DBA Reagent
Sonali S. Patil *
1
Department of Chemistry,,
J. S. M. College,
Alibag, Raigad,
Maharashtra
India
http://dx.doi.org/10.12944/CWE.17.3.26
Copy the following to cite this article:
Patil S. S. The Estimation of Small Metal Traces of Cd (II) from the Alloy and Water Effluents using Fast and Accurate Extractive Spectrophotometric Method with Newly Developed DBA Reagent. Curr World Environ 2022;17(3). DOI:http://dx.doi.org/10.12944/CWE.17.3.26
Copy the following to cite this URL:
Patil S. S. The Estimation of Small Metal Traces of Cd (II) from the Alloy and Water Effluents using Fast and Accurate Extractive Spectrophotometric Method with Newly Developed DBA Reagent. Curr World Environ 2022;17(3).
Download article (pdf)
Citation Manager
Publish History


Introduction
The accurate identification of cadmium in the samples of industrial liquid effluents, medical, pharmaceutical samples are important because of its toxicity and contribution towards the number of diseases and deaths (Fergusson et.al 1989 and Venugopal et.al.1979). All these above findings indicates that even a small traces of cadmium metal has an adverse effects on human health, Therefore, an accurate and simple identification of this cadmium metal at trace level is challenging task.
Various methods were reported for determination of cadmium (II), these are: ratio derivative polarography (Ni, 1998), differential pulse polarography (Hussain et al. 2002), adsorptive stripping voltammetry (Abbasi et al, 2011), flame AAS (Xiang et al, 2012), EAAS (Li et al, 2009), GF-AAS (Jahromi et al, 2007), ICP-OES (Salahinejad, 2011), ICP-MS (Jia et al, 2010). The above methods require sophisticated instrumentation, which are costlier and consume more time and money.
The investigations were made with Spectrophotometry, for determination of Cd (II); since it is simple, fast and require cheap analytical reagents. This method has got great demand and highly accepted in the field of industrial and environment applications. The merits of spectrophotometric method over an earlier methods were reported by Sandell (1965) and Morrison and Freiser (1996). Several researchers have devised and reported various analytical reagents for Cd (II) estimations (Ling et al, 1996; Zhang, 1998; Amin, 2001; Gao et al, 2001; Lee and Choi, 2001; Hashem, 2002; Bulgariu et al, 2005; Li, 2006; Reddy et al, 2008; Parikh et al, 2009; Gopalakrishna et al, 2010; Meng et al,2011; Wen et al, 2011; Amin and Gouda, 2012).
The structure determination of novel ligand has been reported using NMR, IR spectrum studies and detail observations are elaborated in the Appendix I.
Table 1 presents the comparison between the current and earlier spectrophotometric extraction methods.
The aim of this research is to extract traces of Cd (II) with newly developed DBA ligand. Efforts have been also done to determine Cd (II) in the small quantities from synthetic and alloy samples. Besides, the effects of pH, wavelength, and choice of optimum molar ratio on the extraction of Cd (II) have been also conducted.
Table 1: Comparison between Cd (II) determination methods.
Analytical Ligand | ?max (nm)
| pH | Beer’s law concentration range, ppm | molar extinction coefficient , L mol-1 cm- 1 | M:R | Observations | Reference |
Thiazolylazo Reagent | 616 | 9.0 | 0.003-4.0 | 2.14 x 10⁵ | 1:2 | Use of nonionic surfactant | Amin, 2001 |
p-Acetyl- benzenediazoa mminoazobenze ne | 475 | 12.5 | 0-20 | - | 1:3 | Standing time 10 min and use of high pH | Gao et al., 2001 |
Ammonium | 323 | 7.0 | 03-10.0 | - | 1:2 | Use of Tween 80 surfactant | Lee and Choi, 2001 |
pyrrolidinedithi ocarbamate |
|
|
|
|
| ||
4-(2- Pyridylazo)- resorcinol | 510 | 5.5 | 0-4.49 | 2.5 x 10⁵ | 1:1 | Excessiv e use of HClO4 | Hashem, 2002 |
p,p’-Dinitro-sym | 630- | 0.02N | 0.5-60 | 2.05 x 10⁴ | 1:2 | Extraction Carried out in strong basic media | Bulgariu et al., 2005 |
diphenyl carbazid | 640 | NaOH |
|
|
| ||
2,6- Dimethylphenyl diazoaminobenz ene | 523 | 0.2 M NH3 | 0-0.48 | 2.27 x 10⁵ | 1:3 | Reagent solution -in dimethyl –formam -ide | Li, 2006 |
Benzildithiosem icarbazone | 360 | 10.5 | - | 0.196 x 10⁴ | 1:1 | Use of strong basic buffer | Reddy et al., 2008 |
2-Hydroxy-4-n- butoxy-5- bromopropioph enone thiosemi carbazone | 440 | 10.0 | 5.62-16.86 | 4.035 x 10³ | 1:2 | Color stability one h | Parikh et al., 2009 |
Cinnamaldehyde | 383 | 9.0 | 0.056- | 5.6 x 10⁴ | 1:1 | Reagent | Gopalakris hna et al., 2010 |
-4- hydroxybenzoyl hydrazone |
|
| 0.562 |
|
| is very sensitive | |
3,5-Bis(4- phenylazophenyl aminodiazo) | 530 | 10.5 | 0-12 | 2.8 x 10⁵ | - | Use of nonionic surfacta nt | Meng et al., 2011 |
1-(2- Bezothiazolylaz o)-2-hydroxy-3- naphthoic acid | 692 | 8.5 | 0.2-3.5 | 7.05 x 10⁶ | 1:1 | Oxalate interfere seriously | Amin and Gouda, 2012 |
2, 4 dimethyl -3H-1,5 benzodiazepine (DBA) | 450 | 8.9 | 1-10 | 1960 | 1:1 | Sensitive and effective | Present Work |
Experimental techniques
Instruments used
In this work, a calibrated Ultra violet visible spectrophotometer (Model: Shimadzu 2450, 10 mm quartz cell) was used in the measurement of absorbance and pH measurement were done with a calibrated digital pH meter (Make: Elico LI-120). The important experimental parameters have been reported and are presented in Table 2
Table 2: Important Experimental variables
Parameter maintained | Remark |
Maximum Absorbance | 450 nm |
Solvent used | n- butanol as best among studied |
pH required | 8.9 |
Equilibration time observed | 60 seconds |
Stability of Cadmium- reagent | 48 hrs |
Optimum Beer’s concentration limit | 1 to 10 mg/ml |
Molar extinction coefficient | 1960 L mol-1cm-2 |
Sandell’s sensitivity | 0.01879 mg/ cm2 |
Mole ratio of Cd (II) : DBA | 1:1 |
Formulation of DBA ligand
A reaction between one mole of o-phenylenediamine and one moles of Acetyl acetone in presence of Ethanol (solvent) were carried out for formulation of novel ligand (Fig.1). The product achieved is then heated in water bath at constant temperature of 100oC in a round bottom glass flask, maintain under total reflux for 2 hrs. The acquired solution is then transferred in ice bath to produce crystals. A resultant solid product is then further recrystallized by using solvent as ethanol. After the reagent (M.P. 274oC) is synthesized, it is then characterized by NMR and IR spectrum and easily employed in the determination small Cd (II) traces using spectrophotometry extraction. A stock solution of devised ligand in the 0.05% concentration in a methanol is ready for further investigations. The newly devised reagent DBA and Cadmium have strong complex formation tendency due to presence of electron donor nitrogen atom present in the reagent.
Reaction Scheme
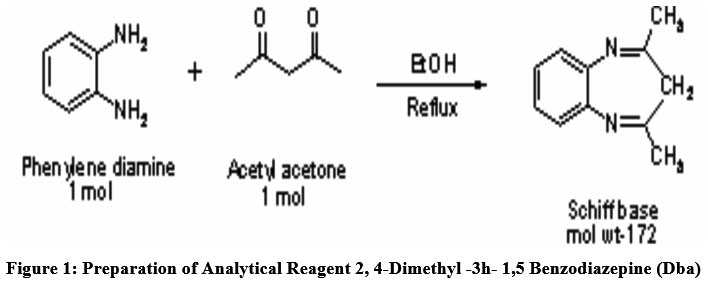 | Figure 1: Preparation of analytical Reagent 2, 4-DIMETHYL -3H- 1,5 BENZODIAZEPINE (DBA)
|
Stock solution
The stock solution of 100 ppm concentration of Cd+2 was ready by adding 0. 2282mg of cadmium sulfate (3 CdSO4, 8 H2O) (Merck) crystals in a 100 ml distilled water. Moreover, additional sets of dilute solutions were made by adopting standard operating procedure.
pH selection for Extraction
In this study, various Buffer solutions with varying pH was used for Cd (II) extraction, and molar ratio between organic and aqueous phase was constantly monitored at 1:1. The impact of pH on the variation of absorbance as indicated in the figure 2. A same figure depicts that the values of absorbance are increasing with rise in pH and attains a highest magnitude at pH 8.9 and further increase in pH beyond the 8.9, the absorbance decline sharply. Hence, the buffer of pH 8.9 was selected in future research work.
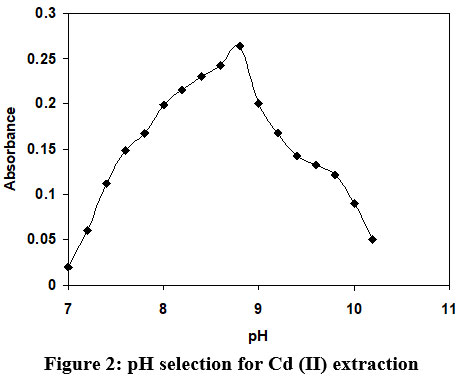 | Figure 2: pH selection for Cd (II) extraction.
|
Solvent selection for extraction
In this laboratory experiments various organic solvents were tested to for right selection of extraction solvent and experimental results achieved to the various solvents are summarized in Figure 3. From presented results, n-butanol was found to be best solvent for extraction of Cd (II).
 | Figure 3: Effect of solvent on Cd (II) extraction.
|
Selection of Wavelength
Fig.4 shows that absorbance increases with increase in wavelength and realizes a highest absorbance at 450 nm wavelength. Further, increase in wavelength, the values of absorbance declines sharply. The magnitude of wavelength corresponds to highest absorbance is suggested for future research work.
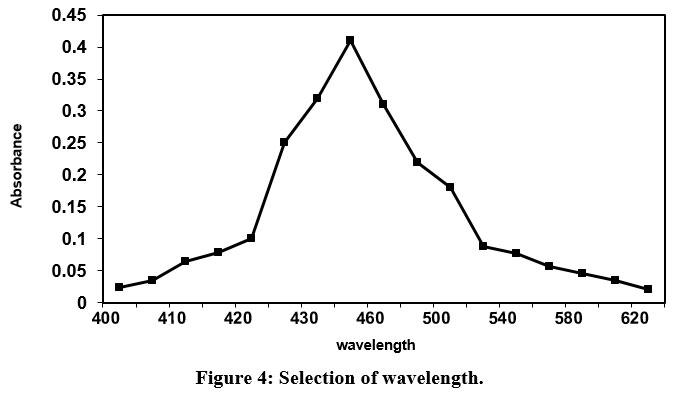 | Figure 4: Selection of wavelength.
|
Method of Experiment
The mixture of 1 cm3 solution of cadmium sulphate with 0.05% DBA novel ligand in methanol was prepared. The solution pH was constantly monitored at 8.9 with slowly addition of buffer solution (A buffer was prepared by mixing 1 mole L-1 of NH4OH with 1.8 mole L-1of NH4Cl). This solution is then subjected to gravity separation in a separating glass funnel with additional of 10 ml n-butanol. Due to effect of gravity the phases are separated in to organic and aqueous phase. Out of these two phases, an organic phase placed under a UV Spectrophotometer at wavelength of 450 nm, to record the absorbance.
Formulation of calibration curve
As discussed above, the similar procedure was followed in the development of calibration curve. The Cd (II) samples of various concentrations (1–10 ppm) were prepared, mixed with the DBA reagent, and extracted with n-butanol. Further, its absorbance measured, and Calibration curve was developed (Fig.5).
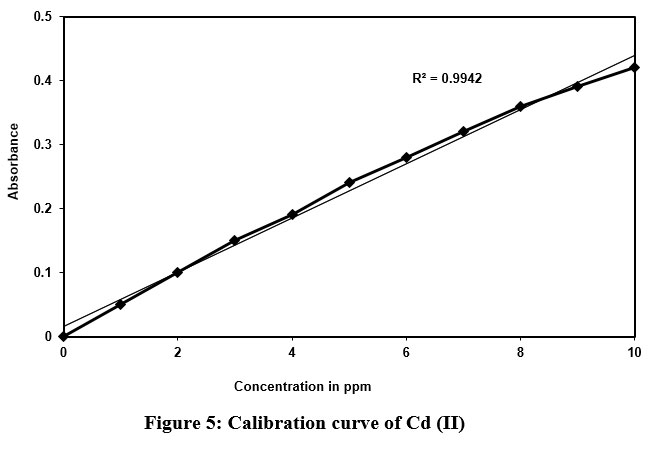 | Figure 5: Calibration curve of Cd (II).
|
Choice of mole ratio of Cd (II) to novel ligand
The perfect selection of molar ratio of Cd (II) to DBA ligand, using different methods has been predicted and presented in Figure 6. The Job’s continuous variation is one of the commonly used methods in most of the cases to fix up the composition ratio between metal ions and analytical reagent. The result achieved from Job’s continuous variation method was further verified using other recommended methods namely slope ration and mole ratio. In this work, appropriate mole ratio of Cd (II) to DBA ligand was fixed to be 1:1.
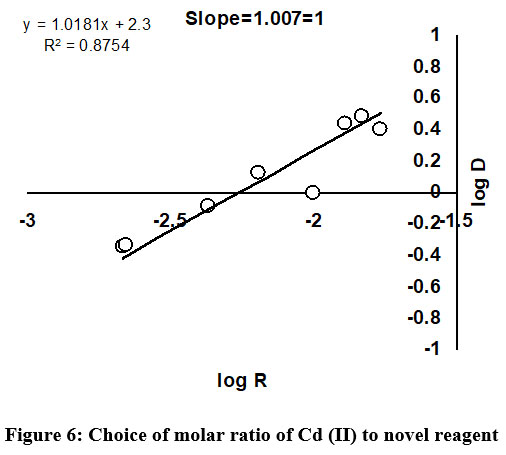 | Figure 6: Choice of molar ratio of Cd (II) to novel reagent.
|
Influence of diverse ions
To validate the potential varied applications of the developed analytical techniques, the impact of various diverse ions are experimentally examined by carrying out determination of 100 µg /mL Cd (II) ions with a small quantity of diverse ion solutions, using the developed experimental methodology. The limits of tolerance between higher value of actual absorbance of given ions and value expected for plain Cd (II) ion was set to be within ±2% discrepancy. The results clearly depicts that utmost of the metal ions can be accepted in considerable set limit of tolerance (Table 3). The interference effects of these ions are suppressed with several agents in the actual determinations of Cd (II), as indicated in the Table 4.
Table 3: Interference of different ions in Cd (II) determination
S. No. | Name of ions | Amount Tolerated in mg |
1 | Chloride, Nitrite, Sulphate, Sulphide | 19 |
2 | Perchlorate | 17 |
3 | Iodate | 15 |
4 | Ti (IV), Cr(II),Mn(II),Sn(II),Pb(II) | 14 |
5 | Mo(VI), Cr(VI) | 11 |
6 | Ammonium, K (I) | 17 |
Table 4: Suppressing reagents.
Interfering Ion | Suppressing reagent |
Zn (II) | Cyanide |
Cr (II) | Ammonia |
Al (II) | Triethanolamine |
Mn (II) | Aluminium fluoride |
Co (II) | Ascorbic acid |
Ni (II) | Conc.HNO3 |
Different analytical reagents for Cd (II) determination and their drawbacks
Table 5 shows the assessment between various analytical reagents used by the previous workers and DBA ligand for the estimation of Cd(II). A present experimental work confirms that the developed DBA reagent seems to be better than that of some reported reagents.
Table 5: Different analytical reagents for Cd (II) determination and their drawbacks
Analytical Reagents | Disadvantages | Reference |
4-(2- thiazolylazo)-resorcinol (TAR) | Interference of Some common metals like Fe(III), Ni(II),Co(II),Cu(II) | [32] |
1,10-phenanthroline | Basic pH in the varying range of 8.2 to 9.6 was used. | [33] |
Thiazolylazochromogenic reagent | solvent is toxic | [34] |
N-hydroxy-N,Ni-diphynylbezamidine | Less pH range is required | [35] |
1-(2- Bezothiazolylaz o)-2-hydroxy-3- naphthoic acid | Oxalate interfere seriously | [36] |
Testing of Precision and Accuracy
The precision of the present method was determined by testing different concentrations of cadmium (each sample was analyzed minimum at least three times). The relative standard was in the limit of 0 – 2% confirms that this method is highly precise and reproducible, the average percentage extraction in tested samples were indicated in Table 5.
The calculation of relative standard deviation is as:

Where Xi sample value, N total numbers of samples

% Relative Standard deviation,
The relative standard deviation is found to be in the limit of 0 to 2 %
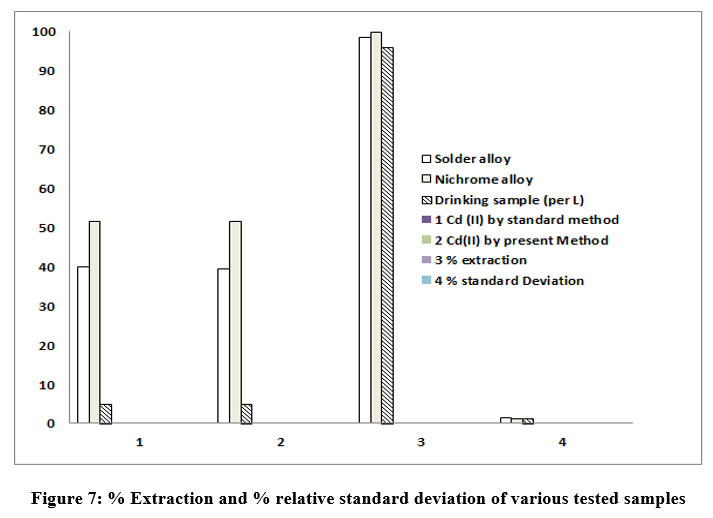
The %extraction and % relative standard deviation
Figure 7 presents the % Extraction and % relative standard deviation with various samples tested. The % extraction was found to be 98.5, 99.7 and 96 % for solder alloy, Nichrome alloy and drinking water samples respectively. Whereas the % standard deviations were observed to be 1.5,1,03 and 1.3 for solder alloy, Nichrome alloy and drinking water samples respectively.
 | Figure 7: % Extraction and % relative standard deviation of various tested samples
|
Applications of present work
The present work demonstrates the development of new fresh analytical ligand for effective and efficient estimation of Cd (II) metal ions from given mixture. This analysis method was employed for estimation of Cd (II) traces in an area like alloy, water treatment, food industries. The newly developed analytical ligand is appears to be best over the other reagents.
Table 6 Applications of present study
Sr. No. | Samples | Cd(II) determined by standard method | Cd(II) determined by present method | % extraction | % standard Deviation |
1 | Solder alloy | 40% | 39.4% | 98.5 | 1.5 |
2 | Nichrome alloy | 51.48% | 51.43% | 99.70 | 1.02 |
3 | Drinking sample (per L) | 0.005 ppm | 0.0048 ppm | 96 | 1.3 |
Conclusion
The present experimental investigations demonstrates that a newly synthesized, fresh analytical reagent was showed to be accurate, cheap, less time consuming for spectrophotometric estimation of Cd(II).
Advantages of the developed method are as follows:-
Reagent is easily synthesized and purified.
The process of extraction is one step, fast and accurate.
It require very low reagent concentration of analytical reagent
The developed method used DBA reagent by maintaining constant pH 8.6 is seems to be better as compared to earlier method of 1,10-phenanthroline analytical reagent with varying pH 8.2 to 9.8
In this developed method most of the ions do not interfere in the extraction process.
This developed method possesses main benefits like simple, single step, fast, accurate and cost effective. Hence, it can be used for estimation of small traces of Cd (II) from the alloy and water effluents.
Acknowledgement
This experimental work carried out by Dr. Sonali S. Patil in the JSM College Alibag of the department of chemistry of. Author would like to pay sincere thanks to the competent authorities of the college; for providing all kinds of support
Conflict of Interests
Authors hereby state that, in this research work any sort of conflict of interest is not involved,
Funding Sources
There is no funding or financial support for this research work.
References
- Clayton GD, Clayton FA. editors. Patty's Industrial Hygiene and Toxicology. John Wiley and Sons, New York. 1981;2A:1563.
- Hammond PB, Robert PB. Metals In: Casarett and Doull's Toxicology. Klassen CD,Amdur MO and Doull J. editors. 3rd ed. Macmillan, New York. 1986; 428.
- Friberg L, Piscator M, Nordberg GF, Kjellstrom T. editors. Cadmium in the Environment. 2nd ed, CRC Press, InC, Cleveland; 1974, American Chemical Science Journal, 4(4): 481-503, 2014 502.
- Taylor MD, Williams RD. Trace Element Medicine and Chelation Therapy. The Royal Society of Chemistry, Cambridge. 1995; 22.
- Key MM, Henschel AF, Butter J, Ligo RN, Tabershaw IR. Editors. Occuptional Diseases-A Guide to Their Recognition, U.S. Dep of Health, Education and Welfare,U. S. Government Printing, Washington, D.C. 1977;265.
- Fergusson JE. The toxicity of heavy elements to human beings In: The Heavy Elements: Chemistry, Environmental Impact and Health Effects, Pergamon Press,Oxford. 1989;548
- Venugopal B. Luckey TD. Metal Toxicity in Mammals-2. Plemum Press, New York.1979; 76.
- Abbasi, S., Khodarahmiyan, K., Abbasi, F., 2011. Simultaneous determination of ultra-trace amounts of lead and cadmium in food samples by adsorptive stripping voltammetry. Food Chemistry 128, 254-257.
- Amin, A.S., 2001. Spectrophotometric determination of cadmium using thiazolylazo chromogenic reagents in the presence of Triton X-100: application in environmental samples. Analalytical Letters. 34:1, 163-176.
- Anuse, M. A., Mote, N. A., Chavan, M. B.,1983. Pyrimidinethiol as a reagent for extraction separation of platinum metals and gold: Determination of Pd(II), Os(VIII) and Ru(III). Talanta 30 :5, 323-327.
- Babula, P., Adam, V., Opatrilova, R., Zehnalek, J., Havel, L., Kizek, R., 2008. Uncommon heavy metals, metalloids and their plant toxicity: a review. Environmental Chemistry Letters 6:4, 189- 213.
- Bulgariu, L., Bulgariu, D., Sarghie, I., 2005. Spectrophotometric determination of cadmium(II) using p,p'- dinitro-sym-diphenylcarbazid in Aqueous solutions. Analytical Letters 38, 2365-2375.
- Cotton, F. A., Wilkinson, G., 1988. Advanced Inorganic Chemistry. fifth edition, John Wiley and Sons, Inc., New York.
- Gao, H. W., Li, Y. C., Zhang, P.F., Tao, M., Wang, L., 2001. Determination of Trace amounts of Cadmium with p-acetyl-benzenediaminoazobenzene by primary- secondary wavelength spectrophotometry. Journal ofAnalytical Chemistry 56 :11, 1007-1010.
- Gopalakrishna, D., Devanna, N., Chandrashekhar, K. B., 2010.Direct and derivative spectrophotometric determination of cadmium(II) in presence of micellar medium in biological materials and in alloy samples using cinnamaldehyde-4-hydroxy benzoylhydrazone(CMHBH). International Journal of Pharmaand Biosciences 1:3, 1-19.
- Hashem, E. Y., 2002. Spectrophotometric studies on the simultaneous determination of cadmium and mercurywith 4-(2-pyridylazo)-resorcinol. Spectrochimica Acta Part A 58, 1401-1410.
- Hussain, M. F., Sangahi, A. K., Puri, B. K., 2002. N-methylethylxanthocarbamate as an analytical reagent:differential pulse polarographic determination of cadmium in standard alloys,biological and environmental samples after adsorption of its complex on microcrystalline naphthalene. Journal of Analytical Chemistry 57:8, 724-729.
- Jahromi, E. Z., Bidari, A., Assadi, Y., Hosseini, M. R. M., Jamali, M. R., 2007. Dispersive liquid-liquid microextraction combined with graphite furnace atomic absorption spectrometry: ultra trace determination of cadmium in water samples. Analytica Chimica Acta 585, 305-311.
- Jia, X., Han, Y., Liu, X., Duan, T., Chen, H., 2010. Dispersive liquid-liquid microextraction combined with flow injection inductively coupled plasma mass spectrometry for simultaneous determination of cadmium,lead and bismuth in water samples. Microchimica Acta 171, 49-56.Job P. 1928. Formation and stability of inorganic complexes in solution. Annales de Chim 9, 113-203.
- [Kamble, G. S., Kolekar, S.S., Han, S. H., Anuse, M.A., 2010. Synergistic liquid– liquid extractive Mathes, R. A., Steward, F. D., Swedish, F., 1948. A Synthesis of 2-pyrimidinethiols Journal of American Chemical Society 70, 1452-1453.
- Meng, S., Jing, B., Fan, Y., Liu, Y., Guo, Y., 2011. Spectrophotometric determination of trace cadmium in vegetables with 3.5-bis(4-phenylazophenylaminodiazo) Benzoic acid. Journal of Analytical Chemistry 66:1, 31-36.
- Morrison, G. H., Freiser, H.,1996. Solvent Extraction in Analytical Chemistry, John Willey and Sons, Inc. New York.
- Ni, Y., 1998. Simultaneous determination of copper, cadmium and nickel by ratio derivative polarography. Talanta 47, 137-142.
- Parikh, K.S., Patel, R. M., Patel, K. N., 2009. New spectrophotometric method for determination of cadmium. E-Journal of Chemistry 6:S1, S496-S500.
- Prasad, K., Gopikrishna, P., Rao, T. P., Naidu, G. R. K., 2006. Solid phase extraction vis-à-vis coprecipitation preconcentration of cadmium and lead from soils onto 5, 7-dibromoquinoline-8-ol embedded benzophenone and determination by FAAS. Talanta 69, 938-945.
- Salahinejad, M., 2011. Optimization and determination of Cd(II) in different environmental water samples with dispersive liquid-liquid microextraction preconcentration combined with inductively coupled plasma optical emission spectrometry Environ Monitoring and Assessment 177, 115-125.
- Sandell, E. B., 1965. Colorimetric determination of traces of metals, third ed. Interscience Publ, New York,Vogel, A. I., 1975. A Text Book of Quantative Inorganic Analysis, Longmans,third ed. London.
- Wen, X., Deng, X., Guo, J., Yang, S., 2011. Ultra-sensitive determination of cadmium in rice and water by UV-vis spectrophotometry after after single drop microextraction. Spectrochimica Acta Part A 79, 508-512.
- Xiang, G., Wen, S., Wu, X., Jiang, X., He, L., Liu, Y., 2012. Selective cloud point extraction for the determination of cadmium in food samples by flame atomic absorption spectrometry. Food Chemistry 132, 532-536.
- Yoe, J. A, Jones, A. L., 1944. Industrial and Engineering Chemistry of Analytical Edition. 16, 11.
- Zhang, P. F., Gao, H. W., Li, Y., 1998. Synthesis of amido black diazoaminoazobenzene and its application to the spectrophotometric determination of micrograms of cadmium. Talanta 47, 355-359.
- Anita A. Ghare, Ganesh S. Kamble, Mansing A. Anuse, Sanjay S. Kolekar Development and Optimization of Analytical Method for Synergistic Extraction and Spectrophotometric Determination of Cadmium(II) by using 1-(2’,4’- dinitroaminophenyl)-4,4,6- trimethyl-1,4-dihydropyrimidine-2-thiol: Analysis of Alloys, Thin Film and Biological Material / Journal of Trace Element Analysis (2013) Vol. 2 No. 1 pp. 1-20.
- EtsuYamada, Tooru Kuwamoto Taitiro Fujinaga Eiichiro Nakayama,Extraction spectrophotometric determination of cadmium with diphenylcarbazone in the presence of 1,10-phenanthroline Analytica Chimica Acta Volume 138, 1 June 1982, Pages 409-412.
- Alaa Sayed Amin, Spectrophotometric determination of cadmium using thiazolylazo chromogenic reagents in the presence of Triton X-100: Application in environmental samples February 2007 Analytical Letters 34(1)(1):163-176.
- Extraction-Spectrophotometric Determination of Cadmium with N-Hydroxy-N, N?-diphenylbenzamidine and 4-(2-Pyridylazo)resorcinol Sumon CHAKRAVARTY, Rajendra Kumar MISHRA Analytical Sciences volume 8, pages609–612 (1992).
- Amin, A. S., Gouda, A. A., 2012. Utility of solid phase spectrophotomery for the modified determination of trace amounts of cadmium in food samples. Food Chemistry 132, 518-524.
Appendix I
The characterization of developed reagent (DBA) was successfully done using mass spectrophotometer and IR, NMR. The brief analysis is elaborated in this section.
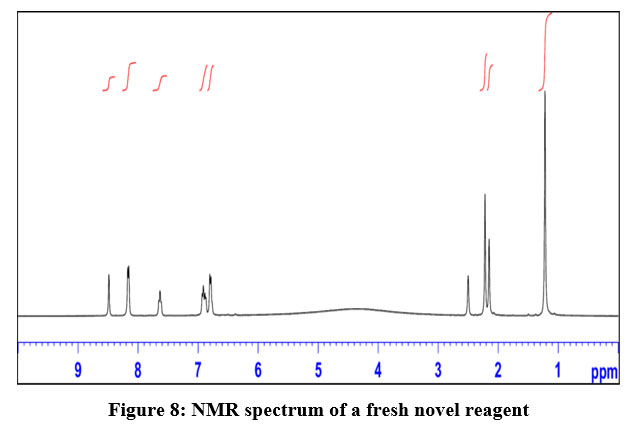
I.1 A structure determination using NMR spectra is as under:
Table 1: A structure determination of DBA reagent using NMR technique
Delta values in ppm | observation | Remark |
1.1 | Presence of methyl group | Length of peak corresponds to 6 protons indicates two methyl group present in the same environment |
2.1 | Presence of methylene group | Length of peak corresponds to 2 protons |
6.9 to 8.6 | Presence of Aromatic protons | Two aromatic protons observed slightly downfield due to effect of nitrogen |
The spectrum obtained as indicated in Fig.8
 | Figure 8: NMR spectrum of a fresh novel reagent
|
The structure determination using IR spectra is presented as under:
IR- peak at 3000 cm -1 indicates the presence o-tertiary amines as presented in Fig.9
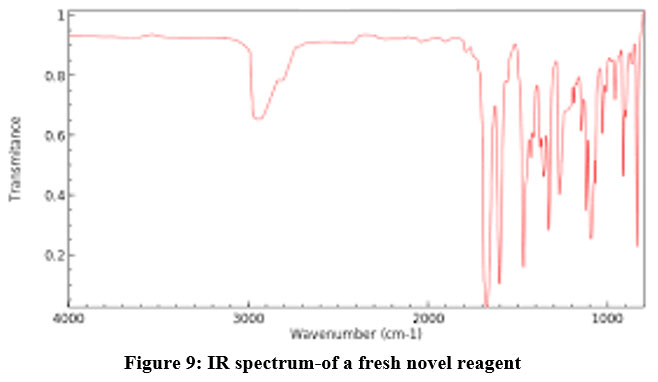 | Figure 9: IR spectrum-of a fresh novel reagent.
|


