The Spatial and Temporal Disparity of Fish Assemblage and its Association with Environmental Factors Through Multivariate Statistical Analysis in Jammu and Kashmir's Himalayan River System.
Chakshu Gupta
*
 , Seema Langer
and Suneha Uttam
, Seema Langer
and Suneha Uttam
1
Department of Zoology,
University of Jammu,
Jammu and Kashmir
India
http://dx.doi.org/10.12944/CWE.17.3.13
Copy the following to cite this article:
Gupta C, Langer S, Uttam S. The Spatial and Temporal Disparity of Fish Assemblage and its Association with Environmental Factors through Multivariate Statistical Analysis in Jammu and Kashmir's Himalayan River System. Curr World Environ 2022;17(3). DOI:http://dx.doi.org/10.12944/CWE.17.3.13
Copy the following to cite this URL:
Gupta C, Langer S, Uttam S. The Spatial and Temporal Disparity of Fish Assemblage and its Association with Environmental Factors through Multivariate Statistical Analysis in Jammu and Kashmir's Himalayan River System. Curr World Environ 2022;17(3).
Download article (pdf) Citation Manager Publish History

Introduction
The fisheries sector has long been a vital part of the Indian economy, contributing to food and nutrition security, job creation, and foreign exchange earnings through fish export. So far 3,231 species of native finfish have been recorded from India, of which 2,443 species are from the marine environment, 113 from brackish waters and 877 are from freshwater habitats along with 291 exotic fish species.1,2
The rich biological legacy, biodiversity, and productivity potential of India's inland water resources are well known. Research is being conducted globally to establish systematic conservation planning to maintain freshwater biodiversity3,4,5 since aquatic ecosystems face major risks to both biodiversity and ecosystem stability. As a result, different techniques, tactics, and priorities have been put forth.6,7,8 Kottelat and Whitten9 listed pollution, increased sedimentation, stream fluctuation, water diversion, and exotic species as the primary causes of decreased ichthyofaunal diversity in Asian countries. Also to feed the ever-growing population, significant development and improvement of aquaculture need to be given priority.
Jammu province's rivers originate in the middle and outer Himalayas and travel considerable distances before reaching the plains of this region. As a result, the riverine system in this area has a lot of longitudinal stratification, which means there are a lot of different habitats for the fish fauna that live there. 10,11,12,13,14,15
The quantity and types of fish species in the river system vary with the diversity of environments. Food, spawning places, water quality, substrates, and flows within a river system all contribute to habitat variability and vary depending on where the river and its tributaries run. The interrelationship between fishes and their surrounding environment has a crucial part in the management and conservation of riverine fish species where any alteration in it causes a transformation in their population.16 The distribution and composition of fishes in freshwater and marine ecosystems have been influenced by the concentration of environmental factors particularly water quality indices.17,18,19 To determine the assortment status of aquatic residents, biodiversity measures such as dominance, evenness, Margalef, and H' diversity indices were utilised as pointers.20,21 This study aims to 1) explain the spatial and temporal fluctuation of fish assemblage and 2) determine the relationship between environmental parameters and fish grouping in the Himalayan River System's Ravi and Chenab Rivers.
Materials and methods
Study Area
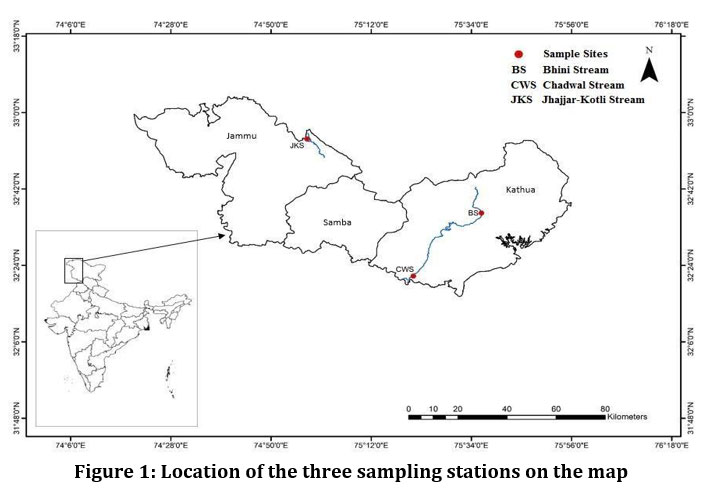
The present study was done on two of the rivers of the Himalayan River System- River Ravi and River Chenab from July 2020 to June 2021. The River Chenab originates from the Himalayas in the Lahaul and Spiti districts of Himachal Pradesh in India and courses through the Jammu region of J&K UT. River Ravi originates in the Himalayas in the Chamba district of Himachal Pradesh and flows North-westerly along the Indo-Pak border joining the Chenab River. The sampling stations for the present study were selected due to their spatial and temporal disparity. Two sampling stations (Bhini and Chadwal) were chosen from River Ravi and one from River Chenab (Jhajjar).
The Bhini stream (32.36°N, 75.36°E) is one of the tributaries of the River Ravi in the Kathua district in J&K. It is a perennial, rain and snow-fed stream that flows in the Shivalik Hills of the Outer Himalayas. The Chadwal stream (32.22oN, 75.20oE) is another tributary of River Ravi flowing in the middle Himalayan range with precipitation as the major source of water in the stream.
 | Figure 1: Location of the three sampling stations on the map.
|
The Jhajjar stream (32.53oN,74.57oE) is a perennial, snow-fed tributary of River Chenab and is situated in the village Jhajjar-Kotli (Lesser Himalayas) in Jammu District in J&K.
Field surveys and laboratory analyses
Fish, as well as water samples, were taken from all three streams for the analysis of physicochemical parameters, habitat structure and fish diversity during the study period from July 2020 to June 2021 (monsoon (June-September), post-monsoon (October-January) and pre-monsoon (February-May)). Gill and cast nets were used for the collection of fish specimens during the study months. The total number of species and specimens collected were counted and the specimens were preserved in 10% formalin. The samples brought back to the laboratory were identified using available literature.22,23,24
The water samples were collected in glass bottles and on-site analysis was done for pH, dissolved oxygen (DO), air and water temperature, depth, transparency and velocity of the stream. Temperatures were measured using a mercury bulb thermometer. pH was measured using a digital pH metre (Testo 206-pH1). For DO measurement, oxygen was first fixed by using the method recommended by APHA.25 Further analysis was carried out in the laboratory. The depth of the streams was measured using metre rods and measuring tape while transparency was measured using a Secchi disc. The velocity of the water current was measured using a portable water flow metre. Substrate coverage was estimated using a quadrat of 50 squares of 4 X 4cm each and the elevation of sampling stations was measured using GPS. For other parameters (FCO2, alkalinity, HCO3-, CO32-, hardness, Ca2+, Mg2+, Cl-), samples were brought to the laboratory and assessment was done using the Standard methods of APHA.25
The ichthyofaunal diversity was studied using the following indices:
1. Simpson’s diversity index26:
D = E (n/N)2
where N = total organisms of all species and
n = all the organisms of a particular species.
2. Shannon-Wiener diversity index27 :
H'= - E (Pi)(log Pi)
where Pi = Ni/N is the percentage of individuals of species i.
3. Margalef richness index28 :
d = (S-1)/lnN
where N is the total individuals in the sample and S is the number of species.
4. Pielou’s evenness index29:
J = H'/ln(S)
where S is the total species in a sample and H' is the Shannon Weiner index.
Data Analysis
To determine any difference between sampling sites, ANOVA or one-way analysis of variance was employed for habitat (depth, transparency, air temperature, rocks, sand, silt, and plant cover) and hydrological variables (water temperature, DO, alkalinity, pH, hardness, and Cl-). The means which differed substantially at a 0.05 level of probability were identified using a post hoc Tukey HSD test.30
The relationship between environmental variables and sampling stations was investigated using Principal Component Analysis (PCA). All physicochemical variables, habitat structure, and elevation were analysed using the PCA method.
Canonical Correspondence Analysis (CCA) was utilized for determining the association between environmental variables and the structure of fish communities. The PC1, PC2, and PC3 scores of environmental factors were utilised to describe the CCA axes. The variables with correlation coefficients less than 0.60 and statistical significance greater than 0.05 were used. The data of the most numerous species with presence in two or more sample points were used for the CCA, to show the contribution of abundant species in this study. Rare species were considered as those caught on a single occasion or in a single place for this investigation.31
To investigate if there are any significant differences between the fish assemblages detected by the CCA, a one-way analysis of similarity (ANOSIM) using fish abundances of the selected groups was used.32 To determine the proportion of similarity among sampling stations, a similarity percentages analysis32 (SIMPER) was used. This methodology also approximated the percentage of major contributing species for all of the sampling stations.
Cluster analysis using the Bray-Curtis metric and the unweighted pair-group technique with the arithmetic mean (UPGMA) was used to evaluate the similarity between the sampling stations using environmental parameters and fish species abundance. PAST (v 4.03) and SPSS (v 16) software were used for carrying out all these analyses.
The link between environmental variables and fish species richness was studied using multiple regression analysis (Minitab v.20.3.0). The environmental variable having a limited effect on richness was excluded in each step of regression analysis as shown by the greatest p-value. The analysis was done until environmental variables with p ? 0.05 and related to the fish variables remained.
Results
Environmental Parameters
Data summarising the mean values of physicochemical parameters of water, habitat structure and elevation for all three sites are given in Table 1. Statistically significant differences for FCO2 and HCO3- (H= 7.2, p<0.05) and habitat parameters (rocks, sand, silt and plants) (H=10.47,p<0.05) were revealed by the Kruskal-Wallis ANOVA test for the three sampling sites.
The ANOVA test revealed significant differences (H=3.85, p<0.05) in the mean values of FCO2, alkalinity and Mg2+ between the Bhini and Jhajjar streams while pH, DO, FCO2, alkalinity, Cl- showed significant differences (H=3.85, p<0.05) between Bhini and Chadwal streams. Between Jhajjar and Chadwal streams, significant differences (H=3.85,p<0.05) were revealed in the values of pH, DO, FCO2, alkalinity and depth.
Table 1: Mean values of environmental variables of the sampling stations from June 2020 to May 2021 (Monsoon 2020-Pre-monsoon 2021).
Parameter | Bhini Stream | Jhajjar Stream | Chadwal Stream |
Air temperature(°C) | 32-27.7 | 29-25.8 | 37-28 |
Water temperature(°C) | 25-20.6 | 15-13 | 25-14 |
Depth(feet) | 8.2-4.7 | 18-11 | 7.4-4.2 |
Transparency(cm) | 12-42 | 4-55 | 6-32 |
pH | 8-8.1 | 8.3-8.2 | 7.6-7.4 |
DO(mg/L) | 8.3-8.1 | 8.6-8.1 | 5.4-5 |
FCO2(mg/L) | 4.6-4.5 | 0 | 2.1-1.4 |
HCO3-(mg/L) | 352-279 | 59.6-93.6 | 386.2-430 |
CO32-(mg/L) | 15-12.4 | 2.9-2.4 | 11-8.6 |
Ca2+(mg/L) | 21.3-18.7 | 20.9-19.4 | 12-16.1 |
Mg2+(mg/L) | 12.7-9.4 | 5.2-5.4 | 6-7.2 |
Cl-(mg/L) | 4.8-7.2 | 8-9.8 | 10.8-15.2 |
Water velocity (ms-1) | 1.9-1.7 | 1.3-1.1 | 0.8-0.6 |
Rocks (%) | 35-75 | 25-65 | 5-20 |
Sand (%) | 15-10 | 15-15 | 25-40 |
Silt (%) | 45-10 | 50-15 | 55-35 |
Plants (%) | 5-5 | 10-15 | 15-15 |
Fish species distribution and abundance
A total of 583 individuals were collected from the Bhini (29.5%), Jhajjar (36.1%), and Chadwal (34.3%) streams, representing 4 orders, 12 families, 22 genera, and 30 species (Table 2). The best-represented order was Cypriniformes with 4 families and 22 species. It was followed by the order Siluriformes with 4 families and 4 species and the order Perciformes with 3 families and 3 species. The order Beloniformes were represented by 1 species.
Table 2: Diversity and abundance of the fish species collected from the three study stations: Bhini stream (BS), Jhajjar stream (JS) and Chadwal stream (CS).
Order | Family | Species | Sampling stations | Abundance |
|---|---|---|---|---|
Cypriniformes |
Cyprinidae
| Barilius vagra | BS, JS and CS | 43 |
Puntius conchonius | BS | 45 | ||
Labeo dero | BS, JS and CS | 15 | ||
Tor tor | BS, JS and CS | 12 | ||
Crossocheilus latius | BS | 9 | ||
Osteobrama cotio | BS | 13 | ||
Rasbora rasbora | BS | 16 | ||
Chela bacaila | BS and CS | 41 | ||
Barilius bendelisis | JS and CS | 48 | ||
Garra gotyla | JS and CS | 28 | ||
Tor putitora | JS and CS | 31 | ||
Crossocheilus diplochelius | JS | 22 | ||
Puntius sophore | JS and CS | 34 | ||
Puntius ticto | JS and CS | 29 | ||
Puntius sarana | CS | 4 | ||
Cirrhinus mrigala | CS | 11 | ||
Cirrhinus reba | CS | 8 | ||
Labeo rohita | CS | 16 | ||
Nemacheilidae | Acanthocobitis botia | BS, JS and CS | 40 | |
Schistura denisonii | BS | 2 | ||
Danionidae | Danio devario | BS | 20 | |
Cobitidae | Lepidocephalichthys guntea | BS | 23 | |
Siluriformes
| Amblycipitidae | Amblyceps mangois | JS | 7 |
Sisoridae | Glyptothorax pectinopterus | JS | 19 | |
Bagridae | Mystus seenghala | JS | 4 | |
Siluridae | Wallago attu | JS | 3 | |
Perciformes
| Badidae | Badis badis | BS | 5 |
Channidae | Channa punctatus | JS and CS | 12 | |
Mastacembelidae | Mastacembelus armatus | CS | 5 | |
Beloniformes | Belonidae | Xenentodon cancila | JS and CS | 18 |
Diversity indices for fish
The values of diversity indices at all three sites were calculated for both stations and seasons (pre-monsoon, monsoon and post-monsoon). The H' index in biological communities ranges from 0 to 5 with values less than one indicating extremely contaminated conditions, values in the range of one to two indicating moderately polluted conditions, and values above three indicating stable environmental conditions.31,32 The value of the H' index was found to be the highest at the Chadwal stream (2.749) during the post-monsoon season (Oct-Jan) and the lowest at the Bhini stream (2.38) during the monsoon season (June-Sept). The evenness index was highest at the Jhajjar stream (0.9377) and lowest at the Chadwal stream (0.8678). The values for the evenness index were higher during the pre-monsoon season (Feb-May) (0.936) while they were found to be lower during the monsoon season (June-Sept) (0.8457). The Margalef index has no limit value and it shows a variation depending upon the number of species. Margalef richness values were highest at the Chadwal stream (3.136) during the pre-monsoon season (Feb-May) and lowest at the Bhini stream (2.086) during the post-monsoon season (Oct-Jan). The Simpson index typically ranges from 0 to 1 where communities that are mature and stable have a high diversity value from 0.6 to 0.9, whereas communities that are under stress and have little diversity have a value that is close to zero.33 The Simpson diversity index was highest for the Jhajjar stream (0.93) during the post-monsoon season (Oct-Jan) and lowest for the Bhini stream (0.8981) during the post-monsoon season (Oct-Jan).
Data Analysis
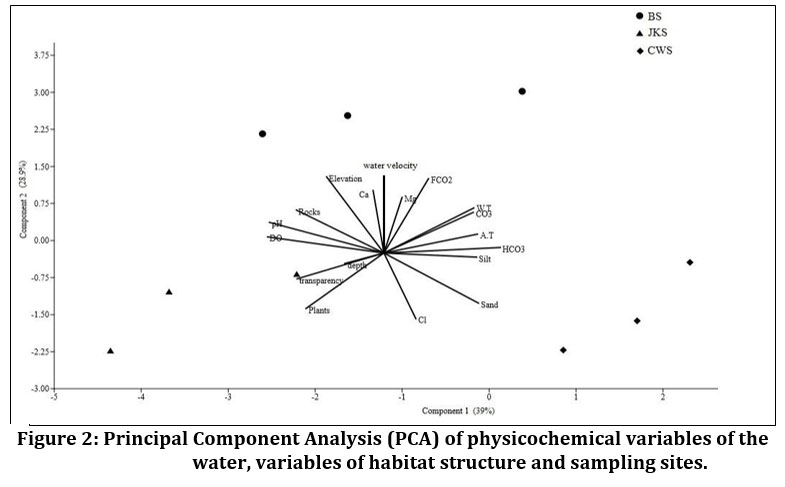
PCA identified three probable groups responsible for the data structure, with each group accounting for 86.3% of the total variance (Table 3; Fig 2). This enabled the grouping of the specified factors based on common characteristics, as well as accessing the incidence of each group on overall fish population variance. PC1 explained 39% of the total variation, with substantial positive correlation values for group 1 variables (air and water temperature, alkalinity, pH, DO, rocks, sand, and silt). PC2 accounted for 28.9% of the variation, and the second component (FCO2, hardness, Cl-, plant cover, and elevation) had a positive connection with the first. With 18.4% of the variance, PC3 containing group 3 components (depth and water velocity) demonstrated positive loading points.
 | Figure 2: Principal Component Analysis (PCA) of physicochemical variables of the water, variables of habitat structure and sampling sites.
|
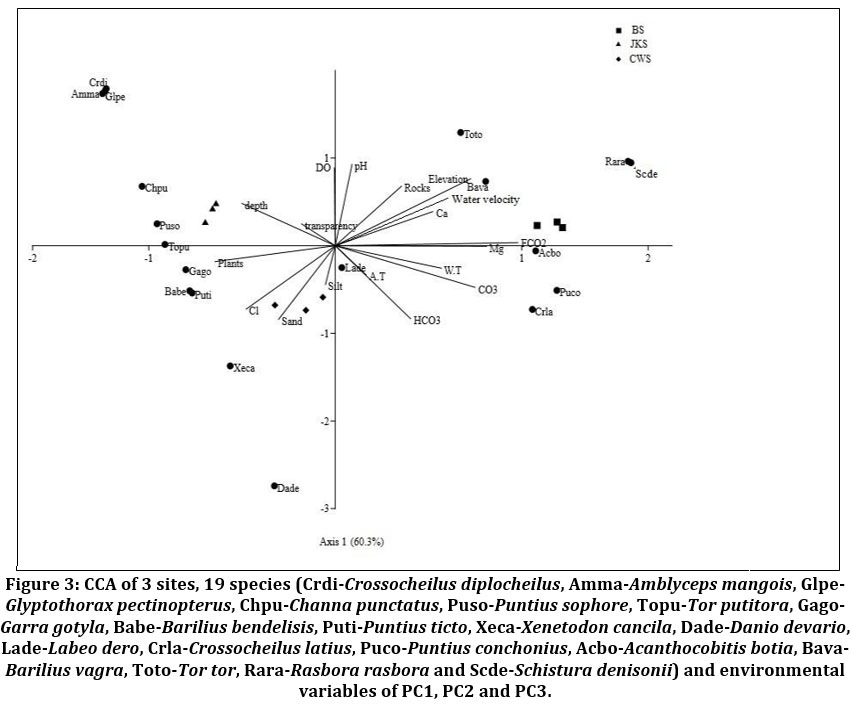
Eleven species were identified as rare based on fish occurrence data, hence 19 species were utilised for CCA. Axes 1 and 2 explained 89.6% of the variability in the species-environment biplot, according to the CCA (Fig 3). The eigenvalues for axis 1 and 2 were 0.52 and 0.25, respectively, while the inertia (%) values were 60.3% and 29.6%.
Table 3: Principal Components Analysis (PCA) results displaying the environmental variable loadings on the first four principal components (Eigenvalue > 1 and correlation coefficient > 0.60) and the % of total variance explained by these components.
| PC1 | PC2 | PC3 |
|---|---|---|---|
A.T | 0.721 | - | - |
W.T | 0.6930 | - | - |
Depth | - | - | -0.9066 |
Transparency | -0.6690 | - | - |
pH | -0.8824 | - | - |
DO | -0.8965 | - | - |
FCO2 | - | 0.8682 | - |
HCO3- | 0.8975 | - | - |
CO32- | 0.6892 | - | - |
Ca2+ | - | 0.7305 | - |
Mg2+ | - | 0.6484 | - |
Cl- | - | -0.7662 | - |
Water velocity | - | - | -0.7534 |
Rocks | -0.6740 | - | - |
Sand | 0.7292 | - | - |
Silt | 0.7145 | - | - |
Plants | - | -0.6477 | - |
Elevation | - | 0.8892 | - |
FCO2, CO32-, Mg2+, plants, and elevation all influenced Axis 1 in the species-environment relationship, accounting for 60.3% of the variance. The second axis accounted for 29.6% variance with pH, DO, HCO3- and Cl-being the most significant contributors. The Bhini stream demonstrated a positive association with pH, DO, FCO2, hardness, water velocity and elevation. Barilius vagra, Tor tor, Acanthocobitis botia, Rasbora rasbora, and Schistura denisonii were among the species linked to these factors. Depth, transparency, DO, water velocity and plants all had a positive association in the Jhajjar stream. Tor putitora, Crossocheilus diplochelius, Amblyceps mangois, Glyptothorax pectinopterus, Channa punctatus, and Puntius sophore were linked to these factors. Air temperature, HCO3-, Cl-, sand, and silt were shown to have a positive correlation with the Chadwal stream and species such as Danio devario, Xenentodon cancila, Labeo dero, Puntius ticto, Garra gotyla, and Barilius bendelisis were associated with these factors.
ANOSIM revealed substantial variations in species composition among the three sampling locations (R=0.89, p=0.04); the R-value is quite high, indicating that a very small degree of overlap separated the sampling sites. ANOSIM also showed no significant changes in fish assemblage across seasons (R = -0.16, p= 0.74). So fish assemblage structure differed significantly at the spatial scale but not the temporal scale, according to an analysis of similarities (ANOSIM). According to the SIMPER study, there is an 85% difference between Bhini and Jhajjar stations, a 61% difference between Bhini and Chadwal and a 76% difference between Jhajjar and Chadwal. Acanthocobitis botia, Lepidocephalichthys guntea, Puntius conchonius, P. ticto and P. sophore are the main contributors to the dissimilarity between Bhini and Jhajjar stations. P. conchonius, Danio devario, A. botia, Tor tor, and Rasbora rasbora are the main contributors to the dissimilarity between Bhini and Chadwal stations. D. devario, Crossocheilus diplochelius, Xenentodon cancila, P. conchonius, and Glyptothorax pectinopterus are the main contributors to the dissimilarity between Jhajjar and Chadwal stations. As per SIMPER analysis, cold water fishes dominated the Bhini stream, catfish species along with a few hill stream fishes were found in the Jhajjar stream while the Chadwal stream contained an assortment of different fish species.
Figure 3: CCA of 3 sites, 19 species (Crdi-Crossocheilus diplocheilus, Amma-Amblyceps mangois, Glpe-Glyptothorax pectinopterus, Chpu-Channa punctatus, Puso-Puntius sophore, Topu-Tor putitora, Gago-Garra gotyla, Babe-Barilius bendelisis, Puti-Puntius ticto, Xeca-Xenetodon cancila, Dade-Danio devario, Lade-Labeo dero, Crla-Crossocheilus latius, Puco-Puntius conchonius, Acbo-Acanthocobitis botia, Bava-Barilius vagra, Toto-Tor tor, Rara-Rasbora rasbora and Scde-Schistura denisonii) and environmental variables of PC1, PC2 and PC3.
 | Figure 3: CCA of 3 sites, 19 species (Crdi-Crossocheilus diplocheilus, Amma-Amblyceps mangois, Glpe-Glyptothorax pectinopterus, Chpu-Channa punctatus, Puso-Puntius sophore, Topu-Tor putitora, Gago-Garra gotyla, Babe-Barilius bendelisis, Puti-Puntius ticto, Xeca-Xenetodon cancila, Dade-Danio devario, Lade-Labeo dero, Crla-Crossocheilus latius,
|
Changes in species richness were found to be related to FCO2, Ca2+, Cl- and elevation. The effect of these four factors on species richness is depicted in the graphs (Fig 4). The results of the regression analysis showed that species richness was inversely related with FCO2 (adj R2 = 0.656, p=0.005), Ca2+( adj R2 = 0.464, p=0.026) and elevation (adj R2 = 0.617, p= 0.007). As per regression analysis, a rise in FCO2, Ca2+, and elevation resulted in a decline in the species richness. The species richness showed a positive and direct correlation with Cl- (adj R2 = 0.488, p=0.022) as per regression analysis indicating species richness increases with an increase in the level of Cl-.
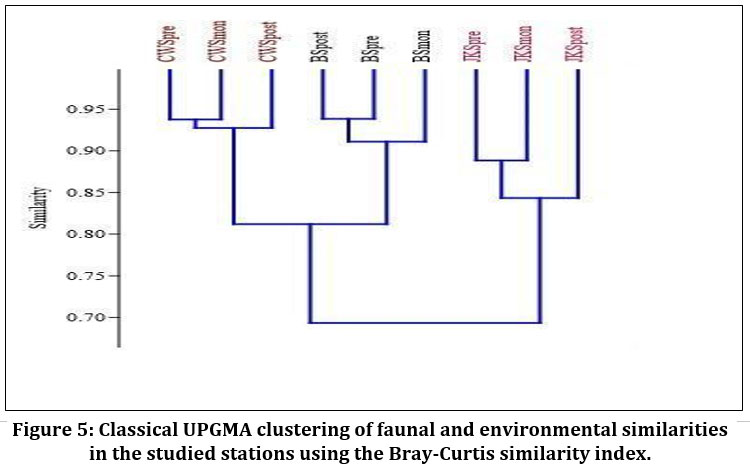
Cluster analysis based on environmental and faunal similarities of sampling stations using Bray-Curtis distance and UPGMA algorithm yielded two groups at the similarity level of 70% separation: the first cluster consisting of Bhini and Chadwal stream and the second cluster having Jhajjar stream (Fig 5). In the 1st cluster at an 80% similarity level, the Bhini stream is pooled independently from the Chadwal stream. The Bhini stream has its pre and post-monsoon seasons clustered separately from the monsoon season while the Chadwal and Jhajjar streams have their pre-monsoon and monsoon season clubbed independently from their post-monsoon season.
 | Figure 4: Equations of linear regression for species richness (a), FCO2 (b) Ca2+ (c) Cl- (d) Elevation.
|
 | Figure 5: Classical UPGMA clustering of faunal and environmental similarities in the studied stations using the Bray-Curtis similarity index.
|
Discussion
The biodiversity of an aquatic stream was influenced strongly by the water chemistry and habitat quality.37 Variations in the FCO2 and alkalinity level among the three sampling stations showed more impact on the spatial distribution of fish species at the Jhajjar stream as compared to the Bhini and Chadwal streams. The maximum level of fish abundance was detected from this stream as the low levels of FCO2 and alkalinity encouraged the rapid photosynthetic activity of phytoplankton leading to enhanced primary productivity.38 Changes in physicochemical parameters such as DO, pH, transparency, temperature, depth and alkalinity have an impact on the individuality of the aquatic environment and fish rearing39,40, abundance and allocation41, dispersal and relocation42, and fish viability43 affecting fish assemblage and structure. The habitat and hydrological parameters of the three streams showed differences (p<0.05) which were significant and similar to the findings of Grimaldo.44
Biodiversity indices aim to describe the diversity of a population or sample by using a single number.20 Two factors contribute to species diversity: the number or richness of species and the distribution of organisms within each species. However, the formal application of the concept and its evaluation were complicated.45 The Evenness and Dominance indices considered the sample size and the percentage of common species while the Shannon-Wiener index explored the abundance and percentage of each species. Any differences in these diversity indices were found to be related to a number of factors, including a) seasonal fluctuations in nutrients in seagrass beds had an impact on the cohabitation of several fish species, as Huh and Kitting46 predicted, b) environmental conditions and atmospheric air flow47, and c) seasonal fish migration.48 The pre- and post-monsoon seasons which were considered dry months showed the highest diversity values as low water levels due to evaporation resulted in concentrated levels of nutrients. During this season, a diverse microalgae population resulted in great variability of food for fish species. Furthermore, during the monsoon season lower species diversity could be due to nutrient dilution by the large influx of water from catchment areas. The Shannon-Wiener index indicated that moderately polluted conditions dwelled in the three study stations, particularly the Chadwal stream where the high H' value could be attributed to large anthropogenic pressures. Presently, the H' index demonstrated a direct correlation with evenness (r = 0.95, p< 0.05) and supports the results shown by Nair.49 Fish breeding during the monsoon season adds new individuals to the stock resulting in an increase in the evenness during the pre-monsoon season. The study stations used had stable communities with low-stress conditions as indicated by the Simpson index. The Simpson index was found to be highly correlative with the Shannon-Wiener index (r = 0.98, p< 0.05) in the present work.50 Since fishing ground in the Chadwal stream was rather large and offered a diversity of microhabitats and resources to the fish species, a high Margalef richness index in this stream indicated the presence of a significant number of species. The Margalef index exhibited a positive and direct correlation with the H' index (r =0.93) emphasizing the relation between species diversity and the dominance diversity in a natural community.49 Diversity indices thus exhibited a spatial variation with high diversity at Chadwal due to a stable and less contaminated stream ecosystem while pre and post-monsoon months showed high diversity leading to temporal variation in the fish assemblage.
The use of multivariate analysis was sufficient for analysing changes in fish communities and the environmental characteristics associated with them. In this work, PCA analysis of environmental parameters as statistical variables revealed the importance of these parameters in affecting the water quality of the three study sites. This could be owed to the importance of environmental variables in determining water quality and related parameters since PC1 accounted for 39% of the variance with substantial positive loadings on Group 1 variables. Zhou’s 51 findings were comparable with these results and corroborated our findings. Air temperature, water temperature, alkalinity, pH, DO, rocks, sand, and silt made up 28.9% of PC2 variables, and these variations in the water were assumed to be related to anthropogenic interferences. Chemical factors and water velocity had a favourable link with Barilius vagra, Tor tor, Acanthocobitis botia, Rasbora rasbora, and Schistura denisoni in the Bhini stream. These hardy, hill stream species needed a higher pH and DO, as well as a shallow and fast-flowing water current, to survive. Tor putitora, Crossocheilus diplochelius, Amblyceps mangois, Glyptothorax pectinopterus, Channa punctatus, and Puntius sophore preferred a clear, deep water stream with higher DO and lower FCO2 which was available to them at the Jhajjar stream. Danio devario, Xenentodon cancila, Labeo dero, Puntius ticto, Garra gotyla, and Barilius bendelisis were alkalinity tolerant but they needed more sand and silt in the substratum to grow which was available in the Chadwal stream. Because various species had distinct environmental requirements, they responded to changes in these variables in different ways leading to spatial and temporal disparity. Our findings were in line with those of Liu52 and Agostinho53, who found that fish assemblage structure changed spatially and was influenced by fluctuations in environmental parameters.
Cluster analysis indicated two major groups in fish assemblage showing a 70% similarity with each other. In general, samples from Group 1 maintained a similarity with Group 2. The Bhini and Chadwal stations showed some similarity as they were situated close to each other and had roughly similar environmental parameters whereas the Jhajjar stream showed quite a dissimilarity with these streams as it was located farther with varied environmental conditions. Although their amount of contribution varied, the major contributing species in the three streams were more or less comparable. The main driver behind similarity and dissimilarity was seasonality, as it changed hydrological conditions and thus impacted the fish fauna in estuaries.43,54,55
Species richness showed a correlation with FCO2, Ca2+ and Cl- in all the sampling stations.56,57,58,59 The sampling areas with lower elevation had a higher amount of species while the species number decreased as elevation increased supporting Rapoport’s rule.60,61 These results resembled other studies conducted in the Yangtze river basin62, in the Southern Appalachians63, in the Himalayas64 and in the Central Andes.65 These alterations in species diversity along the altitudinal gradient could be a result of altering climatic conditions or modifications to the dynamics of habitat structure and sampling stations. The station with the lowest elevation i.e. Chadwal stream had a slow running stream with a moderate water temperature throughout the year and more silt and sand in the substratum which was suitable for the fish species like Puntius conchonius, P. ticto, Xenentodon cancila, Danio devario and Chela bacaila.23,66,67 The sampling station with the highest elevation i.e. the Bhini stream had a lower number of species in general. But the stream was less deep and fast flowing with higher oxygen concentration and had more rocks and plants in the substratum providing a suitable environment for hill stream fishes like Barilius vagra, Lepidocephalichthys guntea, Tor tor, Crossocheilus latius and Labeo dero as these species tend to prevail in shallow, swift-flowing streams with more plants and oxygen for food requirements and rocks for attachment and protection from predators.68
Conclusion
The present study was able to evaluate changes in fish assemblages spatially and temporally using environmental data. This study thus revealed that fish assemblages in River Ravi and Chenab varied significantly spatially but to a very small extent temporally. It was also deduced that different environmental variables had varying effects on fish populations in different sampling streams studied. The uncovered information in this study can be used to track the health of small rivers and streams in a regional ecosystem. Research on aquatic ecosystem diversity and ecological operations (such as preservation, restoration and acclimatization) could help in proper economic planning and execution by generating fact sheets on the distribution of rare and endangered fish species.
Acknowledgements
The author would like to thank the Department of Science and Technology (DST), Rashtriya Uchchatar Shiksha Abhiyan (RUSA), Government of India for providing necessary facilities under the Fund for Improvement of S & T Infrastructure (FIST) and Promotion of University Research and Excellence (PURSE) programs. The valuable suggestions and help provided by the Head, Department of Zoology, University of Jammu are duly acknowledged.
Conflict of Interest
No potential conflict of interest was declared by the authors.
References
- Sarkar U.K., Jena J.K., Singh S.P., Singh A.K., Rebello S.C. Documenting Coastal Fish Biodiversity of India: Status, Issues and Challenges. Conference Paper, International Day for Biological Diversity, Uttar Pradesh State Biodiversity Board, Lucknow. 2012.
- Gopi K.C., Mishra S.S. Chapter 12 - Diversity of Marine Fish of India, Marine Faunal Diversity in India, Academic Press. 2015.
- Margules C, Pressey R. Systematic Conservation Planning. Nature. 2000;405:243-253.
- Saunders D, Meeuwig J, Vincent A. Freshwater Protected Areas: Strategies for Conservation. Conserv Biol. 2002;16(1):30 - 41.
- Nel L.J., Roux J.D., Abell R, Ashton J.P., Cowling M.R., Higgins V.J., Thieme M, Viers H.J. Progress and challenges in freshwater conservation planning. Aquat Conserv. 2008; 19(4):474-485.
- Cowx I.G. Aquatic resources management planning for the resolution of fisheries management issues. In: Hickley P, Tompkins H (Eds) Recreational Fisheries: Social, Economic and Management aspects. Oxford: Fishing News Books, Blackwell Science. 1998;97- 105.
- Lakra W.S., Lal K.K., Mohindra V. Genetic characterization and upgradation of fish species for enhanced aquaculture production and biodiversity conservation. Fish Chimes. 2006;26 (1):256-258.
- Sarkar U.K., Pathak A.K., Lakra W.S. Conservation of freshwater fish resources of India: New approaches, assessment and challenges. Biodivers Conserv. 2008;17:2495 – 2511.
- Kottelat M, Whitten T. Freshwater biodiversity in Asia with special reference to fish. World Bank Technical Paper. 1996;343-359.
- Das S.M., Nath S. A revision of fishes from Jammu province. Kashmir Sci. 1971;7:1-12.
- Tilak R. The fishes of river Tawi and its tributaries (Jammu) with notes on ecology. Rec Zool Surv Indian. 1971;56:189-232.
- Malhotra Y.R., Jyoti M.K. Identification of fishes found in Jammu (part -1). Assam Sci XIV. 1971;(2):184192.
- Dutta S.P.S. Limnology of Gadigarh stream (Miran sahib) Jammu with special reference to consumers inhabiting the stream. PhD Thesis, University of Jammu, Jammu and Kashmir State. 1978.
- Baba D.I. Ecosystem studies with special references to faunal diversity in river Chenab. PhD. Thesis, University of Jammu, Jammu. 2004.
- Gandotra R. Survey of aquatic life in river Tawi with special reference to ichthyofauna and their relationship with biotic and abiotic components. Project sponsored by Environment, Ecology and Remote Sensing, J&K Govt. 2006.
- Kadye W, Moyo N.Stream fish assemblage and habitat structure in a tropical African river basin (Nyagui River, Zimbabwe). Afr J Ecol. 2007;46:333-340.
- Tunesi L, Molinari A, Salvati E. Fish assemblage of the Marine Protected Area of Cinque Terre (NW Mediterranean Sea): First characterization and assessment by the visual census. Chem Ecol. 2006;22(1): S245-S253.
- Hossain M.S., Das N.G., Sarker S, Rahman M.Z. Fish diversity and habitat relationship with environmental variables at Meghna River estuary, Bangladesh. Egypt J Aquat Res. 2012;38: 213-226.
- Corpuz M.N.C., Paller V.G.V., Ocampo P.P. Environmental variables structuring the stream gobioid assemblages in the three protected areas in Southern Luzon, Philippines. Raffles Bull Zool. 2015;63: 357-365.
- Magurran A.E. Ecological Diversity and Its Measurement. Croom Helm, London. 1988.
- Vyas V, Damde V, Parashar V. Fish biodiversity of Betwa River in Madhya Pradesh, India with special reference to a sacred ghat. Int J Biodivers Conserv. 2012;4: 71-77.
- Day F. The fishes of India; being a natural history of the fishes known to inhabit the seas and fresh waters of India, Burma and Ceylon. 1978.
- Talwar P.K., Jhingran A.G. Inland fishes of India and adjacent countries. Oxford and IBH Publishing Company Pvt. Ltd., New Delhi.1991.
- Jayaram K.C. The freshwater fishes of India, Pakistan, Bangladesh, Burma and Sri Lanka-A Handbook, Calcutta, India.1981.
- APHA. Standard Methods for the Examination of Water and Wastewater. Washington, DC, USA: American Public Health Association. 1998.
- Hauer F.R., Lamberti G.A. Methods in Stream Ecology. Academic Press/Elsevier. 2006.
- Spjøtvoll E, Stoline M.R. An Extension of the T-Method of Multiple Comparison to Include the Cases with Unequal Sample Sizes. J Am Stat Assoc. 1973;68:975-97.
- Cao Y, Larsen D, Thorne R.S.J. Rare species in multivariate analysis for bioassessment: some considerations. J N Am Benthol Soc. 2001;20(1):144-53.
- Clarke K.R. Non-parametric multivariate analyses of changes in community structure. Aust J Ecol. 1993;18(1):117-43.
- Clarke K.R., Warwick R.M. Changes in Marine Communities: An Approach to Statistical Analyses and Interpretation. Natural Environment Research Council, Plymouth. 1994
- Stub R, Appling J.W., Hatstetter A.M., Hass I.J.The effect of industrial waste of Memphis and Shelby country on primary planktonic producers. Bioscience. 1970;20:905-912.
- Mason C.F. Biology of FreshWater Pollution. Longman Scientific and technical.1988.
- Dash M.C. Fundamentals of Ecology. 2nd Edition Tata McGraw-Hill publishing company limited New Delhi. 2003.
- Bio A, Vieira N, Costa M.J., Valente A. Assessment of habitat and water quality of the Portuguese Febros River and one of its tributaries. Limnetica. 2011;30: 103-116.
- Abo-Taleb H.A. Importance of Plankton to Fish Community. In: Bozkurt Y (ed) Biological Research in Aquatic Science. IntechOpen Limited, London, United Kingdom. 2019;83-89.
- Kathiresan K, Bingham B. Biology of mangroves and mangrove ecosystems. Adv Mar Biol. 2001;40:81-215.
- Rashleigh B. Relation of environmental characteristics to fish assemblages in the upper French broad river basin, North Carolina. Environ Monit Assess. 2004;93: 139-156.
- Maes J, Van Damme S, Meire P, Ollevier F. Statistical modelling of seasonal and environmental influences on the population dynamics of an estuarine fish community. Mar Biol. 2004;145:1033-1042.
- Vega-Cendejas M.E., De Santillana M.H., Norris S. Habitat characteristics and environmental parameters influencing fish assemblages of karstic pools in southern Mexico. Neotrop Ichthyol. 2013;11: 859-870.
- Whitfield A.K., Beckley L.E., Bennett B.A., Branch G.M., Kok H.M., Potter I.C., van der Elst R.P. Composition, species richness and similarity of ichthyofaunas in eelgrass Zostera capensis beds of southern Africa. S Afr J Mar Sci. 1989;8: 251–259.
- Grimaldo L, Sommer T, Ark N, Jones G, Holland E, Moyle P, Herbold B, Smith P. Factors Affecting Fish Entrainment into Massive Water Diversions in a Tidal Freshwater Estuary: Can Fish Losses be Managed? North Am J Fish Manage. 2009;29:1253-1270.
- Williamson M. Species diversity in ecological communities. In: Bartlett MS and RW Horns (eds) The mathematical theory of the dynamics of biological populations. Academic Press, London. 1973;325–326.
- Huh S.H., Kitting C.L. Trophic relationships among concentrated populations of small fishes in seagrass meadows. J Exp Mar Biol Ecol. 1985;92:29-43.
- Keskin C, Ünsal N. The fish fauna of Gökçeada Island, NE Aegean Sea, Tlirkey. Ital J Zool 1998;65:299-302.
- Ryer C.H., Orth R.J. Feeding ecology of the northern pipefish, Syngnathus fuscus, in a seagrass community of the lower Chesapeake Bay. Estuaries Coast.1987;10:330-336.
- Nair N.B., Arunachalam M, Nair M.K.C., Suryanarayanan H. Seasonal variation and species diversity of fishes in the Neyyarriver of the Western Ghats. Trop Ecol.1989;30(1):69-74.
- Türkmen G, Kazanci N. Applications of various biodiversity indices to benthic macroinvertebrate assemblages in streams of a national park in Turkey. Rev. Hydrobiol. 2010;3(2):111-125.
- Zhou F, Liu Y, Guo H.C. Application of multivariate statistical methods to the water quality assessment of the watercourses in the Northwestern New Territories, Hong Kong. Environ Monit Assess. 2006;132:1–13.
- Liu F, Lin P, Liu H, Wang J. Spatial and temporal patterns of fish assemblages in mountain streams of the Ren River, southwest China. Ecol. Evol. 2021.
- Agostinho A, Pelicice F Gomes L. Dams and the fish fauna of the Neotropical region: Impacts and management related to diversity and fisheries. Braz. J. Biol. 2008; 68:1119-32.
- Loneragan N.R., Potter I.C. Factors influencing community structure and distribution of different lifecycle categories of fishes in shallow waters of a large Australian estuary. Mar Biol. 1990;106: 25-37.
- Young G.C., Potter I.C. Do the characteristics of the ichthyoplankton in an artificial and a natural entrance channel of a large estuary differ? Estuarine, Coastal and Shelf Science. 2003;56: 765-779.
- Koel T.M., Peterka J. Stream Fish Communities and Environmental Correlates in the Red River of the North, Minnesota and North Dakota. Environ Biol Fishes. 2003;67:137-155.
- Li J.H., Huang L.L., Zou L.M., Kano Y, Sato T, Yahara T. Spatial and temporal variation of fish assemblages and their associations to habitat variables in a mountain stream of north Tiaoxi River, China. Environ Biol Fishes. 2012.93: 403–417.
- Atkore V , Kelkar N, Badiger S, Shanker K, Krishnaswamy J. Multiscale Investigation of Water Chemistry Effects on Fish Guild Species Richness in Regulated and Non regulated Rivers of India's the Western Ghats: Implications for Restoration. T Am Fish Soc. 2020;149(3).
- Pokharel K.K., Khadga B.B., Trilok C.M., Chitra B.B.Correlations between fish assemblage structure and environmental variables of the Seti Gandaki River Basin, Nepal. J Freshw Ecol. 2018;33(1):31-43.
- Rapoport E.H. Areography: geographical strategies of species. Pergamon Press, New York. 1982.
- Stevens G.C.The elevational gradient in altitudinal range, an extension of Rapoport’s altitudinal rule to altitude. Am Nat. 1992;140:893–911.
- Fu C, Wu J, Wang X, Lei G, Chen J.Patterns of diversity, altitudinal range and body size among freshwater fishes in the Yangtze River Basin, China. Glob Ecol Biogeogr. 2004;13:543– 552.
- Robinson J.L., Rand P.S. Discontinuity in fish assemblages across an elevation gradient in a southern Appalachian watershed, USA. Ecol Freshw Fish. 2005;14:14–23.
- Bhatt J.P., Manish K, Pandit M.K. Elevational gradients in fish diversity in the Himalaya: water discharge is the key driver of distribution patterns. PLoS One. 2012;7(9):46237.
- Jaramillo-Villa U, Maldonado-Ocampo J.A., Escobar F. Altitudinal variation in fish assemblage diversity in streams of the Central Andes of Colombia. J Fish Biol. 2010; 76:2401–2417.
- Riehl R, Baensch H.A. Aquarien Atlas, Band 1. Mergus Verlag GmbH,Germany.1991.
- Barooah C, Sarma L. Vertebrates of Assam; a checklist with IUCN status. Assam Science Technology and Environment Council. 2016.
- Khanna SS, Singh HR. Textbook Of Fish Biology And Fisheries. Narendra Publishing House, Delhi. 2006.


