An Investigation on Physico- Chemical Parameters of Ground Water Near Mining Areas of Kadapa District, A. P, India.
S. Mohammad Farooq1
 , S. Sumithra2
*
, M. Maddaka1
and C. Sireesha2
, S. Sumithra2
*
, M. Maddaka1
and C. Sireesha2
1
Departmet of Environmental Sciences,
Yogi Vemana University,
Kadapa,
Andhra Pradesh
India
2
Departemt of Biotechnology and Bioinformatics,
Yogi Vemana University,
Kadapa,
Andhra Pradesh
India
http://dx.doi.org/10.12944/CWE.18.2.31
Copy the following to cite this article:
Farooq S. M, Sumithra S, Maddaka M, Sireesha C. An Investigation on Physico- Chemical Parameters of Ground Water Near Mining Areas of Kadapa District, A. P, India. Curr World Environ 2023;18(2). DOI:http://dx.doi.org/10.12944/CWE.18.2.31
Copy the following to cite this URL:
Farooq S. M, Sumithra S, Maddaka M, Sireesha C. An Investigation on Physico- Chemical Parameters of Ground Water Near Mining Areas of Kadapa District, A. P, India. Curr World Environ 2023;18(2).
Download article (pdf)
Citation Manager
Publish History

Introduction
The process of mining affects and deteriorates the environment in different ways. It harms the most water course. The main sources of water contamination are drainage of mine water, water from spoil heaps, and leaking or flow of mineral exposed water to the surface or to nearby located aquifer systems and surface water bodies. Availability of clean water is decreasing day by day due to the pollution of water and over population1. The physical-chemical properties of water are very much responsible for the water-borne diseases that may lead to a life crippled in many villages of the country. There are various existing industries and industrial estates that use huge quantities for processing and release much of the water as effluent nearby water drains. Water quality is more important for public health policies, economic development, and maintaining a balanced environment2. Observation of water quality levels is therefore very prime to know the contamination levels, assessing the probable threat to the environment and for the sustainable management of water course, also to assess its portability for human consumption3,4.
When compared to quantity, water quality is very much important in all water supplies, particularly for potable purposes. The standards of water quality are the pillar of standard-based control and are need for the process of treatment. This permissible standard limit support the attempt to achieve and maintain the shielding water quality conditions5,6. The objective of the present work is to look into the levels of anions, cations, and trace metals in the nearby water of mining areas and its nearby villages and thereby the obtained data are compared along the limits put forth by the WHO.
Study Area
Uranium ore mining in Tummalapalle are been located in Kadapa district of Vemula Mandal in A.P at a distance of about 70 km (43 mi) from Kadapa, the headquarters of the district. The area located is latitude 14 18?36? N and 1420?20? N and longitude 78?15?16? E and 78?18?03.3? E.
The nearby region is Pulivendula, which is 15 kilometres away by road towards north-west. The mining area are linked to Pulivendula with village roads main Highway No. 18 of the state, which joins Kadapa with Pulivendula and the nearest railway station is Muddanuru, the southern central railways.
The second study area is Mangampeta village which is in the Obulavaripalle mandal in Kadapa district of Andhra Pradesh. It is located 82 KM towards East from the District head quarters Kadapa.
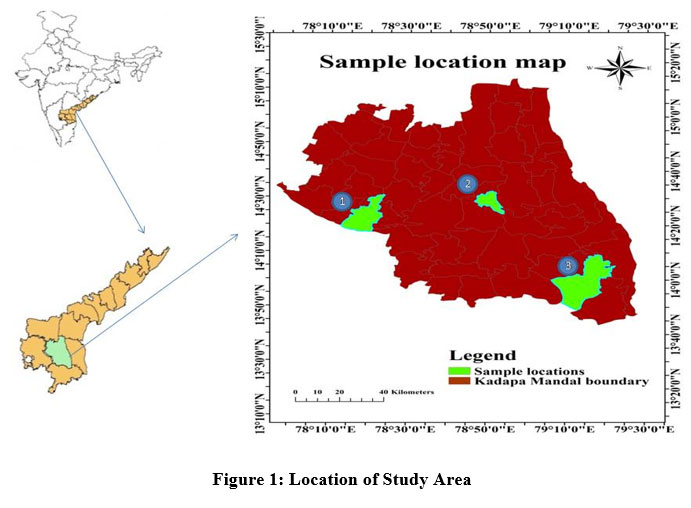 | Figure 1: Location of Study Area.
|
Methodology
All the water samples were collected in the month of January – March 2022, transfered to the Laboratory and were kept in a refrigerator before analysis. All the sample waters were analyzed for different physical chemical characteristics using standards methods put forth by APHA7. pH, Turbidity, TDS, DO and EC of water sample was estimated using water analyzer kit (Systronics371) at the site and as well as other characteristics was analyzed inside the laboratory. Total hardness (TH) were estimated by EDTA method using Eriochrome black T (EBT) as indicator. Carbonate and bicarbonate alkalinity concentrations were analysed with titration utilizing indicator method. Chloride was estimated by Argentometric method.
Phosphate content was analysed by a using a UV-Visible spectrophotometer (Lab India). colorimetrically. Heavy metals (Lead, Zinc, Copper, and Iron) was carried out by Atomic Absorption Spectrometer (Shimadzu AA 6880), Calcium, Magnesium and sodium were analysed using AAS.
Results and Discussion
The analysed reports of the entire properties of water quality of the water samples are presented in the Tables 1, 2. A entire outcomes are compared with standard limits suggested by the World Health Organization (WHO).
Table 1: Physico - chemical characteristics of surface water near Tummalapalle mining area and surrounding area.
Site 1 | Site 2 | Site 3 | Site 4 | Site 5 | Site 6 |
Site7 |
Site 8 | WHO Standards | |
pH % error | 7.67 2.3 | 8.08 7.7 | 8.44 12.5 | 7.21 -3.9 | 7.27 -3.2 | 7.69 2.5 | 7.24 -3.5 | 7.57 0.9 | 6.5 -8.5 |
EC (µS/cm) % error | 662 -33.8 | 288.8 -71.1 | 974 -2.6 | 499 -50.1 | 976 -2.4 | 652 -34.8 | 645 -35.5 | 646 -35.4 | 1000 |
Total Dissolved Solids (mg/L) % error | 323 -67.7 | 152 -84.8 | 481 -51.9 | 254 -74.6 | 291 -70.9 | 223 -77.7 | 35.5 -96.5 | 42.6 -95.7 | 1000 |
Turbidity (NTU) % error | 0 | 0 | 0 | 0.77 -84.6 | 0 | 0.74 -85.2 | 0 | 0 | 5 |
Total Hardness (mg/L) % error | 148 -50.7 | 102 -66 | 312 4 | 212 -29.3 | 480 60 | 350 16.7 | 404 34.7 | 544 81.3 | 300 |
Total Alkalinity (mg/L) % error | 51
-74.5 | 34
-83 | 34
-83 | 42.5
-78.8 | 85
-57.5 | 51
-74.5 | 68
-66 | 59.5
-70.3 | 200 |
Chloride (mg/L) % error | 90.92 -63.6 | 23.57 -90.6 | 123.67 -50.5 | 37.47 -85.0 | 119.93 -52.0 | 59.96 -76.0 | 116.18 -53.5 | 123.67 -50.5 | 250 |
Phosphate (µg/L) % error | 0 | 0.1 -99.9 | 0.2 -99.9 | 0.3 -99.8 | 0.5 -99.8 | 2.4 -99.0 | 0.6 -99.8 | 0.3 -99.8 | 250 |
Dissolved Oxygen (mg/L) % error | 8.1 62 | 8.0 60 | 7.9 58 | 7.9 58 | 7.8 56 | 7.8 56 | 7.8 56 | 7.8 56 | 4- 6 |
Calcium (mg/L) % error | 14.89 -80.1 | 0 | 5.18 -93.0 | 5.27 -92.9 | 7.82 -89.6 | 45 -40 | 35 -53.3 | 48 -36 | 75 |
| Sodium (mg/L) | 175.78 -12.11 | 2.74 -98.6 | 2.74 -98.6 | 2.6 -98.7 | 4.94 -97.5 | 70 -65 | 130 -35 | 175 -12.5 | 200 |
Magnesium (mg/L) % error | 52.89
252.6 | 0 | 0 | 0 | 0 | 153
920 | 180
1100 | 175
1066.7 | 15 |
| Strontium (mg/L) | 12.39 | 13.57 | 0 | 10.07 | 15.13 | 130 | 110 | 100 | ----- |
Iron (ppm) % error | 6.21 1970 | 2.06 586.7 | 4.09 1263.3 | 2.64 780 | 3.12 940 | 20 6566.7 | 18 5900 | 22 7233.3 | 0.30 |
Copper (ppm) % error | 0 | 0 | 0.1 -90 | 0 | 0 | 0 | 0 | 0 | 1.0 |
Zinc (ppm) % error | 0 | 0 | 5 66.7 | 0.7 -76.7 | 1.9 -36.7 | 0.1 -96.7 | 0.8 -73.3 | 0 | 3 |
COD (ppm) % error | 8 -80 | 0 | 0 | 0 | 4 -90 | 0 | 12 -70 | 8 -80 | 40 |
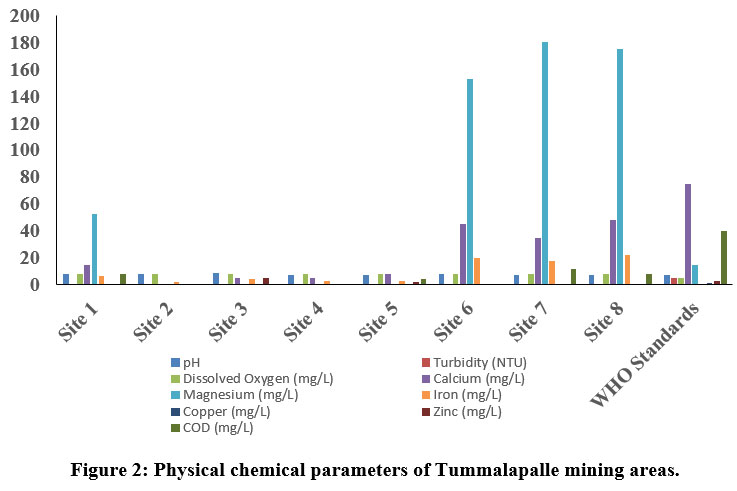 | Figure 2: Physical chemical parameters of Tummalapalle mining areas.
|
Table 2: Physico-chemical properties of water from Mangampeta mining area.
| Characteristics | Site 1 | Site 2 | Site 3 | Site 4 | Site 5 | WHO Standards |
pH % error | 7.51 0.13 | 7.51 0.13 | 7.52 0.26 | 7.51 0.13 | 7.88 5.07 | 6.5-8.5 |
EC (µS/cm) % error | 2464 146.4 | 1742 74.2 | 1046 4.6 | 1384 38.4 | 2506 150.6 | 1000 |
Total Dissolved Solids (mg/L) % error | 1375 37.5 | 881 -11.9
| 495 -50.5 | 702 -29.8 | 1217 21.7 | 1000 |
Turbidity (NTU) % error | 0.58 -88.4 | 1.5 -70 | 1.1 -78 | 1.1 -78 | 1.6 -68 | 5 |
Total Hardness (mg/L) % error | 1500 400 | 700 133.3 | 500 66.7 | 625 108.3 | 1400 366.7 | 300 |
Total Alkalinity (mg/L) % error | 41.25 -79.4 | 49.5 -72.3 | 41.25 -79.4 | 57.75 -71.13 | 33 -83.5 | 200 |
Chloride (mg/L) % error | 74.44 -70.2 | 70.9 -71.6 | 28.36 -88.7 | 99.26 -60.3 | 81.535 -67.4 | 250 |
Phosphate (µg/L) % error | 0.03 -99.9 | 0.07 -99.9 | 0.05 -99.9 | 0.03 -99.9 | 0.04 -99.9 | 250 |
Dissolved Oxygen (ppm) % error | 8.9 78 | 8.3 66 | 8.2 64 | 8.1 62 | 8.0 60 | 4-6 |
Calcium (mg/L) % error | 253 237.3 | 110 46.7 | 12 -84 | 32 -57.3 | 65 -13.3 | 75 |
Sodium (mg/L) % error | 562 181 | 2230 1015 | 118 -41 | 1044 422 | 977 388.5 | 200 |
Magnesium (mg/L) % error | 1501 9906.7 | 487 3146.7 | 184 1126.7 | 400 2566.7 | 330 2100 | 15 |
Strontium (mg/L) % error | 25 | 38 | 17 | 25 | 20 | ----- |
| Iron (ppm) | nil | nil | nil | nil | nil | 0.30 |
| Copper (ppm) | nil | nil | nil | nil | nil | 1.0 |
Zinc (ppm) % error | nil | nil | 1.6 -46.7 | nil | nil | 3 |
COD (ppm) % error | 7 -82.5 | 9 -77.5 | 10 -75 | 12 -70 | 8 -80 | 40 |
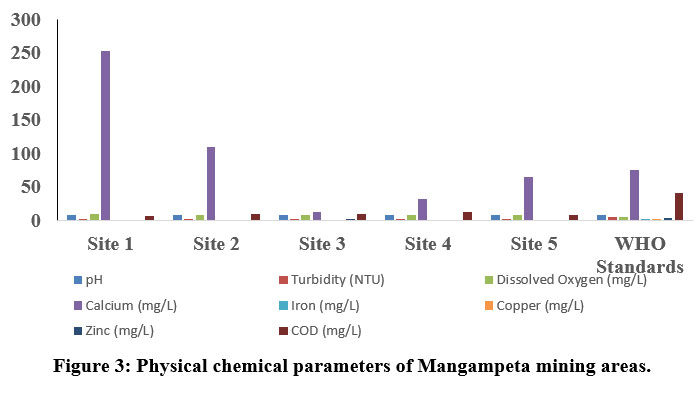
 | Figure 3: Physical chemical parameters of Mangampeta mining areas.
|
The pH is one of the key biotic factors. The pH values of the samples collected from Thummalapalle ranged from 7.21 to 8.44 (Table 1) and the mangampeta mining area water sample varied from 7.51 to 7.88, respectively which are within the permissible 8. The Electrical Conductivity in the Thummalapalle ranged between 288.8 to 976 ?S/cm and were found below the permissible limit (1000 ?S/cm), as in the Mangampeta mining area ranged from 1046 to 2506 ?S/cm. The S1, S2 andall samples of mangampeta mining area water are more than the WHO permissible limits (1000 ?S/cm). TDS are mainly composed of chlorides, bicarbonates, phosphates, carbonates and nitrates of calcium, magnesium, organic matter, manganese, potassium, sodium, salt and other particles 9. Total Dissolved Solids values of Thummalapalle samples varies from 35.5 to 481 ppm and are within the limits of WHO, the mangampeta mining area sample waters varied from 495 to 1375 mg/L. Two samples S1 and S5 from the mangampeta mining area crossed WHO permissible limits (Table 2).
Turbidity is nothing but the amount of which the water limits its transparency due to the availability of floating particles. It is a result of light reflection from the surface and is determined by the absorption characteristics of both water and its dissolved and particulate matter 10. The quality of water is due to the good measure of the turbidity content. Turbidity in Thummalapalle water is the range of 0 - 0.77 NTU and Mangampeta mining area water is in the range from 0.58 -1.6 NTU. Total hardness although have no health effects but it can make water unfit for domestic and industrial use11. In the present study Thummalapalle showed total hardness from 102 -544 mg/L and Mangampeta mining area water ranged from 500 - 1500 ppm, Higher hardness are probably due to systematic addition of soaps and sewage into water from nearby areas. S1, S5 and S8 samples of Thummalapalle mining area are not within the WHO limit (Table 1). This is in accord to the Opencast mine, Chirimiri, District Koriya, Chhattisgarh12.
The value of alkalinity gives an idea of natural salts present in water11. A high content of total alkalinity may be because of the more amount of organic decomposition during which CO2 gas is liberated. Alkalinity is considered as both methyl orange alkalinity and phenolphthalein alkalinity. Based on the results obtained, Thummalaplle showed from 34 to 85 mg/L, and the mangampeta mining area water sample ranges from 41.25 to 57.75 ppm. Chloride content were among the major anions present in water and is often combined with magnesium, calcium or sodium. Higher level of chloride ions in water bodies will harm the metallic pipes and structure as well as agricultural crops 13. As per the results obtained the Thummalapalle water samples ranged from 23.57 to 123.67 and the mangampeta mining area sample water ranged from 28.36 to 99.26 mg/L.
Phosphate level in Thummalapalle water samples varies between 0 to 2.4 mg/L, and Mangampeta mining area water ranged from 0.03 to 0.07mg/L, and Phosphate when they are present in high levels it is toxic to people or animals. Dissolved oxygen content is one of the regulators of metabolic processes of animal and plant communities and is an indicator of the condition of the water. This is one of the factors which give more information about the overall health of water bodies than any other chemical properties. Thummalapalle water ranged from 7.8 to 8.1 mg/Land Mangampeta mining area water ranged from 8.1 to 8.9 mg/L. respectively.
Calcium ions are commonly seen in sample waters due to their higher solubility in water and association with carbonates and sulfate. Calcium levels assessed in Thummalapalle water samples vary from 0 to 48 mg/L and the Mangampeta mining area water sample ranged from 28.36 to 99.26 mg/L. respectively WHO standard of calcium is 250 mg/L. S1 and S2 of Mangampeta mining area water samples were recorded higher than the WHO permissible limit. Sodium is one of the familiar ions in water samples because of its higher solubility in water and association with carbonates sulfates. Sodium levels in the Thummalapalle water ranged from 2.6 to 175.78 mg/Land Mangampeta mining area water sample ranging from 118 to 2230 mg/L. Magnesium is present in seawater. After sodium, it is the most found cation in oceans. Thummalapalle water samples ranged from 0 to 180 mg/Land Mangampeta mining area water samples showed from 184 to 1501 mg/L. Mangampeta mining area water sample and S1, S6, S7, and S8 were more than the WHO standards.
A strontium ion disrupts the normal bone structure, leading to skeletal problems and defects. Strontium content reacts with water slowly, generally to form hydrogen gas and strontium hydroxide, thereby reacts with water more quickly than that of Ca+. Sr ion values in Thummalapalle water samples vary from 0 to 130 mg/L and the Mangampeta mining area water sample ranged from 17 to 38 mg/L, respectively.
The main sources of iron content in groundwater resources are naturally as a mineral from sediment and rocks or from mining, corroding metal and industrial waste. Thummalapalle water samples ranged from 2.06 to 22mg/Lwhich is above the standards of WHO. Iron concentration showed from 0.151 to 0.288 mg/L14. Metallic element of copper that is essential to human health. Little amount are unhealthy and more amount may lead to Cu poisoning. Thummalapalle samples varied from 0 to 0.1mg/L.
Zinc content is one of the essential nutrients for body development and growth; however, higher levels of zinc in drinking water can lead to nausea, vomiting and stomach cramps. Water with a concentration of zinc of high than 5 mg/L may start to become chalky in appearance with a detectable decline in taste. Thummalapalle water samples vary between 0 mg/L to 5 mg/L and Mangampeta mining area samples vary from 0 mg/L to 1.6 mg/L which are within the permissible limit. In wastewater higher levels of chemical oxygen demand indicate the concentrations of organics which can deplete DO in the water, leading to negative environmental and regulatory effects. Thummalapalle water sample ranges between 0 to 12 mg/L, Mangampeta mining area water samples showed 7 to 10 ppm.
Conclusion
Based on the result of water quality in 2mining areas vizThummalaplle and Mangampeta and the parameters studied are pH, EC, TDS, Turbidity, Total hardness, Total alkalinity, Chloride, Phosphate, Dissolved oxygen, Calcium, Sodium, Magnesium, Strontium, Iron, Copper, Zinc and Chemical oxygen demand. The total hardness, EC, Na, and Mg of Mangampeta mining area samples are above the permissible limits. TDS of S2 and S5 samples in Mangampeta mining area water was reported to be within the WHO permissible limit. Total hardness in Thummalapalle samples S5, S7, and S8 showed above the WHO permissible limit.
Acknowledgement
The authors are much thankful to the DST – SERB (EEQ), New Delhi for financial assistance (Ref. No. EEQ/2019/000184).
Conflict of Interest
The authors do not have any conflict of interest.
Funding Sources
The authors are much thankful to the DST – SERB (EEQ), New Delhi for financial assistance (Ref. No. EEQ/2019/000184).
References
- Shi, P.,Zhang,Y., Li, Z., Li, B.,Pxu, G. C. (2017).Influence of land use and land cover patterns on seasonal water quality at multi – spatial scales. Catena, 151, 182 – 190.
CrossRef - Harit, P.,Sarv, P., and Sangharsh, R. (2018).Ground water quality in Beswan and Iglas, Aligarh district, Uttar Pradesh, India. International J. of Env. Sciences and Natural Resources, 14, 0126 – 0135.
- Amadi, A. N.,Olasehinde, P. I.,Yisa, J.,Okosun, E. A.,Nwankwoala, Ho., Alkali, P. (2012). Geo statistical assessment of ground water quality of coastal aquifers of eastern Niger Delta. Geosciences, 2, 51 – 59.
CrossRef - Shittu, O. B., Olaitan, J.O.,Amus, T. S. (2008). Physico – chemical and bacteriological analysis of water used for drinking and swimming purposes in Abeokuta Nigeria. African J. of Biomedical Research,11, 285 – 290.
CrossRef - OmakaNdukatu, O., Ifeanyi Francis, O., Kechukwu Moses, O. (2014). Hydrogeochemical attributes and ground water quality of Ngbo community in Ohaukwu area council, Ebonyi state, Nigeria Ambiente and Agua. An International J. of Applied Science, 10, 36 – 47.
CrossRef - Al Suhaimi, A.O. (2017). Preliminary assessment for physico chemical quality parameters of ground water in oqdus area, Saudi Arabia. Journal of the Saudi Society of Agricultural Sciences.
- American Public Health Association – APHA (2012). Standard methods for the examination of water and wastewater. Washington DC.
- WHO. (2002).WATER Pollutants: Biological Agents Dissolved Chemical, Non-dissolved Chemicals, Sediments, Heat. WHO CEHA, Amman, Jordan.
- Mahananda, M. R., Mohanty, B. P., Behera, N. R. (2010).Physico- chemical analysis of surface and ground water of Bargarh district, Orissa, India, IJRRAS,2(3), 284-295.
- Stepane, K. M. (1959). Limnological study of the reservoir sedlice near Zelive, IX. Transmission and transparency of water. Sci. pap. Inst. Chem. Tedind; Pragne.Fac-Technol Fuel Water, 3, 363-430.
- Janardhana, R. D., Hari,B., Swami, A. V. V., and Sumithra. S. (2013).“Physico-Chemical Characteristics of Ground Water of Vuyyuru, Part of East Coast of India”. Universal Journal of Environmental Research and Technology, 3, 225 -232.
- Nigam, G. K., Sahu, R. K., Jitendra Sinha, Sonwanshi, R. N. (2015). A study on Physico – chemical characteristics of open cast mine water. J. of Industrial Pollution Control. 31 (2), 191 – 200.
- ADB. (1994). The Environment Program: Past, Present and Future. Asian Development Bank, Manila, Philippines.
- Hirwa, H., Nshimiyimana F. X., Tuyishine, H., Shingiro, C. (2019). Impact of mining activities as water quality status at Wolfram Mining and Processing (WMP), Burera, Rwanda. J. of Materials and Environmental Science. 10, 1214 – 1220.


