Assessment of LULC changes in Western Himalayan Mountain Landscape: A Case of Sainj River Valley, Himachal Pradesh (India)
Aarti Vatsal
*
 , Karanjot Kaur Brar
, Vivek
and Mohammad Irfan
, Karanjot Kaur Brar
, Vivek
and Mohammad Irfan
1
Department of Geography,
Panjab University,
Chandigarh,
India
http://dx.doi.org/10.12944/CWE.18.2.26
Copy the following to cite this article:
Vatsal A, Brar K. K, Vivek V, Irfan M. Assessment of LULC changes in Western Himalayan Mountain Landscape: A Case of Sainj River Valley, Himachal Pradesh (India). Curr World Environ 2023;18(2). DOI:http://dx.doi.org/10.12944/CWE.18.2.26
Copy the following to cite this URL:
Vatsal A, Brar K. K, Vivek V, Irfan M. Assessment of LULC changes in Western Himalayan Mountain Landscape: A Case of Sainj River Valley, Himachal Pradesh (India). Curr World Environ 2023;18(2).
Download article (pdf)
Citation Manager
Publish History

Introduction
Changes in man and nature interaction are driven by human aspirations leading to further changes in the land uses/covers. At a global scale, the shift in human dynamics is revealing very significant regional disparities by demonstrating how the population and wealth draw different traces1 showing how the environmental sustainability and landscape modifications across the globe2. According to research, emerging countries such as Sub-Saharan Africa and portions of Asia are experiencing significant population expansion, putting additional strain on natural resources and ecosystems.3Furthermore, wealth discrepancies are visible, with high-income countries such as North America and Europe holding a bigger percentage of global wealth than emerging regions.4 As a result, areas with more economic resources may be able to invest in sustainable practices and technology, but others may struggle to solve environmental issues. This discrepancy is mirrored in diverse landscape changes throughout the world.5
Sustainability issues, in this era of development including conserving nature, climate change, food availability and energy consumption are commonly addressed through the visible expression of landscape such as LULC. These issues have remained the prime focus of high-level political agreements like the ‘2030 Agenda for Sustainable Development’ of United Nations.6 In the case of high mountain areas, their interest is more specific. Despite the isolation and low population density; these areas are being impacted by the changes in climate, environment and hydrological dimensions at global level.7,8 Infrastructure development, extraction of medicinal plants and other forest produce, increasing tourism and expanding agriculture are the important anthropogenic factors, which have the potential for negative environmental changes and increased physical vulnerability9 as well as the loss of traditional cultural values in mountain landscapes.10,11To understand such phenomena and its processes on earth surface, land use/cover pattern and change analysis is important and widely used12 foridentifying areas which are vulnerable for change.13
A land use/cover change study in the Sainj River Basin of Kullu district is vital as it gives critical insights into the region's environmental dynamics and human consequences. The traces of land use change can be witnessed since the mid 19th century when the rights of forests and its components were formalized and management responsibility was given to the Forest Department by the Punjab Government.14, 15,16 In the 20th century the arrival of British colonial rulers in the valleygenerated new possibilities and induced strain on the region's resources, which has a long-term impact on the land use and cover of the region.17, 18
Recently, the region has experienced accelerated population growth and developmental activities which are resulting into changes in land use/cover and escalated natural and human-made hazards.19 The developmental activities are evident in the form of the construction of hydro-power projects causing serious threat to the bio-diversity and also influencing the regional ecological balance.20,21 Land cover classes include water bodies, snow, pastures, forest and barren and land use includes agricultural land, settlement which includes built up area and infrastructure in the major seven classes analyzed in this work. The purpose of the study is analyzing pattern, change and transformation in major seven LULC classes22which area has witnessedsince 1989 using GIS tools.
Study Area
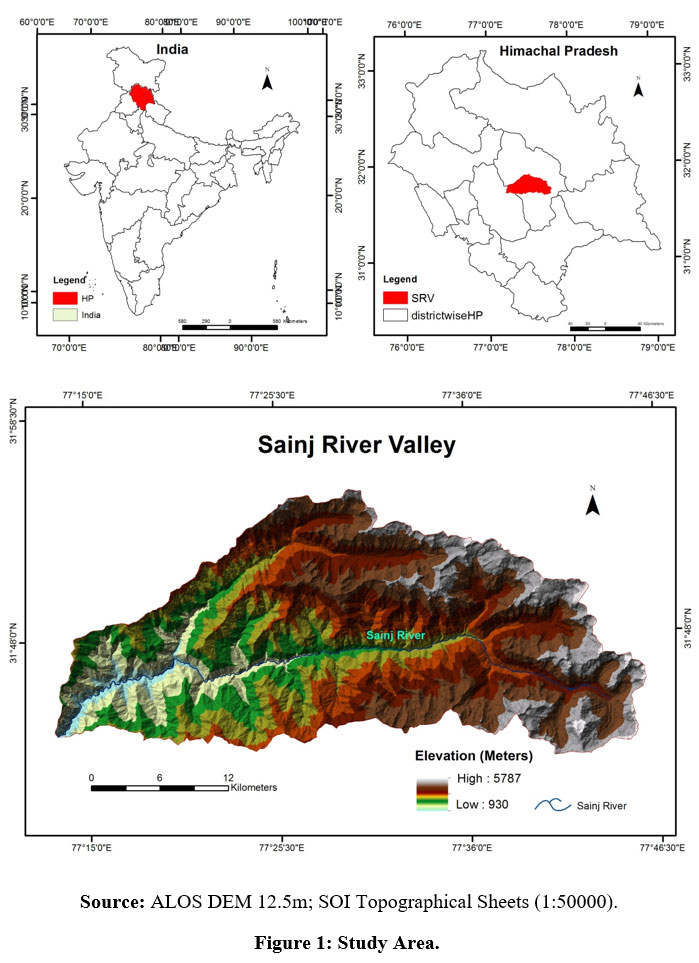
Sainj River Valley is situated in midst of biodiversity rich Western Himalayas, administratively in Kullu District of Himachal Pradesh in Northern state of Republic of India. The state is embedded with many crucial rivers not only for the state but also for adjoining plains of North-Western region of the country which includes Satluj, Chenab, Ravi and Beas which are the part of Indus River System. River Beas, which has its origin in the Pir Panjal Range, is fed by numerous streams including Sainj River. The study area stretches from 77° 12’ 30’’ to 77° 47’ 30’’ East and 31° 41’ to 31° 55’ North. Sainj River originates close to the boundary of Spiti Valley called Supa-Kuniand meets the Beas at Larji. It is fed by various small streams including Jiwa Nala having its origin at Sartoo a glacial and snow melted pond. Sainj River Valley is bounded by The Great Himalayan National Park and Parbati River in the East, Beas River Valley in the West, Hurla Nala are in the North and Tirthan River Valley in the South. The flow of river Sainj is lowest during the months between December and February and highest between June to August.
 | Figure 1: Study Area.
|
The Sainj River Valley has total geographical area of 748.33 square km and located between the lesser and the Great Himalayas with an elevation ranging from 900 meters to 5800 meters. Topography of the region is rugged and undulating comprising ranges and streams originating from the ridges of the area and ultimately merging into the Beas. The area is characterized with pasture land and meadows in the upper reaches below which are the dense forest of Deodar and Pines followed by small clusters of hamlet surrounded by agriculture fields. The major geomorphologic features of the region are cliffs, ridges, ice pinnacles and moraines and geological features are dominated by the rocks of middle Proterozoic formations and come under Lesser Himalaya tectonic zone named Larji-Rampur window.
The people living in the area are engaged in different primary activities like agriculture, horticulture, livestock etc. for their livelihoods.23Sainj River Valley has no urban area in its boundary.Sex ratio of the people in the area is 942 females per 1000 males; literacy rate is 67.66 %; households 5310 and total population is 25508 as per the 2011, Census of India.24The lifestyle of the people in the area is traditional and live life according to their customs.
Data Sources and Methodology
The land use/land cover has been analyzed in the GIS environment by using multi-temporal satellite images. For this study, images of LANDSAT satellite program have been acquired from the USGS for the period of 1989 and 2020. The images covering the data for almost thirty years include LANDSAT TM (1989) and LANDSAT 8 OLI/TIR (2020) with a spatial resolution of 30 meters (table 1). To avoid any misclassification and for accuracy assessment of the analysis ancillary data has also been used such as Digital Elevation Model (ASTER), topographical sheets of Survey of India (1:50,000), GPS and Google Earth data.
Table 1: Description of data source
Data Sources and Attributes | ||||||
Sr. No. | Data Type | Sensor | Data Acquisition | Spatial Resolution | Path/Row | Source |
1 | LANDSAT 5 | TM | 09-10-1989 | 30 M | 147/38 | USGS |
2 | LANDSAT 8 | OLI/TIRS | 14-10-2020 | 30M | 147/38 | USGS |
3 | Topographical Sheets | - | 2005 Series: H43F1,2,5,6, 9,10,13,14 | 1: 50000 | - | Survey of India |
Source: United States Geological Survey (USGS); Survey of India.
Before analyzing the datasets, pre-processing was done on satellite images including radiometric and atmospheric correction in Erdas Imagine 2014. After the image processing, supervised classification was done on both of the satellite images (figure 2). Training samplings were collected for each image comprising 20 samples for each class. The signature file was then used for classification and maximum likelihood classifier (MLC) algorithm was run to prepare land use/cover map. MLC allocates unknown pixels to a specific class having highest likelihood of belonging. In this study seven major classes of land use/land cover were identified namely, snow cover, barren land, forest cover, pastures, agriculture, settlement and water body.
In the hilly terrain, satellite data possess certain drawbacks due to shadow region, slope steepness and confusion between settlement and barren land, and between agriculture land and pasture land. To minimize such errors Google Earth and topo sheets are used to ensure correct training samples. Also, the satellite imageries were collected for the month of October because during this period the region is clearly visible without the any presence of cloud cover.
To compare the LULC maps of the different period, post processing was also done, which includes pixel-to-pixel change detection in Erdas Imagine (10.6). The transformation matrix was made to show the change within classes in ArcGIS 10.4.1 software. It was also used for accuracy assessment of land use/cover maps and final mapping purpose. Ground control points were collected during field visit was used to check accuracy of different land use/cover classes for the year 2020. The overall accuracy is 88.57% with Kappa coefficient of 0.87 showing a steady accuracy level.
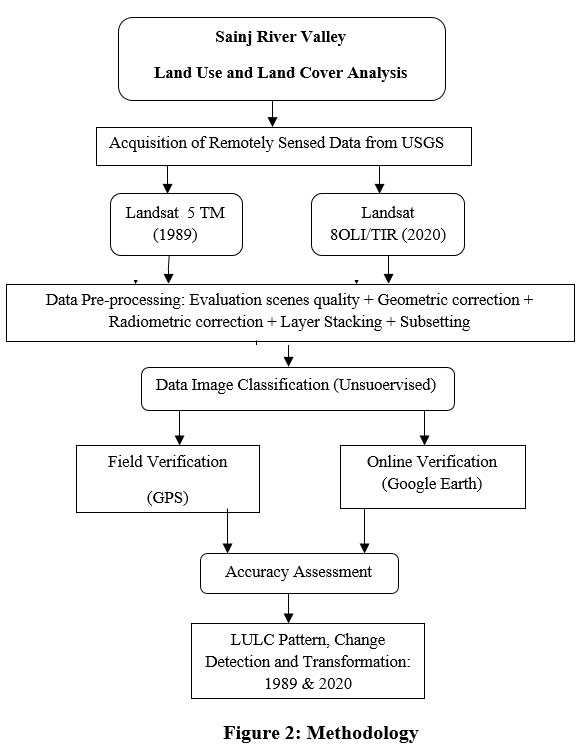 | Figure 2: Methodology
|
Results and Discussion
The satellite images for the year of 1989 and 2020 are processed for LULC mapping shown in Map 2(A) and (B) respectively. The area has been categorized into seven LULC classes shown in Table 1 and the transformation of these classes over a period is shown in Table 2.
Pattern of LULC in 1989
To analyze the LULC for the year 1989, the map has been produced by using LANDSAT 5 (TM) satellite image. Due to the lower resolution the classes of LULC mapping has been restricted to seven (map 2). The analysis shows that in 1989 the area was dominated by forest and barren land where waterbody occupied the least area (table 2). The largest part of the valley was covered by forest area accounting for 255.44 km² that is 34.13% of the total study area. The forest cover comprising deodar and pine in the upper reaches and deciduous trees near the river banks in the part of the valley. Barren land occupied second highest area i.e. 236.28 km² covering 31.57 % of the total area. The area under snow was 124 km² covering 16.57% mostly at higher altitude of more than 3500 meters from mean sea level and represents permanent snow cover. The snow cover was followed by pasture land (97.50 km²) covering 13.02% and agriculture land (26.21 km²) covering area 3.50%. The settlement occupied an area of 5.20 km², which covered less than one percent, and mostly in eastern side of the river valley. Water body included Sainj River and few glacier lakes occupying the area of 3.41 km². The LULC of 1989 shows preeminence of natural cover and less involvement of human interference.
Pattern of LULC in 2020
The LULC map of 2020 is prepared by using LANDSAT 8 (OLI/TIRS) satellite image exhibiting impact of anthropogenic activities (table 2). The barren land has highest area covering 315.53 km² accounting for 42.16% of the area. The barren land is followed by forest land occupying 219.23 km² (29.29%) of the area. The pasture land has an area of 116.03 km² covering 15.50% of the area. Snow cover comprises an area of 48.82 km² (6.52%) having stretch above the height of 4000 meters from MSL. Agriculture spread is found in 35.17 km² occupying 4.69% of area. In 2020, a continuity of agricultural land is visible comparing to previous land use pattern where agriculture activities were restricted to the smaller areas. The agricultural land is more prominent in the lower part of the valley and no further land is used for cultivation towards the higher land below 2500 meters elevation from the MSL. The similar pattern is observed in the case of settlement where the large cluster can be easily visible in the lower part of the region. The area under settlement is 9.83 km2, which is 1.32 per cent of the total area. The least area coverage is associated with water body having an area of 3.70 km² that is merely 1 percent of the total study region.
Table 2: Land Use/ Land Cover Change (1989 and 2020)
LULC Classes | 1989 | 2020 | 1989-2020 | |||
Area (km²) | Area (per cent) | Area (km²) | Area (per cent) | Change (per cent) | ||
(km²) | (per cent) | |||||
Agriculture Land | 26.21 | 3.50 | 35.17 | 4.69 | 8.96 | 34.19 |
Barren Land | 236.28 | 31.57 | 315.53 | 42.16 | 79.25 | 33.54 |
Forest cover | 255.44 | 34.13 | 219.23 | 29.29 | -36.21 | -14.18 |
Settlement | 5.20 | 0.69 | 9.83 | 1.32 | 4.65 | 89.42 |
Pasture land | 97.50 | 13.02 | 116.03 | 15.50 | 18.53 | 19.01 |
Snow cover | 124 | 16.57 | 48.82 | 6.52 | -75.18 | -60.63 |
Water body | 3.41 | 0.45 | 3.70 | 0.49 | 0.29 | 8.50 |
Total | 748.33 | 100.00 | 748.33 | 100.00 | - | |
Source: LANDSAT TM (1989) and LANDSAT 8 OLI/TIR (2020).
Land Use/Cover Change in Sainj River Valley, 1989 to 2020
LANDSAT imageries for the period of 1989 and 2020have been further compared to understand the changes within LULC classes (Table 2). Until 1989 the region was not much mobilized and seen slow development growth (Figure 3). From this period, the changes have been witnessed in terms of population expansion, conservation practices, and damming projects. Among all the seven classes highest increase is seen in settlement of 4.65 km² (89.42%) which reflects rapid infrastructure development for example hydro power projects, roads, buildings etc. It is followed by agriculture that has increased by 8.96 km² (34.19%). In land cover classes forest and snow cover have reduced -36.21 km² (-14.18%) and -75.18 km² (-60.63%) in that order which are indicator of environment degradation. And barren land has increased by 33.54% that is 79.25 km².
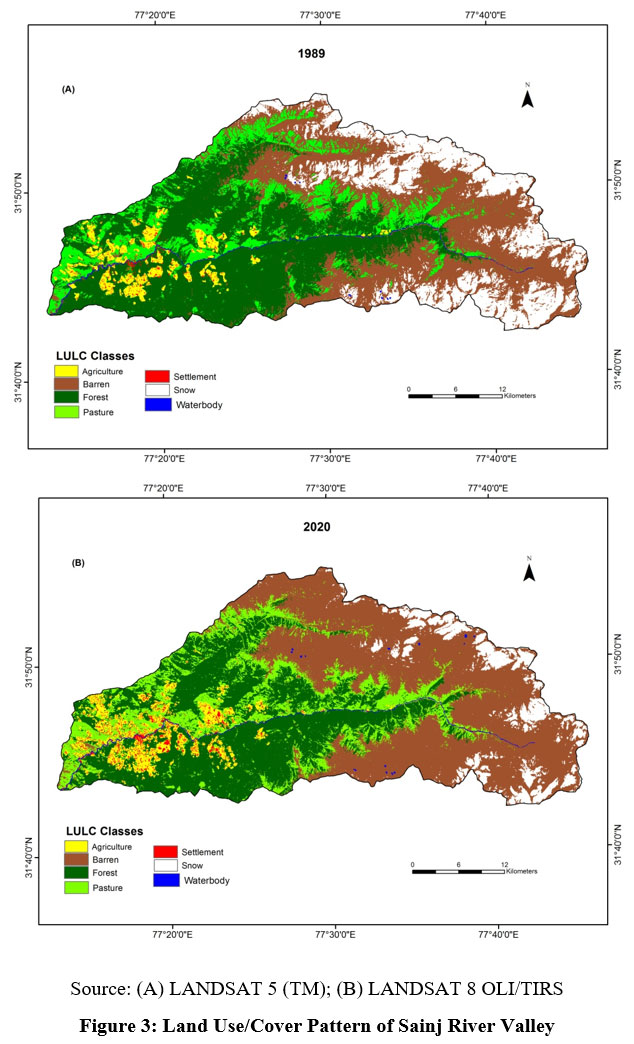 | Figure 3: Land Use/Cover Pattern of Sainj River Valley
|
Land Use/Cover Transformation in Sainj River Valley, 1989 to 2020
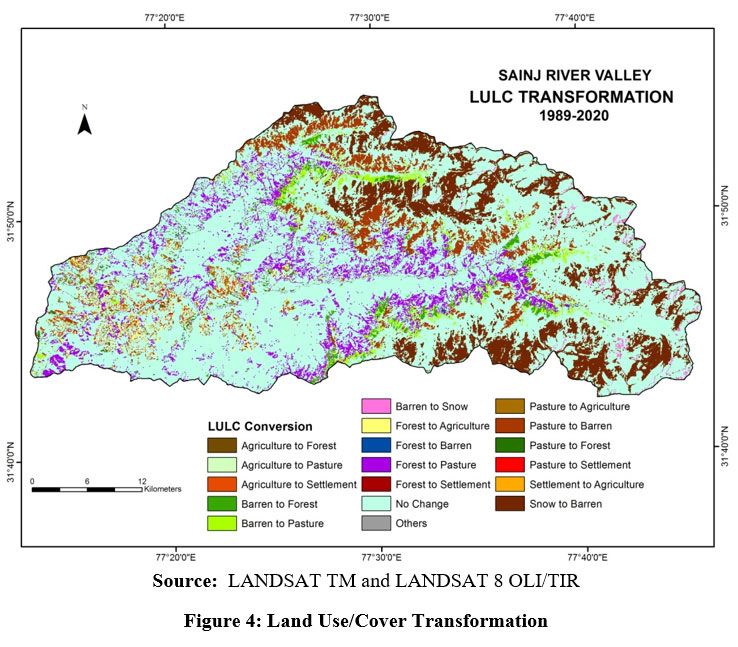
The comparison between 1989 and 2020 shows massive transformation between these two periods. Land use/cover transformation matrix shows significant changes in land cover classes. Barren land has the highest unchanged class with 200.74 km² area. This class has gained area mostly from snow cover class, which is also highest change in all the classes. This is a negative change is followed by another major negative change i.e. 42.28 km² forestland has changed into pastures and further 31.12 km² pasture has changed into barren land. On other side, few positive changes are there in land cover classes like 17.13 km² of barren has turned pasture and 12.96 km² has converted into forest. These positive changes reflect efforts given in the area for conservation and afforestation by the government institutions.
Land use classes have also seen major changes as policies for development are implemented in the area like road construction and damming project. 2.57 km² of agriculture land has changed to pasture land and 2.05 km² into forest, which can be resulted of protected area set up and displacement of people to other parts of the valley. 3.02% of agriculture also has been changed to settlement because agriculture land is the most convenient for building purpose. Major change of settlement i.e. 0.98 km² has been converted into agriculture that is because people displaced to lower places near to the roads for better connectivity and amenities and land converted into agriculture.
Table 3: Sainj River Valley Transformation Matrix
LULC Classes | Agriculture (km²) | Barren (km²) | Settlement (km²) | Forest (km²) | Pasture (km²) | Snow (km²) | Water body (km²) | Total Transfer Area(km²) | ||
Loss | 1989 | |||||||||
| Agriculture | 18.26 | 0.3 | 3.02 | 2.05 | 2.57 | 0 | 0.01 | 7.95 | 26.21 | |
| Barren | 0.54 | 200.74 | 0.24 | 12.96 | 17.13 | 4.4 | 0.27 | 35.54 | 236.28 | |
| Settlement | 0.98 | 0.02 | 3.98 | 0.1 | 0.1 | 0 | 0.02 | 1.22 | 5.20 | |
| Forest | 9.01 | 3.5 | 1.54 | 198.87 | 42.28 | 0.01 | 0.23 | 56.57 | 255.44 | |
| Pasture | 6.35 | 31.12 | 1.03 | 5.12 | 53.72 | 0 | 0.16 | 43.78 | 97.50 | |
| Snow | 0 | 79.32 | 0 | 0.00 | 0.04 | 44.41 | 0.23 | 79.59 | 124.00 | |
| Water body | 0.03 | 0.53 | 0.04 | 0.13 | 0.19 | 0 | 2.78 | 0.92 | 3.70 | |
| Total Transfer Area(km²) | Gain | 16.91 | 114.79 | 5.87 | 20.36 | 62.31 | 4.41 | 0.92 | - | - |
2020 | 35.17 | 315.53 | 9.85 | 219.23 | 116.03 | 48.82 | 3.70 | - | 748.33 | |
Source: LANDSAT TM (1989) and LANDSAT 8 OLI/TIR (2020).
 | Figure 4: Land Use/Cover Transformation.
|
The results in this particular study area show the large changes and modifications in the landscape motivated by humans. These results must be understood and contextualized within the particular study area21.
Conclusion
The study has revealed the landscape transformation aspects in Sainj River Valley since 1980s, the era of rapid development, which changed the traditional man-environment interaction to market economy. The period witnessed development activities whether conservation of biodiversity or harnessing the hydro-power and aesthetic character of the region ultimately has attracted the lots of opportunities in the field of tourism. These all activities have resulted into the inflow of population from outside and neighboring regions putting more pressure on the natural environment. Sainj River Valley has experienced increase in barren, agricultural and settlement on one side and decrease in snow and forest cover overall on the other side. Because of retreating snow line, the barren land is exposed widely. Set-up of the Sainj Hydro Project in the valley in the early 21st century has amplified the infrastructural activities leading to Sainj towards urban development especially in the western part of the valley. The northern and southern part where forestland is dominating, are mostly reserved and protected forests. Although overall area of forest has decreased in the study area but there are some signs, which shows positive results of conservative efforts in the valley as small part of barren land, has changed into forest and pasture showing the ecological succession. The analysis of the LULC pattern and change done with the help geospatial techniques have helped in understanding the changing behavior of human occupancy and resource management. The study can also be productive to the decision makers in formulating further policies for the particular region knowing the fragility of the high mountainous landscape and ongoing development activities.
Acknowledgements
This work was supported by research grant given by Indian Council of Social Science Research (Doctoral Fellowship 2018-2020, File No. RFD/2018-19/GEN/GEOG/279).
Conflict of Interest
The authors do not have any conflict of interest.
Funding Sources
The author(s) received no financial support for the research, authorship, and/or publication of this article.
References
- Barreiro J. B, Li Y, Morales A, Pentland A. Globalization and the shifting centers of gravity of world's human dynamics: Implications for sustainability. Journal of Cleaner Production. 2019; 239, 117923.
CrossRef - Barreiro J. B, Wnag S, Tu J, Li Y, Menendez M. Editorial: The nexus between innovation and environmental sustainability. Frontiers on Environmental Science, Sec. Environmental Economics and Management (Research Topic: The Nexus between Innovation and Environmental Sustainability).2023; Vol. 11. https://doi.org/10.3389/fenvs.2023.1194703
CrossRef - United Nations. World Urbanization Prospects: The 2018 Revision. 2018. Retrieved from https://population.un.org/wup/Publications/Files/WUP2018-Report.pdf
- Suisse C. Global Wealth Report 2021. 2021. Retrieved from https://www.credit-suisse.com/about-us/en/reports-research/global-wealth-report.html
- Seto K. C, Güneralp B, HutyraL. R. Global forecasts of urban expansion to 2030 and direct impacts on biodiversity and carbon pools. Proceedings of the National Academy of Sciences. 2012; 109(40), 16083-16088. doi:10.1073/pnas.1211658109
CrossRef - Mountain Forum 1998. Community-based Mountain Tourism: Practices for Linking Conservation with Enterprise. Synthesisof an Electronic Conference of the Mountain Forum,April 13–May 18, 1998. Washington, DC: The MountainInstitute.
- Meyfroidt P, Bremond A, Ryan C M. Ten facts about land systems for sustainability. PNAS. 2022; Vol. 119 No. 7 https://doi.org/10.1073/pnas.2109217118
CrossRef - Lam, N.S. N. Methodologies for Mapping Land Cover/Land Use and its Change. In: Liang, S. (eds) Advances in Land Remote Sensing. Springer, Dordrecht. 2008; https://doi.org/10.1007/978-1-4020-6450-0_13
CrossRef - Byers AC. A comparative study of tourism impacts on alpine ecosystems in the Sagarmatha (Mt. Everest) National Park, Nepal and the Huascarán National Park, Peru. In J. Hill and T. Gale, eds. Ecotourism and Environmental Sustainability. Published online 2009:51-72.
- Cronin E.W. Jr. The Arun: A Natural History of the World’s Deepest Valley. The Quarterly Review of Biology. 1979; 55(3):303-303. doi:https://doi.org/10.1086/411935
- Kohler T, Maselli D. (Eds.). Mountains and Climate Change: From Understanding to Action. Bern, Switzerland: GeographicaBernensia. 2009.
- Rodríguez D. R, Bomhard B. Mapping Direct Human Influence on the World's Mountain Areas. Mt Res Dev. 2012; 32(2): 197-202.
CrossRef - Osipova E, Emslie S. M, Osti M, Murai M, Aberg U, Shadie P. IUCN World Heritage Outlook 3: A conservation assessment of all natural World Heritage sites, November 2020. Gland, Switzerland: IUCN. 2020.
CrossRef - Gazetteer of the Kangra District. Kangra Proper. Punjab Government. Vol I. Calcutta Central Press Co. LD. 5, Council House Street. 1883.
- Gaston A. J, Garson P. J, Hunter M l. The status and conservation of forest wildlife in Himachal Pradesh, Western Himalayas. Biological Conservation. 1980; 27 (4): 291-314.
CrossRef - UNESCO. Decisions adopted by the World Heritage Committee at its 38th session. Doha, Qatar: UNESCO. 2014.
- Tucker R. P. The Forests of the Western Himalayas: The Legacy of British Colonial Administration, Forest & Conservation History. July 1982; Volume 26, Issue 3: 112–123, https://doi.org/10.2307/4004579
CrossRef - Tucker R. P. The Historical Development of Human Impacts on Great Himalayan National Park. 1997. 1–56. Retrieved from http://www.greathimalayannationalpark.com/
- Chandel V. B. S, Brar K. K, Kahlon S. Land Use/Cover change and its implications for Kullu District of Himachal Pradesh, India. International Journal of Geomatics and Geosciences. 2013; 3 (3): 538-51.
- Nandy S, Singh C, K.K. Das K. K, Kingma N.C, Kushwaha S.P.S. Environmental vulnerability assessment of eco-development zone of Great Himalayan National Park, Himachal Pradesh, India. Ecological Indicators. 2015; Volume 57: 182-195,. ISSN 1470-160X, https://doi.org/10.1016/j.ecolind.2015.04.024.
CrossRef - Kaur T, Kumar R. Impact of Parbati Hydroelectric Power Project Stage-II on the Interdependence of Ethno-Botanical Resources and the Inhabitants of the Parbati Valley in Kullu District of Himachal Pradesh. Applied Ecology and Environmental Sciences. 2019; 7(4). 117-127
- NRSC. Land Use / Land Cover database on 1:50,000 scale, Natural Resources Census Project, LUCMD, LRUMG, RSAA, National Remote Sensing Centre, ISRO, Hyderabad. 2019.
- Pandey S, Wells M. Ecodevelopment Planning at India's Great Himalayan National Park for Biodiversity Conservation and Participatory Rural Development. Biodiversity and Conservation. 1997;Vol 6 (9) pp 1277-1292.
CrossRef - Census of India 2011. Himachal Pradesh District Census Handbooks. Government of India. 2011.


