Frequency and Intensity of Cyclonic Systems in CORDEX RCMs model environment under the Future Emission Scenarios
Ashutosh K Sinha1
 and Pradhan Parth Sarthi2
*
and Pradhan Parth Sarthi2
*
1
Department of Environmental Science,
Central University of South Bihar,
Gaya,
Bihar
India
2
Department of Environmental Science,
Dean, School of Earth,
Biological and Environmental Science Central University of South Bihar,
Gaya,
Bihar
India
http://dx.doi.org/10.12944/CWE.18.2.07
Copy the following to cite this article:
Sinha A. K, Sarthi P. P. Frequency and Intensity of Cyclonic Systems in CORDEX RCMs model environment under the Future Emission Scenarios. Curr World Environ 2023;18(2). DOI:http://dx.doi.org/10.12944/CWE.18.2.07
Copy the following to cite this URL:
Sinha A. K, Sarthi P. P. Frequency and Intensity of Cyclonic Systems in CORDEX RCMs model environment under the Future Emission Scenarios. Curr World Environ 2023;18(2).
Download article (pdf)
Citation Manager
Publish History

Introduction
Tropical Cyclonic Disturbances (TCDs) are one of the most potentially destructive extreme events that result in severe loss in terms of life and property. The assessment of TCDs and their impacts under the changing climate scenarios have become highly important to safeguard the life and resilience in the coastal regions. Since the ancient times, these TCDs have been known as the harbinger of destruction and chaos globally. In recent years it has been noted that, Asian regions have been more impacted by these chaotic climate disasters and further disrupt the life and livelihood in coastal regions extensively 1, 2, 3. Thus, the accurate predictions of these cyclonic activities are necessarily needed for the evacuation of the people and their belongings before their landfall. In addition, probabilistic projections for the near and far future are strongly needed to develop adaptation, preparedness and mitigation strategies under the changing climate scenarios as strength and impacts of these TCDs are likely to exacerbate with more anthropogenic emissions 4, 5.
The TCDs are, in general, characterized by a low-pressure cell with very strong counter clockwise (clockwise) wind rotations in northern (southern) hemisphere. The TCDs lead to heavy showers, gale and induce flooding of the coastal region after landfall. On an average, eighty to ninety TCDs form over the entire globe in a year while the North Indian Ocean (NIO) has around six TCDs each year 6, 7, 8. The NIO comprises of two sub-basins (lying adjacent to the Indian subcontinent as the Arabian Sea on the western and the Bay of Bengal (BoB) on the eastern boundary). The BoB generally has 3-4 times more TCDs than the AS 6, 7, 8, 9. Historically, it has been observed that out of ten deadliest TCDs recorded, seven have been formed in the BoB 10. Unfortunately, since the last two centuries, about 42% of the global TCDs-associated deaths (about 2 million) have occurred in Bangladesh only, which is landlocked with India on three sides and loosely part of the Indian subcontinent). In addition to it, the deadliest storm in recorded world history is the Bhola Cyclone which hit the Indian subcontinent (landfall in Bangladesh) in 1970. It is estimated that around 0.3 million people died, besides, it led to heavy storm surge with heights around 10.4 meters on the coast 11, 12, 13, 14. Further, Nair et al. 15 reported vulnerabilities of 370 million populace due to meteorological extremes such as TCDs in India.
Today climate models are being globally used for climate change assessment and future projections of TCDs in a greenhouse-warmed environment in global climate models (GCMs) 16, 17, 18, 19. Recently, the regional projections for TCDs in future conditions using the regional climate models (RCMs) have been carried out by many researchers across the globe 20, 21, 22, 23. Also, RCMs have been found to simulate the TCDs more realistically in comparison to the GCMs 24, 25. Also, it is worth noticing that these climate models’ accessibility and assessment are subject to high computational facilities, infrastructure, uncomplicated availabilities, and spatiotemporal evaluations. The COordinated Regional Downscaling EXperiment (CORDEX) 20, 23, 26 is one of such initiatives which facilitates very easy access to high resolution climate models to global climate research communities. The CORDEX is a globally standardized system for high resolution climate models and supported by the World Climate Research Program (WCRP) 23, 26, 27. The model simulated outputs under the CORDEX systems are obtained by dynamically downscaling the GCMs with forcings from natural and anthropogenic environmental constituents. These are high resolution outputs for different domains across the globe for past and future climatic conditions as historical and representative concentration pathways (RCPs) simulations respectively. These RCPs are trajectory pathways of the greenhouse gas concentrations (GHGs) and human induced pollutants (pollutants from anthropogenic activities, alterations in land uses [LULC]) in the atmosphere regulated by space and time, and are projected for the upcoming future condition till 2100 28, 29. The RCPs as the radiative forcing scenarios relative to the baseline of preindustrial further help in developing potential policies to combat the crisis of climate change and associated potential impacts. There are four RCPs which are considered as the representation of emission pathways in future. These include RCP2.6 (hereafter R2.6), RCP4.5 (hereafter R4.5) RCP6.0 (hereafter R6.0) and RCP8.5 (hereafter R8.5). These aforementioned RCPs show the emissions of +2.6 W/m2 post year 2100 for R2.5, +4.5 W/m2 post 2100 for R4.5, +6.0 W/m2 post 2100 for R6.0 and +8.5 W/m2 in 2100 for R8.5. Interestingly, these RCPs respond to the amount of CO2 equivalent emitted into the atmosphere. For example, 4.5 W/m2 relates to 650 ppm CO2 equivalent 23, 28, 29.
Though, there have been many studies using different models with varying configuration, parametrization and resolutions for the TCDs activities, earlier researchers find the low-resolution in model unsuitable for projection needs 4, 5, 17, 18. Thus, to understand the TCDs behavior in future climatic conditions, it becomes a necessity for investigating their frequencies and intensities under emission pathways in a possible future in the high-resolution gridded data. The present study happens to be priority study for scientific understanding as well as socioeconomic perspectives. Further, it will help in framing a baseline for potential TCDs disaster mitigation and adaptation strategies for the decision makers and policy planners. The current research analyses TCDs frequency and intensity in the upcoming future time period of 2031-2060 (upcoming next decades). It investigates the projected TCDs in two RCMs i.e., REMO2009 and RegCM4 under the high and low RCPs (as REMO2009 under R4.5 (REMO-4.5), RegCM4 under R4.5 (RegCM-4.5), REMO2009 under R8.5 (REMO-8.5) and RegCM4 under R8.5 (RegCM-8.5)) which has not been evaluated yet over the BoB. Further, zone wise assessment of sea level pressure (SLP) over the BoB is investigated to check any linkage with TCDs activities over the BoB.
Material and Methods
Study Area
India besides Bangladesh is one of the most impacted regions 9, 13 across the globe harboring highly intense TCDs due to BoB on its eastern boundaries. The TCDs developing over the BoB heavily impact the coastal societies residing on the east coastal India, and adjoining nations Bangladesh and Myanmar. The low-lying topography, flat coastlines, and shallow bathymetry of BoB besides a very dense population 12, 14, 20 likely intensify the adverse impact of BoB generated TCDs over these regions. Thus, we have selected the BoB as our study area.
Collection of Data
For accessing the TCDs in model simulated climatic conditions (future), we have acquired model outputs from two constituent RCMs of CORDEX which are REMO2009 (GCM as MPI-ESM-LR) 27, 31 and RegCM4.4 (GCM as MPI-ESM-MR) 20, 32 [hereafter RegCM4] from the Centre for Climate Change Research (CCCR); IITM Pune, India. The REMO2009 provides RCP pathways simulated data from 2006 to 2100 while RegCM4 from 2006-2099 at horizontal resolutions of 0.44°×0.44°. For our study with regard to future projections in upcoming decades, a time period of 2031-2060 as near future time period is considered. The present study used RCPs of Intermediate Emission (IE; R4.5) of +6 W/m2 and R8.5 which is High Emissions (HE) of +8 W/m2 of CO2 equivalent into the atmosphere.
Method
The TCDs detection in the model is based on algorithm using steepest descent path detection scheme leading to a same SLP minimum as defined by Reale and Lionello 31, Reboita et al. 32, and Lionello et al. 33. The detection algorithm partitions the SLP into fields of depressions as all TCDs initiate as depressions with some evolving to higher intensities while others dissipating as depressions only. The SLP minima so obtained is checked in the 2x2 grid box i.e., SLP at the candidate TCD minima grid point (candidate location) neighbored by the 8 nearest grid points (i.e., surrounding locations beside the candidate location) must be 2 hPa lower than the neighboring grid points. The location at which the SLP minima is observed, is thus considered as the center of the TCD. For the trajectory (path) of TCD, all such grid points (locations with minimum SLPs) crossed are considered till the TCD dissipates. The magnitude of the minimum SLP (in hPa) reached during the entire lifetime of a TCD is taken as Minimum Central Pressure (MCP) which is later noted as the intensity of a TCD during its lifetime 21, 22.
Results and Discussion
Fig.1 shows occurrence frequency of the TCDs (hereafter TCDF) for the near future conditions 2031-2060 in the models REMO2009 and RegCM4 under the RCPs R4.5 and R8.5. It is found that post-monsoon season has slightly higher TCDFs in comparison to the pre-monsoon season under both emission pathways in the models (Fig.1). The models REMO2009 and RegCM4 show high frequencies in post-monsoon (pre-monsoon) under intermediate emissions i.e., R4.5 (high emissions i.e., R8.5). The high TCDF projected in the pre-monsoon season is likely due to the increased TCDs activities in March and April. Glancing at the individual months of pre-monsoon season (i.e., March, April, and May [interchangeably M-A-M]) and post-monsoon season (i.e., October, November, and December [interchangeably O-N-D]), we find high emission scenarios (R8.5) having more TCDs in the M-A-M months. Interestingly, the maximum TCDF in pre-monsoon is simulated by RegCM4 as compared to REMO2009 under both RCPs. On the contrary, the intermediate emission pathway i.e., R4.5 shows more TCD activities in post-monsoon months compared to R8.5. The overall TCDFs simulated by both models in the post-monsoon months vary in between 0.6 to 1 TCD/year. The later post-monsoon month in general has slightly low TCDF in comparison to early and middle post-monsoon months. Further, it is worth noticing that the BoB has a unique feature of having two distinct TCDs occurrence peaks 6, 8, 22, 23. The BoB is characterized with slightly dominant TCDs activities in the O-N-D season as compared to the M-A-M season as evident in the Fig.1 and noted by earlier researchers 6, 8, 21, 22, 23, 34.
The overall findings show that intermediate emissions (i.e., R4.5) have more TCDs as compared to high emissions. Further, we see that less TCDs active months of pre-monsoon such as March and April too have increased TCDs occurrences as noted with varying frequencies ~0.4-0.9 TCDs/year. The slightly high frequencies during post-monsoon months show consistency with earlier researches 9, 21, 34. In the future conditions represented under the RCPs R4.5 and R8.5, more TCDs is seen in the pre-monsoon season in both models i.e., REMO2009 and RegCM4. The differences in simulated results of both models are possibly due to differences in model dynamic core, physical parametrization schemes, topography differences in the model as well as transferability from their home domain (domain of model development and testing) 4, 17, 18, 19, 20, 23, 27, 31, 33. Our results are in agreement with the previous researches on TCDF in future climatic conditions 21, 23. The alterations in magnitudes of TCDF are likely attributed to the possible changes in the TCDs genesis variables which produce conducive conditions for cyclogenesis over the BoB 18, 19, 22, 25,34.
Fig.2 shows the monthly percentage distribution of TCDs relative to number of TCDs (NTCDs) in M-A-M and O-N-D season (respectively in Fig.2a and Fig.2b). In the pre-monsoon season, it is evident that May month has more TCDs distribution in comparison to March and April months in both RCMs under both RCPs.
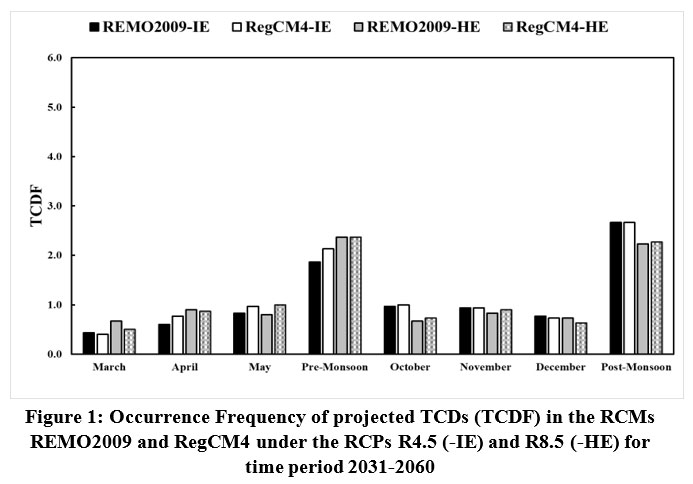 | Figure 1: Occurrence Frequency of projected TCDs (TCDF) in the RCMs REMO2009 and RegCM4 under the RCPs R4.5 (-IE) and R8.5 (-HE) for time period 2031-2060
|
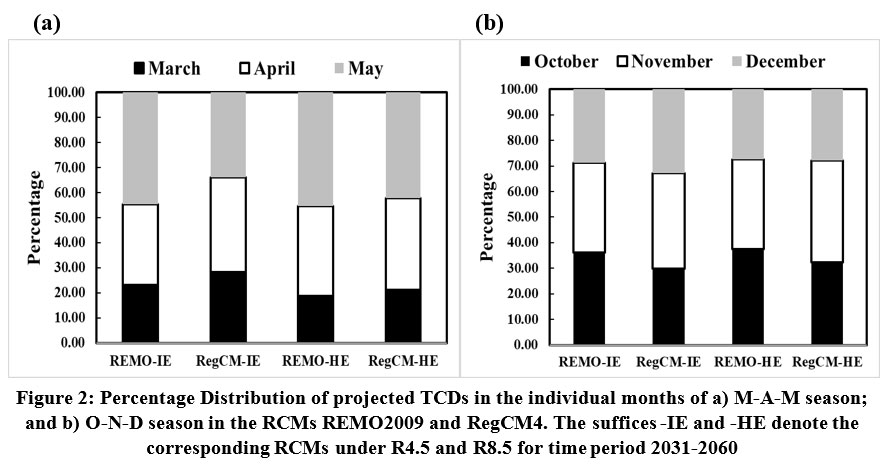 | Figure 2: Percentage Distribution of projected TCDs in the individual months of a) M-A-M season; and b) O-N-D season in the RCMs REMO2009 and RegCM4. The suffices -IE and -HE denote the corresponding RCMs under R4.5 and R8.5 for time period 2031-2060.
|
Under both the RCPs i.e., R4.5 and R8.5 pathway simulations, we note REMO2009 simulating around 45% TCDs in May while RegCM4 slightly less TCDs in May (34% and 45% under R4.5 and R8.5 respectively). Interestingly, the high percentage (32%-38%) is noted in April under both RCPs and RCMs which possibly leads to increase in TCDFs during the pre-monsoon season. The March month shows more TCDs simulated under RCP4.5 in comparison to RCP8.5 in both models. Considering the post-monsoon months, we see October with relatively more TCDs in post-monsoon season in REMO2009 while RegCM4 is found with more TCDs in November under R4.5 and R8.5 respectively. In addition to it, late post-monsoon month i.e., December is also seen with considerable percentage distribution (more than 25%).
 | Figure 3: Intensity of projected TCDs (MCP hitting during the lifetime of each TCD) in the RCMs REMO2009 and RegCM4 under the RCPs R4.5 and R8.5 during time period 2031-2060 in months of pre-monsoon in upper row as a) March; b) April; c) May; and post-monsoon in lower row as d) October; e) November; and f) December
|
Moreover, we note that RegCM4 under RCP4.5 has highest percentage distribution in December. It appears that RCMs under both RCPs have similar percentage distribution as earlier researches on TCDs distribution for past time period 8, 18, 22, 23. Further the results of our study are in line previous studies on future time 23 with dominance of May in M-A-M season while early and mid O-N-D months i.e., October and November having dominance in the O-N-D season. The results show that in near future time period also, the projected TCDs will have two distinct peaks (i.e., bimodal behavior) with primary peak in post-monsoon months and secondary in the pre-monsoon months 8, 18, 21, 23 over the BoB. This bimodal behavior of TCDs activities over the BoB in both models during past time scale has been earlier well noted by Vishnu et al. 22 for RegCM4 and Sinha et al. 36for REMO2009. It is noteworthy that both the models are attributed with high false alarms in the historical time however REMO2009 seems to have higher hit rate than the RegCM4 22, 23, 36 in past. Further, it is worth mentioning that changes in TCDs frequencies as compared to TCDs occurrences in past environmental conditions are at present beyond the scope of current research. However, we infer that in comparison to previous findings 22, 36 for RegCM4 and REMO2009 respectively, the changes in the TCDFs are likely due to alterations in the genesis conditions 23.
Further, we assessed the intensity of TCDs during future time period 2031-2060 in the RCMs REMO2009 and RegCM4 under both RCPs R4.5 and R8.5. In general, the TCDs intensity classification is carried out on the basis of wind speed at 10 m around the TCD center and denoted as Maximum Sustained Wind Speed (MSSW). Additionally, this MSSW is also associated with the difference between outer and central pressure of TCDs 21, 22, 34 and widely used to categorize their intensity. Higher the rate of the drop in central pressure, the MSSW will be stronger, and corresponds to the stronger TCDs 21, 22. It seems that models REMO2009 and RegCM4 at higher resolution (~ 50x50 km) can reproduce the drop in central pressure for the considered period. It is well supported by research that the models at resolutions of 50-100?km are able to reproduce the deficit in central pressure 4, 5, 17, 18, 21, 22, 25. In the current analysis, the lower values of central pressure in May (pre-monsoon month) and in October and November (post-monsoon moths) suggest the possibility of stronger MSSW and more intense TCDs 21, 22, 34. In addition, the RegCM4 simulates TCDs with more intensity in comparison to REMO2009, however REMO2009-8.5 is also found with some intense TCDs in month of April, May and October. The intensity is intermittently associated with the wind speed thus low MCPs indicate possibilities of high MSSW. Moreover, we see increased intensities in the future projected TCDs as depicted by the models in comparison to previous researches on past periods in high resolution climate models 21, 22, 23, 36. For instance, in the future projected TCDs, RegCM4 shows highest intensity shows 942 hPa and 950 hPa under R4.5 and R8.5 while REMO2009 shows 966 hPa and 950 hPa under R4.5 and R8.5. It is evident that TCDs under R4.5 have more intensity in model RegCM4 while slightly weak intensity in REMO2009. The RCPs as representative conditions of global changes in climate and atmosphere show variations in their assessment over the same domain 17, 18, 23.
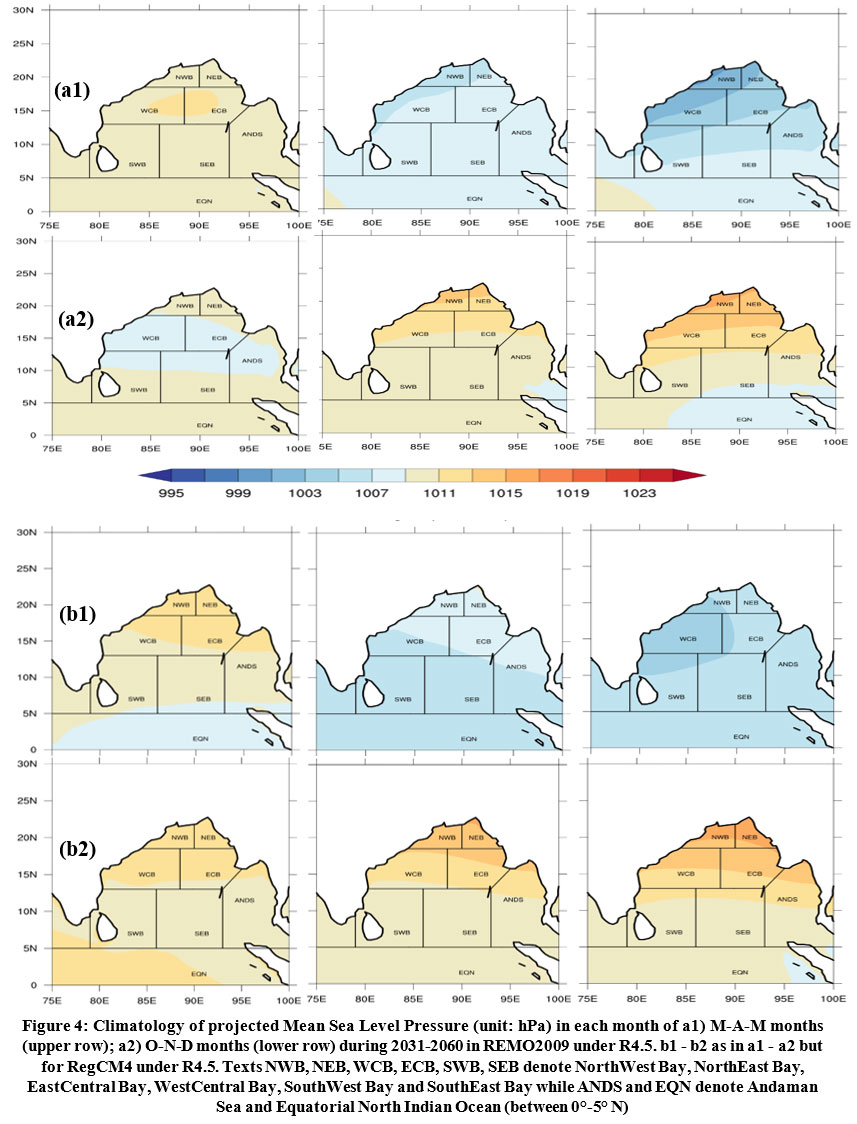
Additionally, the variability in the SLP climatology in RCMs is investigated for the M-A-M and O-N-D months for assessing projected SLP conditions during 2031-2060 in Figs.4-5. The SLP is one of the precursor variables with identification criteria for the TCDs as TCDs are associated with lowering of SLP 36. Fig.4(a1-a2) and Fig.4(b1-b2) show SLP in REMO2009 and RegCM4 under R4.5 while Fig.5(a1-a2) and Fig.5(b1-b2) show SLP under R8.5 in REMO2009 and RegCM4 respectively. For assessing the SLP over BoB and its role as possible precursor, the BoB is classified into six zones namely NorthWest Bay (NWB), NorthEast Bay (NEB), WestCentral Bay (WCB), EastCentral Bay (ECB), SouthWest Bay (SWB) and SouthEast Bay (SEB) 35, 36. The overall results show that both models under both RCPs produce decreased SLP in May month indicating possibilities of highly intense TCDs in the month. The BoB shows minimum SLP climatology in pre-monsoon as 1004 hPa, 1005 hPa, 1003 hPa and 1004 hPa in future conditions of REMO2009-4.5, RegCM4-4.5, REMO2009-8.5 and RegCM4-8.5 respectively. Interestingly all these minimum SLPs are observed in month of May which has high intense TCDs as low SLPs are more favorable for TCDs activities 21, 22, 23, 34.
In the post-monsoon climatology, we see minimum SLPs in October month as compared to rest months i.e., November and December. The minimum SLP climatology is found as 1009 hPa in RCP4.5 and 1011 hPa in RCP8.5 in both models REMO2009 and RegCM4. Considering the zones in May month in both models under both RCPs, we find low SLP in northern (NWB, NEB), central zones (WCB, ECB) as compared to southern zones (SWB, SEB). Similarly, the months with higher (lower) SLP are found high (less) MCP retaining TCDs (Figs.3-5). For instance, in the months of December and March in general, the BoB is observed with low TCDF as well as low intensity i.e., high MCP (Fig.1 and Figs.4-5) 23. The SLP in both RCPs show meridional decrease in SLP from northern zones to southern zones in months of March and December which points that more TCDs activities (genesis) will be possibly near the southern zones (SWB and SEB). We also find homogeneity in the SLP distribution among zones in the month of October which might be a possible cause for high TCDs activities in month of October followed by November 21, 22, 34. The November month has little variability in the SLP distributions among zones under both RCPs in both RCMs. Interestingly, we find RegCM4 under R4.5 with low SLP in November in comparison to November months of rest pathway simulations.
 | Figure 4: Climatology of projected Mean Sea Level Pressure (unit: hPa) in each month of a1) M-A-M months (upper row); a2) O-N-D months (lower row) during 2031-2060 in REMO2009 under R4.5. b1 - b2 as in a1 - a2 but for RegCM4 under R4.5. Texts NWB, NEB, WCB, ECB, SWB, SEB denote NorthWest Bay, NorthEast Bay
|
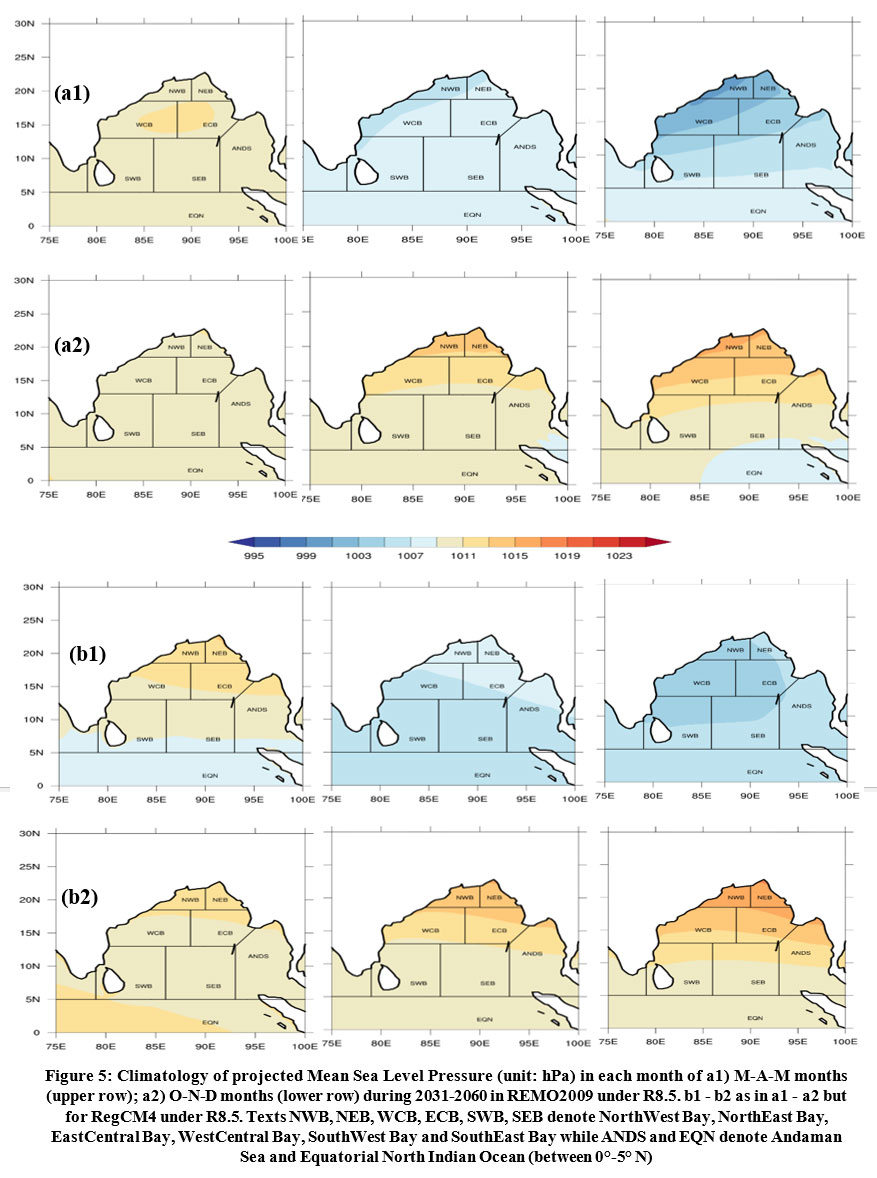 | Figure 5: Climatology of projected Mean Sea Level Pressure (unit: hPa) in each month of a1) M-A-M months (upper row); a2) O-N-D months (lower row) during 2031-2060 in REMO2009 under R8.5. b1 - b2 as in a1 - a2 but for RegCM4 under R8.5.
|
Conclusions
A large group of researchers today are actively involved in the study over the TCDs for their assessment in past as well as the future climate conditions. Also, the operational forecasters have been studying the ongoing TCDs events in the tropical oceanic basins. In terms of the Climate model studies for the projection in near and far future, performance of fine resolution climate models needs to be evaluated on the local basis. The present study assesses the frequency and intensity of TCDs in future time period (upcoming decades 2031-2060) under the intermediate and high emission trajectories (R4.5 and R8.5 respectively). The TCDF satisfactorily shows the bimodal behavior of BoB originated TCDs. The results project that more TCDs are likely to form in upcoming near future with increased intensity of TCDs. The highly intense TCDs (low MCP) will possibly more develop in month of May followed by April. We do note that post-monsoon season despite having more TCDs will have less intense TCDs than the May (pre-monsoon season). Additionally zone wise assessment of SLP is also carried out to check any possible linkages with TCDs and SLP which shows months with relatively low SLP have more intense TCDs. Also, it is to be noted that RCP4.5 has more TCDs activities in comparison to RCP8.5.
Though the present study assesses the TCDs activities using model simulated SLP, a further comprehensive approach is required to study the TCDs behaviors and their genesis phenomena as TCDs depend on a number of meteorological variables which are yet to be assessed. Alterations in the magnitudes of those meteorological variables will likely alter the behavior of TCDs and their impacts.
With rising concerns of GHGs emission and warming scenarios, it is likely that BoB will have alterations in the TCDs behavior. Since model reproduces frequencies and intensity of TCDs fairly well, more investigations are required for reusing the model outputs in the development of warning systems, tackling the crisis of climate change and policy makings for mitigation and adaptation needs.
Acknowledgement
We would like to thank the Centre for Climate Change Research (CCCR); Indian Institute of Tropical Meteorology (IITM), Pune, India for the data provided. Also, we acknowledge the Dept. of Environmental Science, Central University of South Bihar, Gaya-824236, India.
Conflict of Interest
The authors declare no conflict of interest in the completion of the work.
Funding Sources
This work is part of the Ph.D. research of the First Author. The author received no financial support for his Ph.D. research, authorship, and/or publication of this article.
References
- Yadav DK, Barve A. Analysis of socioeconomic vulnerability for cyclone-affected communities in coastal Odisha, India. International Journal of Disaster Risk Reduction. 2017;22:387-396. doi:10.1016/j.ijdrr.2017.02.003
CrossRef - Hoque MAA, Phinn S, Roelfsema C, Childs I. Tropical cyclone disaster management using remote sensing and spatial analysis: A review. International Journal of Disaster Risk Reduction. 2017;22:345-354. doi:10.1016/j.ijdrr.2017.02.008
CrossRef - Parvin GA, Sakamoto M, Shaw R, Nakagawa H, Sadik MS. Evacuation scenarios of cyclone Aila in Bangladesh: Investigating the factors influencing evacuation decision and destination. Progress in Disaster Science. 2019;2:100032. doi:10.1016/j.pdisas.2019.100032
CrossRef - Vecchi GA, Delworth TL, Murakami H, Underwood SD, Wittenberg AT, Zeng F, Zhang W, Baldwin JW, Bhatia KT, Cooke W, He J, Kapnick SB, Knutson TR, Villarini G, van der Wiel K, Anderson W, Balaji V, Chen J, Dixon KW, Gudgel R, Harris LM, Jia L, Johnson NC, Lin SJ, Liu M, Ng CHJ, Rosati A, Smith JA, Yang X. Tropical cyclone sensitivities to CO2 doubling: roles of atmospheric resolution, synoptic variability and background climate changes. Clim Dyn. 2019;53(9):5999-6033. doi:10.1007/s00382-019-04913-y
CrossRef - Knutson T, Camargo SJ, Chan JCL, Emanuel K, Ho CH, Kossin J, Mohapatra M, Satoh M, Sugi M, Walsh K, Wu L. Tropical cyclones and climate change assessment: part ii: projected response to anthropogenic warming. Bulletin of the American Meteorological Society. 2020;101(3):E303-E322. doi:10.1175/BAMS-D-18-0194.1
CrossRef - Singh OP, Ali Khan TM, Rahman MdS. Changes in the frequency of tropical cyclones over the North Indian Ocean. Meteorology and Atmospheric Physics. 2000;75(1-2):11-20. doi:10.1007/s007030070011
CrossRef - Mohapatra M, Bandyopadhyay BK, Tyagi A. Best track parameters of tropical cyclones over the North Indian Ocean: a review. Nat Hazards. 2012;63(3):1285-1317. doi:10.1007/s11069-011-9935-0
CrossRef - Li Z, Yu W, Li T, Murty VSN, Tangang F. Bimodal character of cyclone climatology in the bay of bengal modulated by monsoon seasonal cycle*. Journal of Climate. 2013;26(3):1033-1046. doi:10.1175/JCLI-D-11-00627.1
CrossRef - McPhaden MJ, Foltz GR, Lee T, Murty VSN, Ravichandran M, Vecchi GA, Vialard J, Wiggert JD, Yu L. Ocean-atmosphere interactions during cyclone nargis. Eos Trans AGU. 2009;90(7):53-54. doi:10.1029/2009EO070001
CrossRef - WMO. Notable Tropical Cyclones. https://public.wmo.int/en/our-mandate/focus-areas/natural-hazards-and-disaster-risk-reduction/tropical-cyclones/Notable-tcs. Accessed 08-08-2022.
- Peduzzi P, Chatenoux B, Dao H, De Bono A, Herold C, Kossin J, Mouton F, Nordbeck O. Global trends in tropical cyclone risk. Nature Clim Change. 2012;2(4):289-294. doi:10.1038/nclimate1410
CrossRef - Raghavan S, Rajesh S. Trends in tropical cyclone impact: a study in andhra pradesh, india: a study in andhra pradesh, india. Bull Amer Meteor Soc. 2003;84(5):635-644. doi:10.1175/BAMS-84-5-635
CrossRef - Islam T, Peterson RE. Climatology of landfalling tropical cyclones in Bangladesh 1877–2003. Nat Hazards. 2009;48(1):115-135. doi:10.1007/s11069-008-9252-4
CrossRef - Dube SK, Jain I, Rao AD, Murty TS. Storm surge modelling for the bay of bengal and arabian sea. Nat Hazards. 2009;51(1):3-27. doi:10.1007/s11069-009-9397-9
CrossRef - Nair SS, Gupta AK, Röder K. Databases and statistics for disaster risk management. New Delhi. 2013
- Manabe S, Holloway JL, Stone HM. Tropical circulation in a time-integration of a global model of the atmosphere. J Atmos Sci. 1970;27(4):580-613. doi:10.1175/1520-0469(1970)027<0580:TCIATI>2.0.CO;2
CrossRef - Camargo SJ, Barnston AG, Zebiak SE. A statistical assessment of tropical cyclone activity in atmospheric general circulation models. Tellus A. 2005;57(4):589-604. doi:10.1111/j.1600-0870.2005.00117.x
CrossRef - Camargo SJ, Giulivi CF, Sobel AH, Wing AA, Kim D, Moon Y, Strong JDO, Del Genio AD, Kelley M, Murakami H, Reed KA, Scoccimarro E, Vecchi GA, Wehner MF, Zarzycki C, Zhao M. Characteristics of model tropical cyclone climatology and the large-scale environment. Journal of Climate. 2020;33(11):4463-4487. doi:10.1175/JCLI-D-19-0500.1
CrossRef - Murakami H, Sugi M, Kitoh A. Future changes in tropical cyclone activity in the North Indian Ocean projected by high-resolution MRI-AGCMs. Clim Dyn. 2013;40(7-8):1949-1968. doi:10.1007/s00382-012-1407-z
CrossRef - Giorgi F, Coppola E, Solmon F, Mariotti L, Sylla M, Bi X, Elguindi N, Diro G, Nair V, Giuliani G, Turuncoglu U, Cozzini S, Güttler I, O’Brien T, Tawfik A, Shalaby A, Zakey A, Steiner A, Stordal F, Sloan L, Brankovic C. RegCM4: model description and preliminary tests over multiple CORDEX domains. Clim Res. 2012;52:7-29. doi:10.3354/cr01018
CrossRef - Parth Sarthi P, Agrawal A, Rana A. Possible future changes in cyclonic storms in the bay of bengal, india under warmer climate: possible future changes in cyclonic storms in bay of bengal. Int J Climatol. 2015;35(7):1267-1277. doi:10.1002/joc.4053
CrossRef - Vishnu S, Sanjay J, Krishnan R. Assessment of climatological tropical cyclone activity over the north Indian Ocean in the CORDEX-South Asia regional climate models. Clim Dyn. 2019;53(7-8):5101-5118. doi:10.1007/s00382-019-04852-8
CrossRef - Torres-Alavez JA, Glazer R, Giorgi F, Coppola E, Gao X, Hodges KI, Das S, Ashfaq M, Reale M, Sines T. Future projections in tropical cyclone activity over multiple CORDEX domains from RegCM4 CORDEX-CORE simulations. Clim Dyn. 2021;57(5-6):1507-1531. doi:10.1007/s00382-021-05728-6
CrossRef - Emanuel K, Sundararajan R, Williams J. Hurricanes and global warming: results from downscaling ipcc ar4 simulations. Bull Amer Meteor Soc. 2008;89(3):347-368. doi:10.1175/BAMS-89-3-347
CrossRef - Bender MA, Knutson TR, Tuleya RE, Sirutis JJ, Vecchi GA, Garner ST, Held IM. Modeled impact of anthropogenic warming on the frequency of intense atlantic hurricanes. Science. 2010;327(5964):454-458. doi:10.1126/science.1180568
CrossRef - Gutowski Jr. WJ, Giorgi F, Timbal B, Frigon A, Jacob D, Kang HS, Raghavan K, Lee B, Lennard C, Nikulin G, O’Rourke E, Rixen M, Solman S, Stephenson T, Tangang F. Wcrp coordinated regional downscaling experiment (Cordex): a diagnostic mip for cmip6. Geosci Model Dev. 2016;9(11):4087-4095. doi:10.5194/gmd-9-4087-2016
CrossRef - Jacob D, Elizalde A, Haensler A, Hagemann S, Kumar P, Podzun R, Rechid D, Remedio A R, Saeed F, Sieck K and Teichmann C. Assessing the transferability of the regional climate model REMO to different coordinated regional climate downscaling experiment (CORDEX) regions. Atmosphere (Basel). 2012;3(181–199)
CrossRef - Moss R, Intergovernmental Panel on Climate Change, eds. Towards New Scenarios for Analysis of Emissions, Climate Change, Impacts, and Response Strategies: IPCC Expert Meeting Report: 19-21 September, 2007, Noordwijkerhout, The Netherlands. Intergovernmental Panel on Climate Change; 2008.
- van Vuuren DP, Stehfest E, den Elzen MGJ, Kram T, van Vliet J, Deetman S, Isaac M, Klein Goldewijk K, Hof A, Mendoza Beltran A, Oostenrijk R, van Ruijven B. RCP2.6: exploring the possibility to keep global mean temperature increase below 2°C. Climatic Change. 2011;109(1):95. doi:10.1007/s10584-011-0152-3
CrossRef - Tasnim KM, Shibayama T, Esteban M, Takagi H, Ohira K, Nakamura R. Field observation and numerical simulation of past and future storm surges in the Bay of Bengal: case study of cyclone Nargis. Nat Hazards. 2015;75(2):1619-1647. doi:10.1007/s11069-014-1387-x
CrossRef - Reale M, Lionello P. Synoptic climatology of winter intense precipitation events along the Mediterranean coasts. Nat Hazards Earth Syst Sci. 2013;13(7):1707-1722. doi:10.5194/nhess-13-1707-2013
CrossRef - Reboita MS, Reale M, da Rocha RP, Giorgi F, Giuliani G, Coppola E, Nino RBL, Llopart M, Torres JA, Cavazos T. Future changes in the wintertime cyclonic activity over the CORDEX-CORE southern hemisphere domains in a multi-model approach. Clim Dyn. 2021;57(5-6):1533-1549. doi:10.1007/s00382-020-05317-z
CrossRef - Lionello P, Dalan F, Elvini E. Cyclones in the Mediterranean region: the present and the doubled CO2 climate scenarios. Clim Res. 2002;22:147-159. doi:10.3354/cr022147
CrossRef - Gray WM. Global view of the origin of tropical disturbances and storms. Mon Wea Rev. 1968;96(10):669-700. doi:10.1175/1520-0493(1968)096<0669:GVOTOO>2.0.CO;2
CrossRef - Lubna K, Kobra K, Saifullah ASM, Mallik MAK, Hassan SMQ, Uddin MJ, Diganta MM, Muktadir MG. Spatiotemporal Analysis of Sea Surface Temperature in the Bay of Bengal. T. Atmos. 2017;7(98-103)
CrossRef - Sinha AK, Sarthi PP, Kumar P. Revisiting the Precursors of Cyclonic Systems in the CORDEX RCM REMO2009 Simulations. Pure Appl. Geophys. 2022; https://doi.org/10.1007/s00024-022-03202-w
CrossRef


