Geospatial Illustration of Groundwater Potential Zone in Pandavapura Taluk of Mandya District, India.
Madhu Ramesh
*
 , Puttamadaiah Madesha
, Shashikumar Chikkanna
, Darshan Madesh Shobha
and Suryakanta Rout
, Puttamadaiah Madesha
, Shashikumar Chikkanna
, Darshan Madesh Shobha
and Suryakanta Rout
1
Department of Studies in Earth Science,
Manasagangotri,
University of Mysore,
Karnataka
India
http://dx.doi.org/10.12944/CWE.18.2.23
Copy the following to cite this article:
Ramesh M, Madesha P, Chikkanna S, Shobha D. M, Rout S. Geospatial Illustration of Groundwater Potential Zone in Pandavapura Taluk of Mandya District, India. Curr World Environ 2023;18(2). DOI:http://dx.doi.org/10.12944/CWE.18.2.23
Copy the following to cite this URL:
Ramesh M, Madesha P, Chikkanna S, Shobha D. M, Rout S. Geospatial Illustration of Groundwater Potential Zone in Pandavapura Taluk of Mandya District, India. Curr World Environ 2023;18(2).
Download article (pdf) Citation Manager Publish History

Introduction
Water is an essential component of life and must be provided in adequate amounts to meet the needs of agricultural, domestic, industrial, and the ecosystem. Groundwater is a vital natural asset that is indispensable to human wellbeing and economic growth. Due to its continued availability and superior quality, it is a significant source of supply in various rural and urban areas around the globe1. In a semi-arid region like Pandavapura, groundwater plays a significant role in domestic and irrigation purposes. Although a significant portion of the region is devoted to farming due to insufficient surface water availability, groundwater is extensively used for these purposes. Groundwater fluctuation is substantial, where recharge is regulated by monsoon rainfall (June to October) and over-pumping in the pre-monsoon period (February–May), the inappropriate use of groundwater has led to water crisis issue identifying the groundwater potential zone is required for improved abstraction. Usually, Geomorphology, lineaments, lithology, slope, soil, LuLc, and drainage all influence groundwater occurrence. A Geographic Information System (GIS) could be utilized efficiently to integrate different hydrogeological concepts objectively and evaluate individuals systematically to illustrate potential groundwater zone. The current investigation aim to decipher potential areas of groundwater in Pandavapura taluk by applying geospatial techniques using the AHP technique and to validate the results with groundwater level.
Area of Investigation
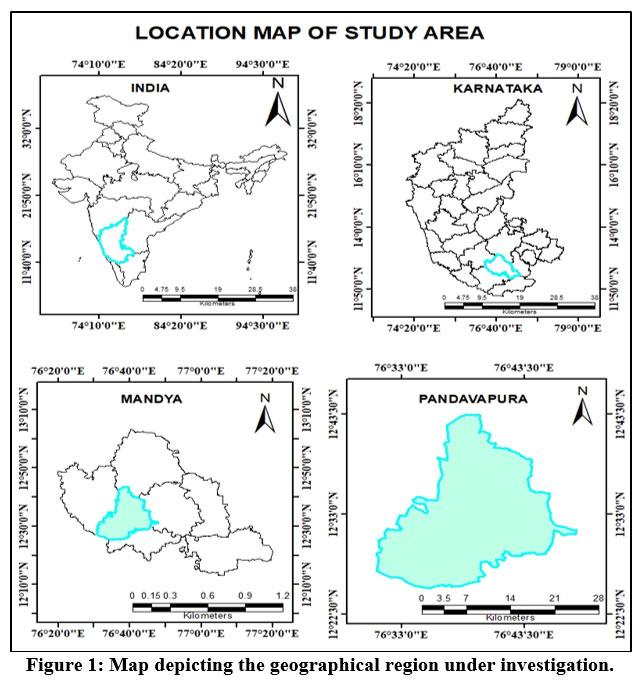
The study site of Pandavapura, which is in the Mandya district of Karnataka state, is located between longitude 76°36’-76°38’ E and latitudes 12°25’-12°43’ N with an area extent of 529.9 sq. kms. comes under Toposheets number 57D/10, 57D/11 and 57D/14 which Survey of India (SOI) published. The Pandavapura taluk enjoys a sub-tropical climate, and the whole taluk is a semi-arid region. The area experiences summer from February-may and winter from mid-November-mid February. The rainfall season is from June to September. The area's temperature ranges from 160C to 350C, and the average rainfall of the area is 650mm and terrain of Pandavapura is composed of granite, gneissic rock, and schist. (Fig.1).
 | Figure 1: Map depicting the geographical region under investigation.
|
Materials and Methodology
In this study, seven different layer were considered: Geomorphology, lithology, soil type, lineament density, land use/land cover, drainage density and slope. All these maps were collected from a different source and worked within the GIS system to create a database. The Karnataka State Remote Sensing Application Center (KSRSAC) provided the base map, geomorphology, and lithology maps. The drainage density, slope and lineament density maps were generated utilizing Digital Elevation Model data obtained from the Shuttle Radar Topography Mission (SRTM) through the United States Geological Survey Earth Explorer (earthexplorer.usgs.gov) were utilized. The SRTM data had a spatial resolution of 30 meters. In addition, line density tools are employed to develop drainage density and lineament density in Arc GIS 10.8. The soil maps were obtained from NBSS. LULC maps were generated from LISS-iv images at 5.8m resolution. All these layers are geocoded using the projection coordinate system UTM-WGS 1984, northern hemisphere 44. Weights have been assigned to particular themes, and ratings have been given for each feature within the theme depending upon its significance of groundwater. These scores are then incorporated into the attribute table for each thematic map The seven maps were transformed into vector format and Overlay using the Union tool in Arc GIS 10.8. The output of this process was a combination of polygons and data associated with all coverages, which created a layer outlining the groundwater potentiality in the region under investigation and from the minor irrigation and groundwater directorate gathered the groundwater level information to validate the project.
Table 1: An AHP-based Pairwise Comparison Matrix of seven layers was developed to evaluate potential groundwater zones.
Factor | Geomorphology | Lineament Density | Lithology | Slope | Soil | Lule | Drainage Density | Weight |
Geomorphology | 7 | 6 | 5 | 4 | 3 | 2 | 1 | 0.38 |
Lineament Density | 7/2 | 6/2 | 5/2 | 4/2 | 3/2 | 2/2 | 1/2 | 0.19 |
Lithology | 7/3 | 6/3 | 5/3 | 4/3 | 3/3 | 2/3 | 1/3 | 0.12 |
Slope | 7/4 | 6/4 | 5/4 | 4/4 | 3/4 | 2/4 | 1/4 | 0.10 |
Soil | 7/5 | 6/5 | 5/5 | 4/5 | 3/5 | 2/5 | 1/5 | 0.08 |
Lule | 7/6 | 6/6 | 5/6 | 4/6 | 3/6 | 2/6 | 1/6 | 0.066 |
Drainage Density | 7/7 | 6/7 | 5/7 | 4/7 | 3/7 | 2/7 | 1/7 | 0.064 |
In the matrix involves analyzing thematic maps and assigning numerical values to represent the priority for groundwater potentiality mapping. A ranking of 7 is given for the highest priority, while 1 is the lowest. The weights of each groundwater governing parameter can be determined by summing up the values in each column of the matrix and dividing the number of factors by the sum of its respective column.
Example :Geomorphology =7+(7/2)+(7/3)+(7/4)+(7/5)+(7/6)+(7/7)
=18.15
Dividing the total number of factors 7 by the total summed value of its column 18.5 =7/18.15 =0.3856 =0.38
Likewise, the weighting factors are computed for the remaining factors.(Table 1)
Result and Discussion
Geomorphology
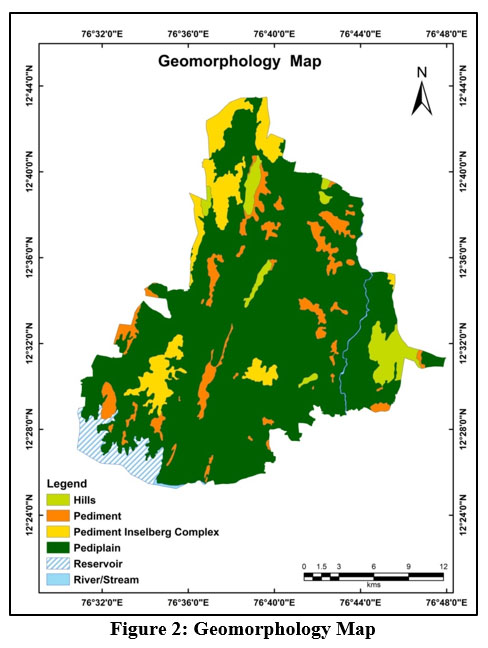
Geomorphological elements like pediments, pediment inselberg complex, pediplain, hills, reservoirs, rivers, and all influence drainage patterns runoff, stream course, and infiltration rate, in turn, the region's groundwater availability2. Over 75.8% of the region is characterized by pediplain, which is formed due to weathering of rocks. The groundwater potential in this area is good. Pediment is the erosional feature developed due to weathering of hills which has a moderate slope. An Area over 7.02% is covered by pediments having moderate groundwater potentiality. The pediment inselberg complex is dotted with some inselberg that cannot be separated and mapped as individual units with moderate groundwater potentiality. Reservoirs are established in the southwestern region, with good groundwater potentiality. The southern portion of the region exhibits signs of rivers and streams, while certain areas demonstrate excellent potential for groundwater. (Fig. 2).
 | Figure 2: Geomorphology Map
|
Lineament Density
Intersections of geological features like lineament suitable for groundwater replenishment, and the concentration of groundwater diminishes with distance from lineaments hence the high lineament density is beneficial for groundwater potentiality3. The lineament density ranged from 0.0001 to 0.36 km/km² and was divided into five groups: 0.001-0.005, 0.006-0.008, 0.009-0.013, 0.014-0.021, 0.022-0.36 representing very low, low, moderate, high and very high respectively. Therefore very high densities of lineament were found to have good potentiality for groundwater. Thus the areas with a high density of lineaments given a higher rating subsequently, the low lineament density had the poorest potential and was unsuitable for groundwater withdrawal so those with a low density given a lower rating. (Fig. 3)
 | Figure 3: Lineament Density Map
|
Lithology
The properties of various water-bearing lithologic formations influence groundwater occurrence and transport4. The primary geological formation of this area includes migmatites & granodiorite tonalite gneiss (75.9%), pink & grey granite (15.5%), metaultramafite (4.7%), and also amphibolitic meta pelitic schist (1.9%) of archean age and 1.9% metabasalt and tuff of archean to proterozoic age. The permeability of the subsurface is governed by the rock kind present and can influence groundwater flow. The study area is composed of solid rock, which lacks primary porosity, Secondary porosity, however, is a major factor in groundwater recharging. The metaultramafite and granite have poor groundwater potentiality. Schist, metabasalt, and tuff have moderate groundwater potentiality. The fractured zones and contours in the gneissic formation suggest that the area has prominent potential for groundwater. (Fig. 4)
 | Figure 4: Lithology Map
|
Slope
A slope is just an elevation change of the ground; consequently, the water motion is influenced by gravity impact5. The slope represents elevation change and affects land stability in an area. In the area of research, the slope ranged from 0-49.150. This was reclassified into five classes: 0-10 Flat, 1-30 Gentle, 3-50 Moderate, 5-150 Steep, and 15-490 Very steep. The slope significantly influences groundwater potentiality as the steeper the angle, the more runoff and less infiltration there is. On the other hand, a region with a shallow slope will be more likely to retain water, resulting in a better infiltration rate. The hills in the northern and eastern regions are marked by steep slopes signifying areas with low groundwater potentiality. Flat and gentle slopes have good potential for groundwater. (Fig. 5)
 | Figure 5: Slope Map
|
Soil
The soil's infiltration rate is based on its components, with each soil having its own distinct infiltration capacity6. This soil feature could identify potential groundwater areas in a region. Typical soil types in the area could include clay soil, gravelly clay soil, gravelly soil, sandy soil, and loamy soil. Loamy soil and sandy soil (Inceptisols) cover over 25.4% of the southern parts and also occur as a vein in the eastern and northeastern parts. Clay/gravelly clay/gravelly soils (alfisols) covered over 75.6% of the area. The water percolation capacity is less due to low porosity and permeability. This group was allotted a lower rank, and the inceptisols soil group was given a higher one due to high porosity and permeability. (Fig. 6)
 | Figure 6: Soil Map
|
Drainage Density
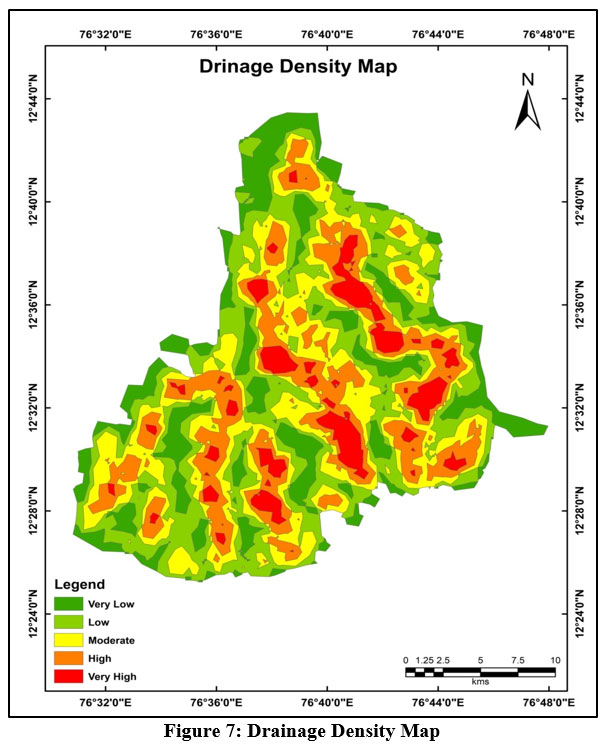
Drainage density can expressed as the ratio between the combined length of rivers present within a given region and the corresponding area of that region. Analyzing the structure of the drainage network can provide insight into the peculiarities of the area's groundwater recharge. The drainage system's quality is demarcated by lithology, and it depicts the rate of infiltration7. The drainage density ranged from 0.03-5.09 km/km² and was divided into five groups: 0.03-0.52, 0.52-1.04, 1.05-1.77, 1.78-3.09, 3.10-5.09 representing very low, low, moderate, high and very high respectively. Lower densities of drainage leads to less runoff and more significant groundwater potential. Thus, areas with high drainage density are given a low rating, while those with a low density are given a higher rating. (Fig. 7).
 | Figure 7: Drainage Density Map.
|
Land use/ Land cover
Groundwater reserves primarily control the area's LULC and, as such, play an essential aspect in efficient groundwater management8. Agriculture land, Built-land, forest, wasteland, and waterbodies are the leading kind in investigated localities. Around 74.6% of the total area is Agriculture, 1.5% under Built-up land, 5.7% under forest partly distributed along the eastern and northern parts, 11.8% under wasteland considered as hills and rocky exposure, and 6.1% under underwater bodies. The infiltration rate is high in waterbodies, agricultural land, and forest area, whereas the infiltration frequency is low in wasteland and build-up land. Land use/land cover categories like wasteland and built-up areas have lesser potentiality, and agricultural land and forest have higher potentiality for groundwater. (Fig. 8)
 | Figure 8: Land Use/ Land Cover Map
|
Table 2: Weights assigned to groundwater governing parameter
In the following table individual attributes are assessed and given a rank from 5 as the highest importance for potential zones and 1 as the least importance. The weightages and rankings of each thematic map and its respective factors are tabulated for calculating the overall weights.
Factor | Weight | Influence
| Rank | Overall weight |
Geomorphology | ||||
Hills Pediment Pediment inselberg Pediplain Reservoir River/stream |
0.38 |
38 | 1 3 3 3 4 5 | 38 114 114 114 190 152 |
Lineament density | ||||
Very high High Moderate Low Very low |
0.19 |
19 | 5 4 3 2 1 | 95 76 57 38 19 |
Lithology | ||||
Amphibolitic metapelitic schist Metaultramafite Metabasalt-Tuff Migmatites & Granodiorite-tonalite gneiss Pink-grey granite |
0.12 |
12 | 1 2 2
2 2 | 12 24 24
24 24 |
slope | ||||
0-1 1-2 2-3 3-5 >5 |
0.10 |
10 | 5 4 3 2 1 | 50 40 30 20 10 |
Soil | ||||
Alfisols inceptisol |
0.08 |
08 | 2 4 | 16 32 |
Landuse/ land cover | ||||
Agriculture Built up land Forest Waste land Water bodies |
0.06 |
6.6 | 4 1 3 2 5 | 24.6 6.6 19.8 13.2 33 |
Drainage density | ||||
Very high High Moderate Low Very low |
0.064 |
6.4 | 1 2 3 4 5 | 6.4 12.8 19.2 25.6 32 |
Groundwater Potential Zone
All seven thematic layers were overlay depending on their weights to better delineate potential groundwater zones. Weights rely on the expertise of experts and references from numerous works of literature to get a more accurate result. Employing the AHP method, the rankings, and weights allocated to individual parameters were calculated. The potential groundwater zones were grouped into five categories based on their overall weightage. The five categories are very poor (6-150), poor (151-191), moderate (192-207), good (208-226), and excellent (227-307). (Table 3). 7.4% of the total area was identified as an excellent potential zone, 38.4% as a good potential zone, 33.2% as a moderate potential zone, 13.4% as a poor potential zone, and 4.2% as a very poor potential zone and approximately 3.4% of the region is comprised of reservoirs, which are not taken into account when assessing groundwater potential zone. (Table 3 & Fig. 9)
Table 3: Classification of Overall Weightages
Groundwater Potential Zone Categories | Overall Weightages |
Very Poor | 06 - 150 |
Poor | 151 – 191 |
Moderate | 192 - 207 |
Very Good | 208 – 226 |
Excellent | 227 - 307 |
 | Figure 9: Groundwater Potential Zone Map
|
Validation
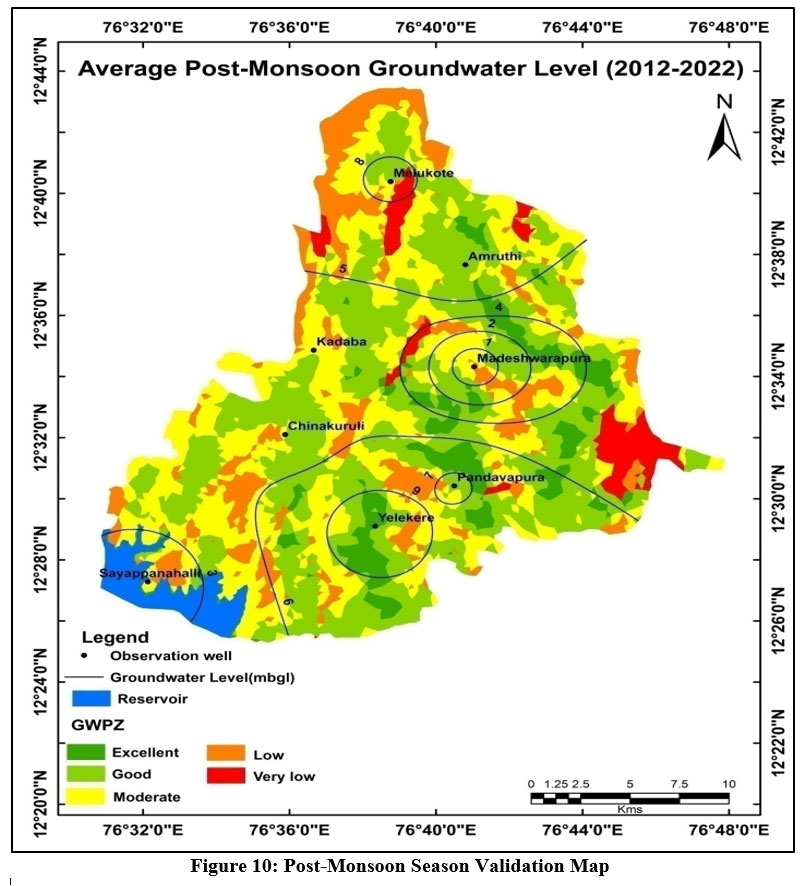
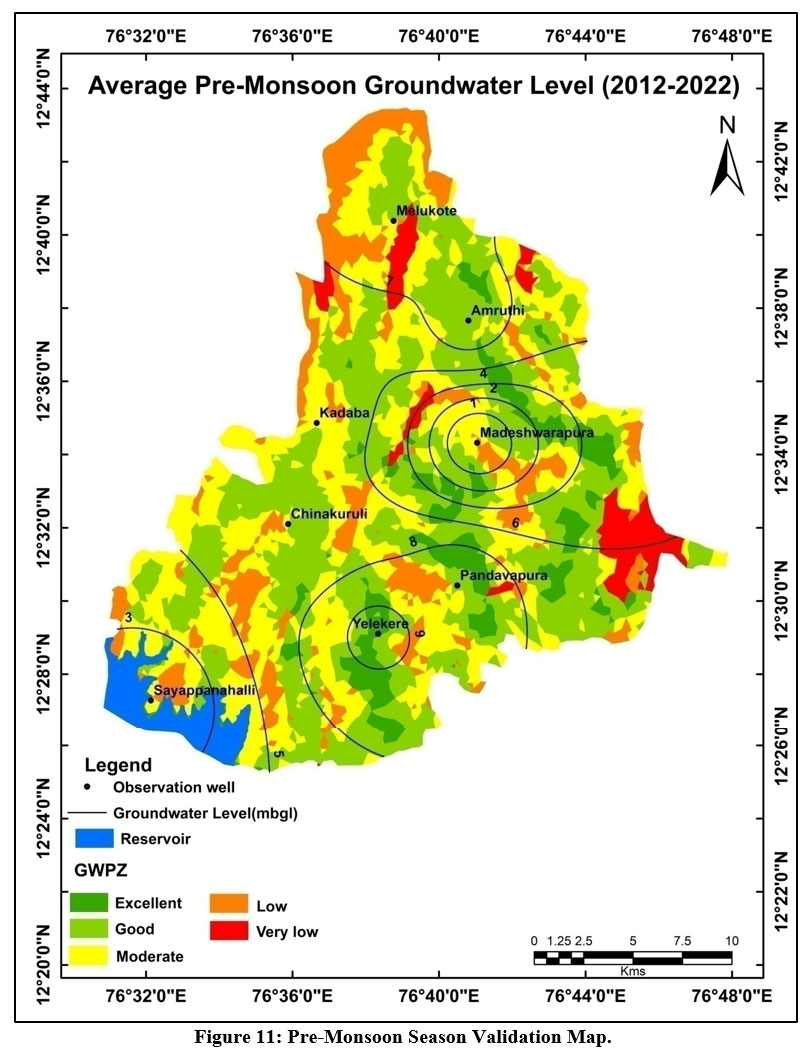
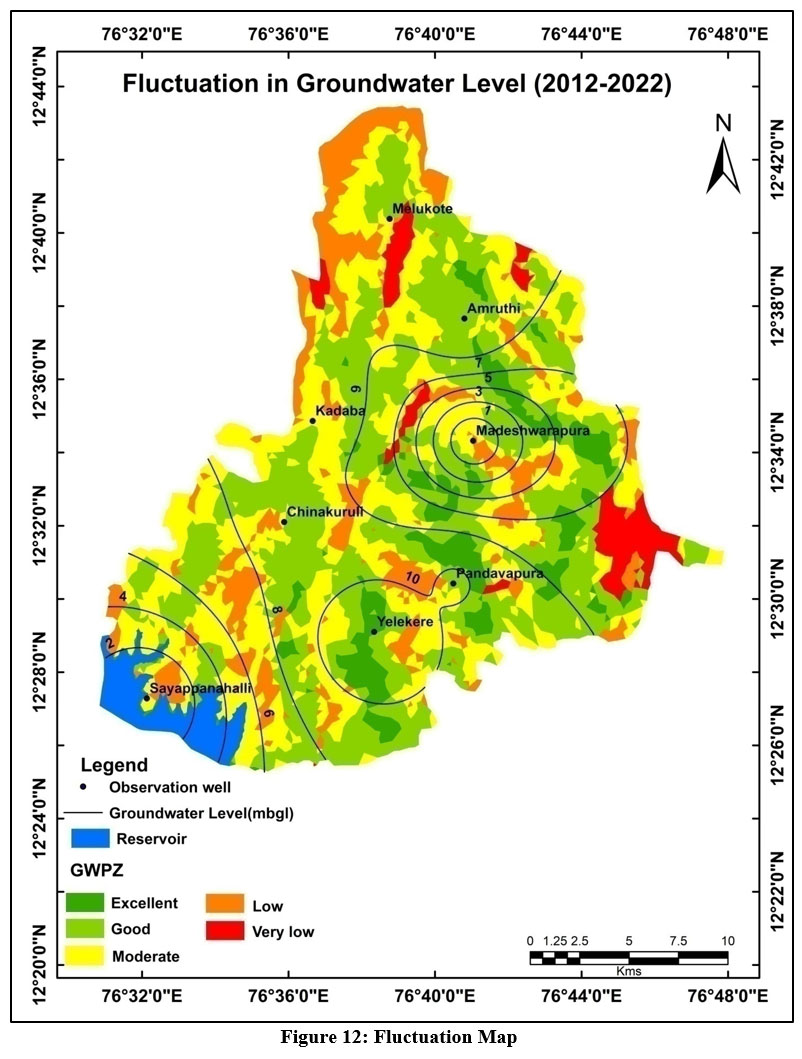
For confirming the exactitude of potential zone for groundwater, ten years' worth of before-monsoon and after-monsoon season borewells level stats from 2012 to 2022 is collected from the minor irrigation and Groundwater directorate. Seasonal fluctuation is calculated. These are interpolated by the IDW method (inverse distance weighting), creating contours of five-meter intervals. These contours were placed on the GWPZ map to check their accuracy. The deep water level with high fluctuation well indicates a poor groundwater potentiality so in the research area, Sayappanahalli and Madeshwarapura have high fluctuation of <6mts with water depths of >15mbgl, those wells are surrounded by poor groundwater potential zone Likewise, Amruthi and Pandavapura wells with <8mbgl (fluctuation<3mts) coincides with good groundwater potential zone while Melukote has perched water table conditions occurring at shallow depths. Similarly, Chinakuruli and Kadaba wells with <15mbgl (<3mts fluctuation) fall on the moderate groundwater potential zone, whereas Yelekere well with <4mbgl (fluctuation<1.5mts) falls on excellent groundwater potential zone, but due to a lack of data, the very poor groundwater potential zone is not validated. This result demonstrates that the method used to define the potential groundwater zone effectively gives valid results. (Table 4 & Figures 10, 11, and 12)
Table 4: Average depth of the groundwater and its fluctuation (2012-2022).
Sl. No. | Village | Lat | Long | Pre-monsoon | Post monsoon | Fluctuation |
1 | Amruthi | 12.62764 | 76.68003 | 7.62 | 5.48 | 2.14 |
2 | Chinakuruli | 12.53828 | 76.60361 | 14.3 | 11.45 | 2.85 |
3 | Kadaba | 12.58731 | 76.61208 | 13.18 | 10.78 | 2.4 |
4 | Madeshwarapura | 12.57153 | 76.67964 | 34.69 | 27.1 | 7.59 |
5 | Melukote | 12.66247 | 76.65047 | 6.54 | 4.54 | 2 |
6 | Pandavapura | 12.50422 | 76.67339 | 6.55 | 4.62 | 1.93 |
7 | Sayappanahalli | 12.45469 | 76.53555 | 23.64 | 16.93 | 6.71 |
8 | Yelekere | 12.47835 | 76.64485 | 3.24 | 2.18 | 1.06 |
 | Figure 10: Post-Monsoon Season Validation Map
|
 | Figure 11: Pre-Monsoon Season Validation Map.
|
 | Figure 12: Fluctuation Map
|
Conclusion
The current study used geospatial techniques paired with AHP to delineate potential groundwater zones in Pandavapura taluk by combining thematic layers. The excellent groundwater potential has been identified mainly in the southern region and some portions of the eastern region along with an area of 39 km² due to a water body, inceptisol soil texture, flat slope, very high lineament density, and low drainage density. A good potentiality zone for groundwater was scattered randomly throughout the investigation region encompassing 203.5 km2 area and characterized by high lineament density, agricultural land, gentle slope along with low drainage density. In certain areas, moderate potential zone of 176 km². This has pediplain, alfisols texture, medium drainage density, low lineament density, and a forest. Low potential zones appear as regions of adverse geomorphological conditions, alfisols soil texture, and wasteland encompassing an area of 71 km². Some areas of the country's northern, central, and western regions were found to have relatively low potential zones, characterized by hills, wastelands, high drainage density, low lineament density, and steeper slopes and cover an area of 22.3 km². Overall, GIS and AHP techniques give conceivably practical tools for analyzing potential groundwater zone. The conclusion map will aid policymakers, government officials, and managers in the study area's sustainable groundwater development.
Acknowledgments
The authors acknowledge the help and direction they received from the Department of Studies in Earth Science at the University of Mysore in Mysuru. They are also thankful to the University of Mysore for providing a fellowship.
Conflict of Interest
The authors have no competing interests.
Funding Sources
No monetary assistance was provided to the author(s) for the production of this article.
References
- Todd, D.K., Mays, L.W. Ground Water Hydrology. John Wiley and Sons, Inc.United States of America.; 2005.
- Ali S, Singh R. Morphological and hydrological investigation in Hirakud catchment for watershed management planning. J Soil Water Conserv. 2000;1:246-256.
- Agumase T. Kindie, Temesegen Enku, Mamaru A. Moges, Berhanu S. Geremew and HBA. Advances of Science and Technology. Vol 274. Springer International Publishing; 2019. doi:10.1007/978-3-030-15357-1
CrossRef - Ettazarini S. Groundwater potentiality index: A strategically conceived tool for water research in fractured aquifers. Environ Geol. 2007;52:477-487. doi:10.1007/s00254-006-0481-0
CrossRef - Biswas A. Delineation of Groundwater potential zones using Remote Sensing and Geographic Information System Techniques: A case study from Ganjam district, Orissa. Res J Recent Sci 2277-2502. 2012;1:59-66.
- Kanagaraj G, Suganthi S, Elango L, Magesh NS. Assessment of groundwater potential zones in Vellore district, Tamil Nadu, India using geospatial techniques. Earth Sci Informatics. 2019;12(2):211-223. doi:10.1007/s12145-018-0363-5
CrossRef - Yeh HF, Cheng YS, Lin HI, Lee CH. Mapping groundwater recharge potential zone using a GIS approach in Hualian River, Taiwan. Sustain Environ Res. 2016;26(1):33-43. doi:10.1016/j.serj.2015.09.005
CrossRef - Rajasekhar M, Sudarsana Raju G, Sreenivasulu Y, Siddi Raju R. Delineation of groundwater potential zones in semi-arid region of Jilledubanderu river basin, Anantapur District, Andhra Pradesh, India using fuzzy logic, AHP and integrated fuzzy-AHP approaches. HydroResearch. 2019;2:97-108. doi:https://doi.org/10.1016/j.hydres.2019.11.006
CrossRef - Rahaman A, Biswas B, Barman J, Suresh VM, Kishor B, Das J. Delineation of Groundwater Potential Zones Through AHP: A Case Study from Tamil Nadu, India. Monitoring and Managing Multi-hazards. Published online December 3, 2022:315-329. doi:https://doi.org/10.1007/978-3-031-15377-8_21
CrossRef - Basak D, Bose A, Roy S, Chowdhury IR. Understanding the forest cover dynamics and its health status using GIS-based analytical hierarchy process. Water, Land, and Forest Susceptibility and Sustainability. Published online 2023:475-508. doi:https://doi.org/10.1016/b978-0-323-91880-0.00014-3
CrossRef - Pandey HK, Singh V, Sudhir Kumar Singh. Multi-criteria decision making and Dempster-Shafer model–based delineation of groundwater prospect zones from a semi-arid environment. Environmental Science and Pollution Research. 2022;29(31):47740-47758. doi:https://doi.org/10.1007/s11356-022-19211-0
CrossRef - Daouda Nsangou, Amidou Kpoumié, Zakari Mfonka, Bateni SM, Abdou Nasser Ngouh, Remy J. The Mfoundi Watershed at Yaoundé in the Humid Tropical Zone of Cameroon: A Case Study of Urban Flood Susceptibility Mapping. Earth Systems and Environment. 2021;6(1):99-120. doi:https://doi.org/10.1007/s41748-021-00276-9
- Manap MA, Sulaiman WNA, Ramli MF, Pradhan B, Surip N. A knowledge-driven GIS modeling technique for groundwater potential mapping at the Upper Langat Basin, Malaysia. Arabian Journal of Geosciences. 2011;6(5):1621-1637. doi:https://doi.org/10.1007/s12517-011-0469-2
CrossRef - Sar N, Khan A, Chatterjee S, Das A. Hydrologic delineation of ground water potential zones using geospatial technique for Keleghai river basin, India. Modeling Earth Systems and Environment. 2015;1(3). doi:https://doi.org/10.1007/s40808-015-0024-3
CrossRef - Duguma TA, Duguma GA. Assessment of Groundwater Potential Zones of Upper Blue Nile River Basin Using Multi-Influencing Factors under GIS and RS Environment: A Case Study on Guder Watersheds, Abay Basin, Oromia Region, Ethiopia. Senapathi V, ed. Geofluids. 2022;2022:1-26. doi:https://doi.org/10.1155/2022/1172039
CrossRef - Wambui GT, Wandubi DE, Njuguna KZ, Ochieng OD. Application of analytical hierarchy process and integrated fuzzy-analytical hierarchy process for mapping potential groundwater recharge zone using GIS in the arid areas of Ewaso Ng'iro – Lagh Dera Basin, Kenya. HydroResearch. Published online February 2022. doi:https://doi.org/10.1016/j.hydres.2021.11.001
CrossRef - Goswami T, Ghosal S. Understanding the suitability of two MCDM techniques in mapping the groundwater potential zones of semi-arid Bankura District in eastern India. Groundwater for Sustainable Development. 2022;17:100727. doi:https://doi.org/10.1016/j.gsd.2022.100727
CrossRef - Karam J, Katramiz E, Ghali K, Ghaddar N. Effective mitigation of cross-contamination in classroom conditioned by intermittent air jet cooling with use of portable air cleaners. Building and Environment. 2022;219:109220. doi:https://doi.org/10.1016/j.buildenv.2022.109220
CrossRef - Nag S, Roy MB, Roy PK. Study on the functionality of land use land cover over the evaluation of groundwater potential zone: A fuzzy AHP based approach. Journal of Earth System Science. 2022;131(3). doi:https://doi.org/10.1007/s12040-022-01872-7
CrossRef - Pande CB, Moharir KN, Panneerselvam B, et al. Delineation of groundwater potential zones for sustainable development and planning using analytical hierarchy process (AHP), and MIF techniques. Applied Water Science. 2021;11(12). doi:https://doi.org/10.1007/s13201-021-01522-1
CrossRef - Rather AF, Ahmed R, Wani GF, et al. Mapping of groundwater potential zones in Pohru Watershed of Jhelum Basin-Western Himalaya, India using integrated approach of remote sensing, GIS and AHP. Earth Science Informatics. 2022;15(4):2091-2107. doi:https://doi.org/10.1007/s12145-022-00824-5
CrossRef - Singha SS, Pasupuleti S, Singha S, Singh R, Venkatesh AS. Analytic network process based approach for delineation of groundwater potential zones in Korba district, Central India using remote sensing and GIS. Geocarto International. Published online August 8, 2019:1-23. doi:https://doi.org/10.1080/10106049.2019.1648566
CrossRef - Tien Bui D, Shirzadi A, Chapi K, et al. A Hybrid Computational Intelligence Approach to Groundwater Spring Potential Mapping. Water. 2019;11(10):2013. doi:https://doi.org/10.3390/w11102013
CrossRef - Vellaikannu A, Palaniraj U, Karthikeyan S, Senapathi V, Viswanathan PM, Sekar S. Identification of groundwater potential zones using geospatial approach in Sivagangai district, South India. Arabian Journal of Geosciences. 2021;14(1). doi:https://doi.org/10.1007/s12517-020-06316-4
CrossRef - Yossa MT, Lordon AED, Agyingi CM, Agbor-Taku J, Shandini YN, Bessong CE. Remote sensing and geographic information system (GIS)-based high-resolution mapping of potential groundwater recharge zones on the hard rock terrains of the Cameroon volcanic line (CVL). SN Applied Sciences. 2022;5(1). doi:https://doi.org/10.1007/s42452-022-05248-w
CrossRef


