Identification of Sources Causing Air Pollution in Indian Cities Using Hierarchical Agglomerative Cluster Analysis
Nannaparaju Vasudha1
*
 and Polisetty Venkateswara Rao2
1
Department of Mathematics,
Vasavi College of Engineering,
Hyderabad,
Telangana
India
2
Department of Physics,
Vasavi College of Engineering,
Hyderabad,
Telangana
India
http://dx.doi.org/10.12944/CWE.18.2.13
Copy the following to cite this article:
Vasudha N, Rao P. V. Identification of Sources Causing Air Pollution in Indian Cities Using Hierarchical Agglomerative Cluster Analysis. Curr World Environ 2023;18(2). DOI:http://dx.doi.org/10.12944/CWE.18.2.13
Copy the following to cite this URL:
Vasudha N, Rao P. V. Identification of Sources Causing Air Pollution in Indian Cities Using Hierarchical Agglomerative Cluster Analysis. Curr World Environ 2023;18(2).
Download article (pdf)
Citation Manager
Publish History

Introduction
According to scientific studies numerous Indian cities and regions experience poor air quality because of harmful emissions. Anthropogenic activities, associated with the rise in urbanization and boom in industrialization are the main cause of air pollutant emissions and poor air quality. The situation in India has been characterised by growing population growth trends and their effects on air quality for the past 20 years. Air pollution significantly increased cases of the following diseases: lung and tracheal cancers, lower respiratory infections, bronchitis, ischemic heart disease, and chronic obstructive pulmonary disease1. As per World Health Organization2, in 2012 air pollution was responsible for one out of every nine fatalities. According to3, based on pollutant emissions, with 21 of the top 30 most polluted cities being found, India was placed as the fifth-most polluted nation. The Health Effects Institute has listed air pollution is one of the top five global causes of death, making it a major issue for both global health and the environment4. The mortality toll in the year 2019 from outdoor pollution was above 980,000 in India was reported5. Emissions including Particulate matter (PM), Surface Ozone (O3), Nitrogen Oxides (NOx) and Sulphur dioxide (SO2) have the potential to harm people's respiratory and cardiovascular systems.
Construction, motor vehicles, and dust are the main sources of PM10, whereas a variety of coal combustion processes, such as burning garbage, stubble burning and cooking, are the main sources of PM2.5. Because they are so tiny, particles with a diameter of less than or equal to 10 micrometers have the potential to enter the lungs and cause major health issues. It's important to highlight that fine particulate matter pollution is expected to get worse in some places of India over the next few decades due to the nation's continuous urbanisation and strong reliance on coal for electricity production.
After particulate matter, nitrogen oxides (NOx), which are precursors to ground-level ozone (O3), are India's next primary concern pollutants. 19 cities, according to the WHO, have NO2 levels over the national annual standard (40 g/m3), which is still anticipated to have detrimental effects on health, particularly on the lung development of new-borns (WHO, Air Quality Guidelines). After NO2 and O3, SO2 is the second most critical target for mitigation because one city now exceeds the annual (50 g/m3) standard, and eleven more cities have moderate concentrations. Vasudha and Venkateswara rao6 used Factor analysis and concluded that the technique can used to classify different localities based upon air pollutants. Using multi-linear regression for the same areas, they are effective in identifying the impact of different air contaminants to AQI in their subsequent study7.
The main objective of the current study is to identify regions with extremely high and high levels of air pollution, as well as the contributing sources, in order to determine the best ways to reduce these levels and improve the locals' access to clean air.
Materials and Methods
Hierarchical Agglomerative Cluster Analysis (HACA)
In a hierarchical categorization, the data are not immediately sorted into a predetermined number of classes or clusters. Instead, the classification is divided into several groups that can range from one cluster that contains each individual to 'n' clusters that each contain one individual. Two subcategories of hierarchical clustering approaches are agglomerative methods and divisive methods. Agglomerative methods progressively combine the ‘n’ people into groups, whereas divisive methods gradually split the ‘n’ individuals into smaller groupings. Both the agglomerative path and the divisive path can produce hierarchical classifications, this can be depicted by a dendrogram, a two-dimensional diagram. It shows the fusions or divides made at each stage of the study.
The most widely used hierarchical approaches are agglomerative techniques. They divide the data into a sequence of partitions, the first of which consists of n "clusters" with a single member, and the last of which consists of a single group that includes all n people. At each stage, the people or groups who are closest to one another are combined (or most similar). In 1963, Ward developed Ward's method8 a unique form of agglomerative hierarchical clustering. Clusters having the least within-cluster variance are created using Ward's approach Clustering is done using an analysis of variance method rather than distance measurements. The method relies on calculating the error sum of squares (ESS), this is the cluster mean divided by the sum of the squared distances between each point.
.png) ………… (1)
………… (1)
Where Xij is the jth cluster's ith observation. The following is the sum of the ESSj values for all clusters, or the error sum of squares for all clusters.:

where k is the number of clusters.
A total of n clusters with a single element each must be created as the initial step of the procedure, the number of observations is n. The means of each of these on-element clusters are identical to that single observation. Two elements are combined into one cluster in the algorithm's initial stage such that the erroneous sum of squares, or ESS, grows as little as possible. Merging the dataset's two closest observations is one approach to achieving this. The merging, however, causes the least rise in ESS as each stage moves forward, as can be seen. This reduces the separation between the observations and the cluster centres. The procedure is repeated until a single cluster contains all the observations.
Discriminant Analysis (DA)
Discriminant analysis is a statistical method for data analysis where the dependent variable is categorical and the independent variables are interval variables. It can estimate the discriminant function coefficients after determining the analysis sample. There are two major strategies available. To include all the predictors at once in the direct method, the discriminant function must be estimated, regardless of how efficient a variable's ability to discriminate is. The stepwise method is an alternate strategy. Based on their ability to group discrimination, the predictor variables are entered successively in stepwise discriminant analysis9.
Data collection
Six primary air pollutant components' daily data (PM10, PM2.5, CO, O3, NO2 and SO2) was downloaded with AQI using openly accessible data at Kaggle.com during a two-year period (January 2018 to December 2019) from 16 AQI monitoring stations [listed in Fig 1] located in the major cities of India. These AQI stations were selected based on consistent availability of the data. To do the cluster analysis for this study, stations were selected based on their diversified environment (Rural, Urban, Coastal, industrial and agricultural). Daily data of 6 pollutants from 16 stations of 730 days amounting to 70,080 observations (6 data per station x 16 stations x 730 days) was used for analysis.
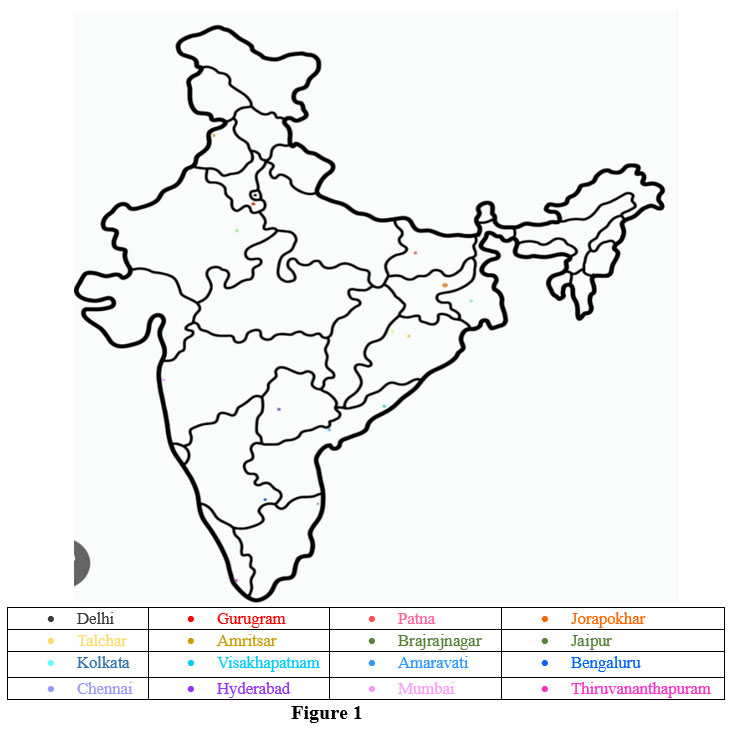 | Figure 1
|
Results and Discussions
Hierarchical Agglomerative Cluster Analysis (HACA)
Initially the data of all the stations was subjected to K-means cluster algorithm to identify the number of clusters suitable for the analysis. Based on the F-value of air pollution variables in ANOVA table four clusters were chosen. Higher the F, more is the strength of variables in contribution. It was observed from Table1 that the contributions of all the variables except CO were significant.
Table1: F-values of six air pollution variables using ANOVA
ANOVA | ||||||
| Cluster | Error | F | Sig. | ||
Mean Square | df | Mean Square | df | |||
PM25 | 3464.595 | 3 | 47.818 | 12 | 72.453 | .000 |
PM10 | 13562.565 | 3 | 193.137 | 12 | 70.222 | .000 |
NO2 | 355.759 | 3 | 96.097 | 12 | 3.702 | .043 |
CO | .108 | 3 | .251 | 12 | .430 | .735 |
SO2 | 354.316 | 3 | 51.811 | 12 | 6.839 | .006 |
O3 | 312.746 | 3 | 112.306 | 12 | 2.785 | .086 |
Silhouette distance is the separation distance between the resulting clusters. The higher the Silhouette value between the neighbouring clusters indicates the clusters are well apart from each other and are distinguished. Based on maximum silhouette distance four clusters were identified to perform HACA. Ward’s method employing Block distance technique was used in this process. Generated four clusters from the clustering method were depicted in Fig.2 as Dendrogram.
 | Figure 2: Dendrogram showing AQI monitoring stations located in the major cities of India.
|
Following the clustering, four clusters were created in a very convincing manner as the stations in the homogeneity traits are present in all these groups. The study areas are diversified into four significant groups of regions based on standard values of AQI. As per the health standards, AQI between 0 to 50; 51 to 100; 100 to 150; 151 to 200 and greater than 200 are categorized as Good, Moderate, Unhealthy for sensitive group, Unhealthy and poor respectively. The authors designated the regions with average AQI falling in the range 51 to 100; 101 to 150; 151 to 200 and greater than 200as LPR, MPR, HPR and VHPR respectively. The list of monitoring stations in each cluster are consolidated in Table 3.
Table 2: Clusters of monitoring stations depending on AQI levels
Clusters | Cluster 1- LPR | Cluster 2- MPR | Cluster 3- HPR | Cluster 4- VHPR |
Average AQI | 96 | 135 | 173 | 227 |
Regions | Amaravati, Bengaluru, Chennai, Hyderabad, Mumbai and Thiruvananthapuram | Amritsar, Brajrajnagar, Jaipur, Kolkata and Visakhapatnam | Jorapokhar and Talcher | Delhi, Gurugram and Patna |
Table 2 reveals that the average pollution levels at VHPR are twice of standard value and the AQI values at stations under HPR are quite above the standard value. Talcher coalfield and the surrounding area's residents continued to experience poor air quality because of the presence of PM2.5 and PM10 above the allowable limits10.However, AQI of Jaipur, Amritsar, Brajrajnagar, Kolkata and Visakhapatnam stations falling under MPR are just above the standard values. This may be due to stubble burning and wildfire at Jaipur and Amritsar. Kolkata and Visakhapatnam are densely populated and highly industrialized resulting into unhealthy AQI. Pollution in Brajrajnagar may be due to location of Orient Paper mills. Areas under LPR have average AQI 96 which is just below the unhealthy AQI (100). Either the local government or the environment regulates pollution in these locations. Pollution in these areas is either being controlled naturally or by local authorities. The present study is aimed to identify the sources at stations which falls under VHPR and HPR because hazardous levels of pollution causing severe ill-health to the inhabitants.
Table 3: Average values of pollutants and AQI during the monitoring period.
City/Pollutant | PM2.5 | PM10 | NO2 | SO2 | O3 | AQI |
NAAQS ( Annual ) | 40 µg/m3 | 60 µg/m3 | 40 µg/m3 | 50 µg/m3 | 100 µg/m3 | 0-50 (Good) |
Delhi | 111.7604 | 227.579 | 45.57927 | 13.83708 | 41.65673 | 240.6315 |
Gurugram | 104.9779 | 209.9214 | 28.86666 | 11.17326 | 34.90121 | 214.0241 |
Patna | 112.5566 | 197.3625 | 44.04341 | 39.51021 | 63.02295 | 225.9681 |
Jorapokhar | 68.58748 | 161.8256 | 8.833701 | 36.26766 | 29.94142 | 169.3598 |
Talcher | 59.55354 | 180.214 | 14.59089 | 29.62043 | 12.02715 | 176.3967 |
The values of air pollutants and AQI levels averaged over monitoring period are compiled in Table 3 for the stations that falls under VHPR and HPR clusters.
Pollution causing sources in Delhi, Gurugram and Patna
The states of Uttar Pradesh and Haryana border the national capital, Delhi. Crop burning in the neighbouring states is one of the key factors contributing to rising air pollution levels in Delhi and Gurugram. Other sources are construction activities, vehicular emissions and waste combustion also contribute to pollution. The National Environmental Engineering Research Institute and the Control Board (CPCB) have highlighted automobile emissions as a major factor in Delhi's rising air pollution11. The excessive population density is one more factor responsible for the increase in air pollution in these cities. Due to the ongoing destruction of the Aravalli range, an additional problem is the increasing amount of dust coming from the Thar Desert. In recent years, Patna, Bihar's capital city, has seen an increase in pollution levels as in the case of other cities in India. Traffic is the main contributor to the high concentration of particulate matter in Patna and it is the major air quality issue when compared to other pollutants like NO2, SO2, etc which are within the standards of NAAQ. It has been noted that air quality during the winter months deteriorates drastically due to the condensation of fine particulate matter in the lower parts of the atmosphere.
Pollution causing sources in Jorapokhar and Talchar
In India, coal is the main fossil fuel utilised to generate electricity. Mining operations are getting more and busier because of the increased demand for coal. Coal mining-related activities have a severe negative influence on the environment, including changes to the landform, land use/land cover, and distribution of flora.Jorapokhar is the neighbourhood town in Dhanbad which is the second most populated city in Jharkhand state and Talcher in Odisha state are small towns but have extensive coal mines and fertilizer units. Dhanbad, known for its rich coal reserves and industries is the most polluted city in India. High levels of SPM and dust are a severe issue in the mining districts of Talcher. Suspended particulate matter in the Talcher region of Odisha had risen to an alarming level of 1848 kg/km2 and the levels of nitrogen dioxide (NO2) is generally within the permitted limits in coal mining areas12. According to calculations, the air quality index (AQI) for areas affected by coal mine fires is roughly 1.5 times higher than for places not affected by mine fires13.
Discriminant Analysis (DA)
Discriminant analysis was performed on clusters to validate the results obtained from HACA. The air pollution variation among the various regions can be explored by stepwise DA. The four significant groups (LPR, MPR, HPR and VHPR) were treated as dependent variables, whereas the air quality parameters were considered independent variables. The accuracy of spatial variation of sampling stations concerning seasonal dependent pollution level is 100% in all four clusters. The Box's M test resulted in a significant level (p) of 0.119, p >0.01 signifies that multivariate normality is met.
Table 4: Wilk’s Lambda and Chi-square statistic F of three AQI levels
Step | Number of Variables | Lambda | df1 | df2 | df3 | Exact F | Approximate F | ||||||
Statistic | df1 | df2 | Sig. | Statistic | df1 | df2 | Sig. | ||||||
1 | 1 | .054 | 1 | 3 | 12 | 70.222 | 3 | 12.000 | .000 |
|
|
|
|
2 | 2 | .016 | 2 | 3 | 12 | 25.252 | 6 | 22.000 | .000 |
|
|
|
|
3 | 3 | .007 | 3 | 3 | 12 |
|
|
|
| 18.182 | 9 | 24.488 | .000 |
Wilks’ lambda measures how well each level of an independent variable contributes to the model in discriminant analysis. The range of the scale is 0 to 1, with 1 denoting complete lack of discrimination14. Smaller values of Lambda in Table 4 emphasize the significant difference of each level. Chi-Square statistic F with significance level < 0.01 concludes that the corresponding function explains the group membership of each level well. Clusters validated by discriminant analysis are depicted in Fig.3.
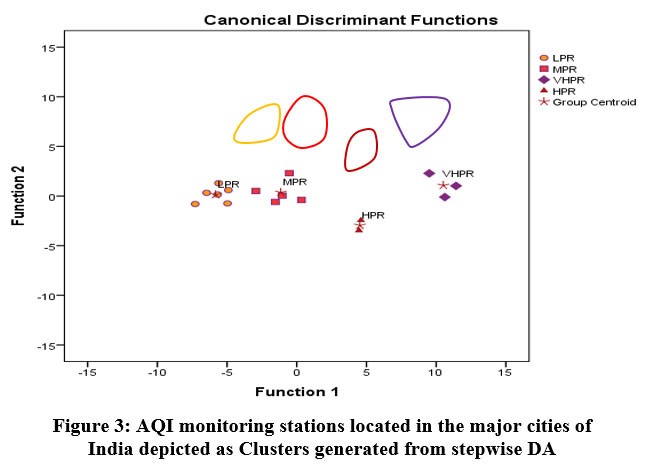 | Figure 3: AQI monitoring stations located in the major cities of India depicted as Clusters generated from stepwise DA.
|
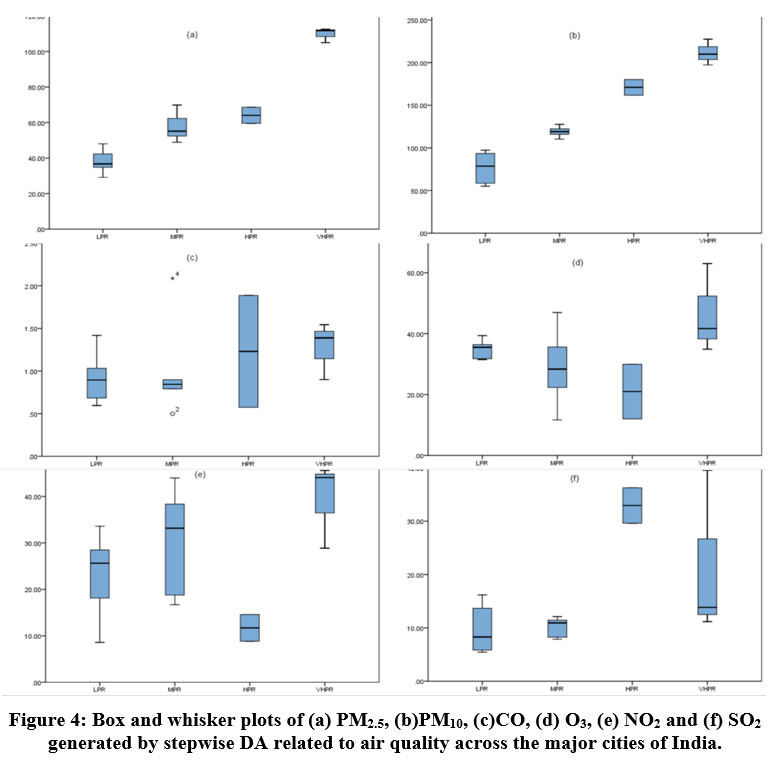 | Figure 4: Box and whisker plots of (a) PM2.5, (b)PM10, (c)CO, (d) O3, (e) NO2 and (f) SO2 generated by stepwise DA related to air quality across the major cities of India.
|
The contribution of each pollutant at regions corresponding to different pollution levels were illustratedin Box and whiskers plot shown in Fig.4. The concentrations of PM2.5 and PM10 in Fig.4a and Fig.4b shows that there is a gradual increase from LPR to VHPR. This indicates the major pollutant sources to AQI are PM2.5 and PM10. Not much variation of CO across all the regions was found. The contribution of O3 and NO2 at HPR is very less when compared to other regions however, SO2 is found to be high. Sulphur dioxide resulting from coal combustion is the major source of air pollution at Talcher. Gopinathet al15 used the field emission scanning electron microscope and observed major sulphide minearls in Talcher. Bhanu Pandeyet al16 reported high values of SO2 in the coal mines area in Jharia coal fields near Jorapokhar. The high concentration of SO2 is due to production of urea using coal as a feedstock by the Fertilizer Corporation of India Ltd (FCIL) established in Talcher. https://tflonline.co.in/about.html.
Conclusions
There is a serious need to act quickly to solve the cities of India's increasing air pollution levels. The same motivated the authors to make an effort to pinpoint the origins of various air contaminants at various environmental sites. Cluster algorithm helps in grouping the data into homogeneous clusters sharing an underlining property. Using HACA, selected monitoring stations were grouped into clusters, and the results were verified by DA. It was noticed that stations with same environmental conditions, local sources and pollution levels were grouped into same clusters. Despite numerous steps done by the authorities to reduce air pollution, it was found that the regions within the same clusters share comparable local sources that significantly contribute to the growth in pollution levels. Among the clusters that are formed urban regions with huge population and heavy traffic are highly polluted (VHPR) with an average AQI greater than 200 which is hazardous to residents. The high level of air pollution in these regions (VHPR) may be due to their proximity to the stubble burning areas and desert. Major Contribution to the air pollution in the regions falling under HPR with AQI greater that 150 is existence of coal mines and combustion of coal by fertilizer industries. Direct dependence of particulate matter on AQI was another aspect that was observed in this study. This work highlights the prominence of local sources in enhancing the levels of air pollution.
The findings aid the authorities concerned in applying different methods at various study sites such as: implementing pollution control systems in industries and mines, conducting awareness campaigns, staggered offices, educational institutions operating hours, effective methods of pollution less stubble burning, encouraging usage of electrical vehicles, construction of required road infrastructure to avoid traffic congestion, implementation of stringent rules and imposition of heavy fines to the defaulters.
Acknowledgment
The Vasavi College of Engineering, Hyderabad, India, administration is gratefully acknowledged by the authors. The Kaggle database, which provides users with access to the data, is acknowledged by the authors.
Conflict of Interest
There are no conflict of interest.
Funding Sources
The author(s) of this paper did not receive any funding for their research, writing, or publication of the work.
References
- Sarath K. Guttikunda, Rahul Goel, Pallavi Pant. Nature of air pollution, emission sources, and management in the Indian cities. Atmospheric Environment. 2014; 95:501-510 https://doi.org/10.1016/j.atmosenv.2014.07.006
CrossRef - WHO 2016. https://www.who.int/india/health-topics/air pollution#:~:text=In%202016%2C%20ambient%20(outdoor),inefficient%20and%20leaky%20cooking%20stoves. Accessed on 3 March, 2023
- WHO 2019, https://www.who.int/news-room/fact-sheets/detail/ambient-(outdoor)-air-quality-and health#:~:text=Ambient%20(outdoor)%20air%20pollution%20is,Asia%20and%20Western%20Pacific% 20Regions.Accessed on 3 March, 2023
- HEI 2019, https://www.healtheffects.org/announcements/annual-report-2019-now-availableAccessed on 3 March, 2023
- Anamika Pandey et al. Health and Economic Impact of Air Pollution in the States of India: the Global Burden of Disease Study 2019. The Lancet Planetary Health. 2020; 5(1):25-38 https://doi.org/ 10.1016/S2542- 5196(20)30298-9.
- Vasudha. N, Rao. P. V. Factor Analysis of Air Pollutants over Hyderabad-A Case Study. Curr World Environ 2022;17(2)507-515. DOI:http://dx.doi.org/10.12944/CWE.17.2.21
CrossRef - NannaparajuVasudha and PolisettyVenkateswara Rao. Assessment of Air Pollution Sources in Hyderabad City using Multilinear Regression. Indian Journal of Natural Sciences. 2022;13(73) 45733-45740
- Murtagh, F. and Legendre, P. Ward’s Hierarchical Agglomerative Clustering Method: Which Algorithms Implement Ward’s Criterion. Journal of Classification.2014; 31274-295. http://dx.doi.org/10.1007/s00357-014-9161-z
CrossRef - Huberty, C. J. Discriminant Analysis. Review of Educational Research.1975; 45(4), 543–598. https://doi.org/10.3102/00346543045004543
CrossRef - Aurangzeb Md, BanerjeeSudip. Impact of coal mining on airborne particles based on real-time data. Pollution Research. 2021; 40: 868-76.
- NEERI 2018. Air Quality Assessment. Emission Inventory & Source Apportionment Study for Delhi. APC/NEERI, Nagpur. 2008. Available online: http://cpcb.nic.in/cpcbold/Delhi.pdf (accessed on 10 January 2018).
- Goswami S, Das M, Guru BC. Environmental degradation due to exploitation of mineral resources: a scenario in Orissa. Bioscan. 2010; 2:295–304
- Mondal S, Singh G, Jain MK. Spatio-temporal variation of air pollutants around the coal mining areas of Jharia Coalfield, India. Environ Monit Assess. 2020;192(6):405. doi: 10.1007/s10661-020-08324-z. PMID: 32472204.
CrossRef - Brown, M. T., & Wicker, L. R. Discriminant analysis. In H. E. A. Tinsley & S. D. Brown. Editors Handbook of applied multivariate statistics and mathematical modeling. Academic Press. 2000;209–235.
CrossRef - P.Gopinathan, MadhuJha, Ashok K. Singh, Abhishek Mahato, T. Subramani, Pradeep K. Singh, Vivek Singh. Geochemical characteristics, origin and forms of sulphur distribution in the Talcher coalfield, India. Fuel. 2022;123376. https://doi.org/10.1016/j.fuel.2022.123376.
CrossRef - Bhanu Pandey, Madhoolika Agrawal, Siddharth Singh. Assessment of air pollution around coal mining area: Emphasizing on spatial distributions, seasonal variations, and heavy metals, using cluster and principal component analysis. Atmospheric Pollution Research. 2014;5(1)79-86.
CrossRef


