Morphometric Analysis of Tectonically Active Bhimtal-Naukuchiatal Lake Basin, Kumaun Himalaya
Kalpana Gururani1
 , Bahadur Singh Kotlia1
, Pooja Chand1
, Manmohan Kukreti1
, Deepanshu Parashar2
, Arun Kalkhundiya3
, Pankaj Kumar Bhatt4
and Arvind Pandey2
*
, Bahadur Singh Kotlia1
, Pooja Chand1
, Manmohan Kukreti1
, Deepanshu Parashar2
, Arun Kalkhundiya3
, Pankaj Kumar Bhatt4
and Arvind Pandey2
*
1
Department of Geology,
Centre for Advance studies in Geology,
Kumaun University,
Nainital,
India
2
Department of Remote Sensing and GIS,
Centre of Excellence for NRDMS in Uttarakhand,
Soban Singh Jeena University, Almora,
Campus Almora,
Uttarakhand
India
3
Department of Zoology,
Soban Singh Jeena University,
Almora, Campus Pithoragarh,
Uttarakhand
India
4
Department of Geography,
Soban Singh Jeena University, Almora,
Campus Pithoragarh,
Uttarakhand
India
http://dx.doi.org/10.12944/CWE.18.2.32
Copy the following to cite this article:
Gururani K, Kotlia B. S, Chand P, Kukreti M, Parashar D, Kalkhundiya A, Bhatt P. K. Pandey A. Morphometric Analysis of Tectonically Active Bhimtal-Naukuchiatal Lake Basin, Kumaun Himalaya. Curr World Environ 2023;18(2). DOI:http://dx.doi.org/10.12944/CWE.18.2.32
Copy the following to cite this URL:
Gururani K, Kotlia B. S, Chand P, Kukreti M, Parashar D, Kalkhundiya A, Bhatt P. K. Pandey A. Morphometric Analysis of Tectonically Active Bhimtal-Naukuchiatal Lake Basin, Kumaun Himalaya. Curr World Environ 2023;18(2).
Download article (pdf) Citation Manager Publish History

Introduction
Throughout the Quaternary Period, active tectonics along thrusts and faults has been reshaping the Himalayan topography, causing geomorphic changes. The evolution and change of varied landscapes in tectonically effective locations are also linked to tectonic elevate, deterioration, rapid erosion, and denudation mechanisms that combine tectonics and climate.1,2,3,4,5,6 Thrusts such as the HFT, MBT, MCT, and analogous secondary thrusts/faults such as RT, SAT, NAT, BT, and THF characterize the Kumaun Himalaya7,8,9,10,11,12and the tectonic activity along these has resulted in uneven slopes, asymmetrical topography and irregular landscapes.13,14,15,16,17,1819,20,21 In certain regions, rivers are more responsive to provide the geomorphic elements that make up the fluvial landscape architecture.22,23,24,25,26,Since neotectonic activity can have a substantial impact on fluvial systems, qualitative and quantitative investigations of drainage pattern are valuable for evaluating how it affects geomorphic processes and landscape evolution22,27Some of the notable characteristics of the tectonically formed landforms in vicinity of thrusts/faults zones of the Himalaya in general and Uttarakhand Himalaya in particular are the active and settled landslides, formation of palaeolakes, raised paired or separated terraces, incision, entrenched meandering, change of valley channels, occurrence of deep valley, waterfalls and displacement of previous faults by the later ones28,29,30,31,32,33,34,35,36,37. In tectonically active regions, morphometric tools are widely used to understand how tectonics affects the landscape38,39,40,41,42,43,44,45. A number of studies have shown that the mountain-front in the area is affected by neotectonic46. A number of features such as landslides, asymmetrical river terraces, river incision, the formation of deep gorges, triangular facets, and tilting of recent deposits, suggest that the Gaula basin is structurally regulated and neotectonically active47,48,49. Analyzing linear, areal, relief and morphometric parameter of basin play important role to understand the structural/lithologcal control of the basin49,50.
The youthfulness and spectacular exposure of Himalayan terrain makes it ideal orogeny to study variety of geological process51,52,53,54,55,56,57,58.The Himalayan orogeny and the lithospheric deformation have aggravate dintense research in recent years59,60,61,62. The landscape modification in the Himalayan thrust zones is result of tectonics and surface geological processes viz, erosion, weathering, upliftment and frangible lithology. The traces of these modification can be evaluated with the help of longitudinal profile modeling of river63. Degree of tectonic activities attribute to a range of geomorphic and structural features which leads to landscape evolution. Over the years evaluation of tectonic activity with the help of geomorphic and structural expressions has attain its own scientific platform to infer tectonic activities64,65. Apart from this toposheets and satellite data along with multidisciplinary approach act as add on for morphometric indices analysis for a comprehensive evaluation of tectonics66,67,68. A combination of satellite based tectonics, advance geospatial technology and field observations have been used largely for better understanding of landscape evolution by mapping, evaluating and analyzing the morphometric parameters. 48These studies aid in identifying active tectonic deformations, regions that are vulnerable to natural disasters, and land use planning69. In response to tectonics and differential uplift over a range of timescales from thousands to millions of years morphometric analysis detects silent changes in a river.
The geomorphic indices identify endogenic geomorphic processes when they identify basin anomalies brought by tectonic activity50.
The Vf assumes that every area susceptible to up-lift has carved ravine with tapered floors and deeper levels of V-shaped ravine70. Greater Vf values are typically linked with sluggish tectonic activity and wide, flat ravine floors, on the other hand less Vf values are reflective of comparatively quick uplift in V-shaped ravine and tributaries that have recently been incised and are connected with grater uplift rates70. It also shows the developmental stage of a river valley and is an excellent indicator of the extent of incision71. Furthermore, the appearance of the valley wall is determined by the lithology of the foundation rock and the river's erosive capacity72. The hypsometric profile depicts variation in altitudes throughout a geographical area, from one watershed to the next. This curve is ratio of total basin elevation and total basin area. The basin's overall area (A) is the addition of the areas between each adjoining contour. In a basin surface area (a) is area above a certain line of altitude (h)70,73. The relative area (a/A) fluctuates from 1.0 to 0.0 and value 1.0 indicate minimum level of basin and 0.0 indicate highest level of the basin. The SL gradient is important aspect for identifying irregularities in natural concaveness within longitudinally. The steepness index allows for the normalization of slope measurements as well as for the recognition of aberrant locations in each part of the river from the upstream to the terminal. The SL index is extremely reactive to variations in river gradient, allowing for the estimation of correlations between probable tectonic forces, rock resistance, and topography. Along a graded stream, the SL index stays roughly stable, and fluctuations in this index tend to be due to tectonic and lithological restrictions74.
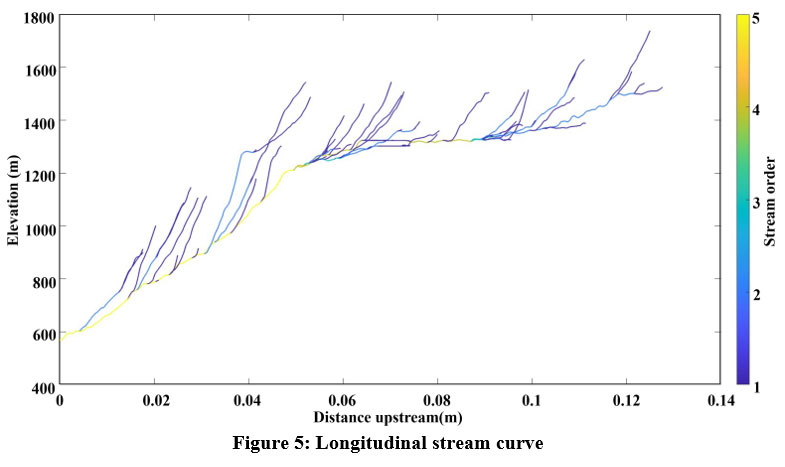
Branching design of a channel network is strongly connected to the bifurcation ratio. The high Rb shows an early hydrograph maximum along the possibility of sudden flooding during stormy incidents in places where these stream orders occur50. Drainage density is a helpful mathematical expression of topography segmentation and washout capacity since it influences the time travel by water. A more drain density suggests a well-drained watershed with a quick hydrological reaction to precipitation, whereas less Dd suggests a weakly drained watershed with a moderate hydrological reaction50. Smith (1950) categorized the drainage density into texture divisions viz, Grater than 2 very course, 2-4 course, 4-6 moderate 6-8 fine and greater than 8 very fine75. Less Dd indicate areas with resistant rocks with extremely permeable subsurface and when elevation ratio is minimal whereas more Dd shows strong or impermeable underlying material, scarce vegetation, and steep topography50. Stream order, or classifying streams according to the quantity and kind of tributary junctions, is a simple, practical, and all-encompassing measure of stream size, discharge, and drainage area. Horton (1945) developed a system for ordering streams that was later refined by Strahler (1964)76,77. One of the most popular proxies, the SPIM based model evaluates the variability in rock upliftment in different catchments and is related to the steepness index (Ksn).78,79,80 In steady state conditions, the variability in uplift of longitudinal river channel can be conventionally evaluated using this model. The direction of movement of the drainage division with regard to the steady state line, where the drainage is either losing (victim) or gaining (aggressor), in in-equilibrium state, is usefully understood using the Chi (?) parameter81,82. One can forecast the migration of the drainage divide when all the tributaries display varied values of Chi and depart from the ideal steady state since the migration always moves from low to high chi values. Asymmetric Factor is often used to estimate basin’s maturity and the stage of equilibrium of the basin3. When a river flows in a homogeneous terrain, which have not been affected by tectonic activity it anticipate the symmetric drainage network and dendritic drainage network70. On the other hand asymmetric drainage network indicate upliftment of rock which tends to tilt the basin lithology and can be seen in the field as the uplifted part shows more length of tributaries as compared to other half83. When the AF value is less than or more than 50, it suggest that the basin is tilted and developed under an active tectonic phase. When AF is more or less 50 indicate tilting towards left and right respectively70. The longitudinal profile (Figure 5) is a curve derived from association between a channel's height (H) and distance downstream (L). It depends on numerous determining factors, viz., initial relief, rock type, palaeo-geographical evolution stage and positive or negative tectonic movements70. The form of the profile, especially its degree of concavity is the result of the several factors; upwardly concave profiles could indicate protracted basin and channel deterioration due to longer time since base of ravine sinking. Upwardly convex outline indicates smaller down cutting, and a shorter time since ravine base decline70,75. Since the concept of drainage basin evolution is not utterly understood yet in Kumaun Himalayan area, here present exercise is an attempt to evaluate variety of morphometric indices to assess relative tectonic activities for better understanding of tectono- geomorphic evolution. The objective of the present exercise is to calculate morphometric indices in the Bhimtal-Naukuchiatal lake basin with respect to the neotectonics activity along the thrust/fault zones.
Study area
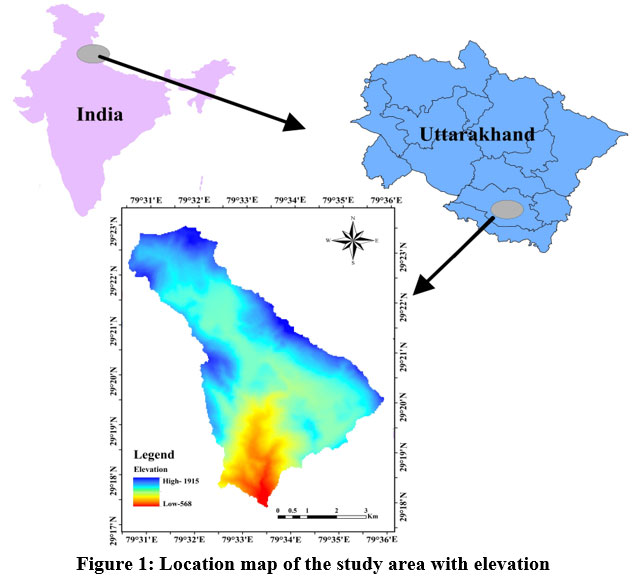
Our study area extends (79°30'Eto 79°36'E:29°17'Nto 29°24'N) with Survey of India toposheet no. 53O/11 (Figure 1). We studied a number of subsidiary thrusts and tectonic zones along which the mass movements, fault scarps and smaller palaeolakes have been developed, which shows that the area is affected by tectonics. The Bhimtal-Naukuchiatal area which comes under Kumaun Lesser Himalayan region shows rough topography which includes large valleys, low to high hills, escarpments, gorges, sag ponds, streams and rivers. The large valley formed by the NW-SE extended median part has a number of lakes and intervening terrace-like flats.33The hills with quartzite are flanked by volcanic rocks on either side of the series of lakes. The denuding agents may have exposed the volcanic rocks that make up the core of the anticline by forming a broad erosional valley that slopes towards Naukuchiatal. The sharp, elongated ridges that run NW-SE throughout the area slope gently towards the NE but climb more steeply in the SW slopes. The high hills with summits 1,863m, 1,927m, and 1,786m are located to the NE of the chain of lakes. These ridges dip NE to create a river basin that runs from NW to SE, beyond which the terrain again rises.30The Bhowali town is located in the northwest corner at elevation of 1,715 m. The terrain to the southwest of the Bhowali-Bhimtal border is extremely rough, with winding ridges that fall sharply to the SW. The peaks 1,779m, 1,773m and 1,605m mark the highest points. These lofty peaks descend down into the Gaula river valley in the south.
 | Figure 1: Location map of the study area with elevation
|
Geological and geomorphological set-up
Located at 1,356 m.s.l., the Bhimtal lake is 1.8 km in length, 0.454 km in width with a catchment area of 4.5sqkm. The shape is roughly triangular, the western limb being the largest and curved inward.31According to Thomas (1952), the lake was formed by choking of river through landslips.46 However, a detailed study around Bhimtal lake suggested that it was formed due to neotectonic activity and the palaeolake extended for about 11km.30The stratigraphy around the region is displayed in Table 1.
Table 1: Stratigraphy around study area
Lower Jaunsar
| Jantwal gaonlimestone |
| Bhawali quartzite | |
| Bhimtal volcanics | |
Salari Thrust (ST) | |
Amritpur granite (1,900 ma) | |
Main Boundary Thrust (MBT) | |
Siwalik | |
 | Figure 2: Map showing Geology of study region (after Kotlia et al., 1997).
|
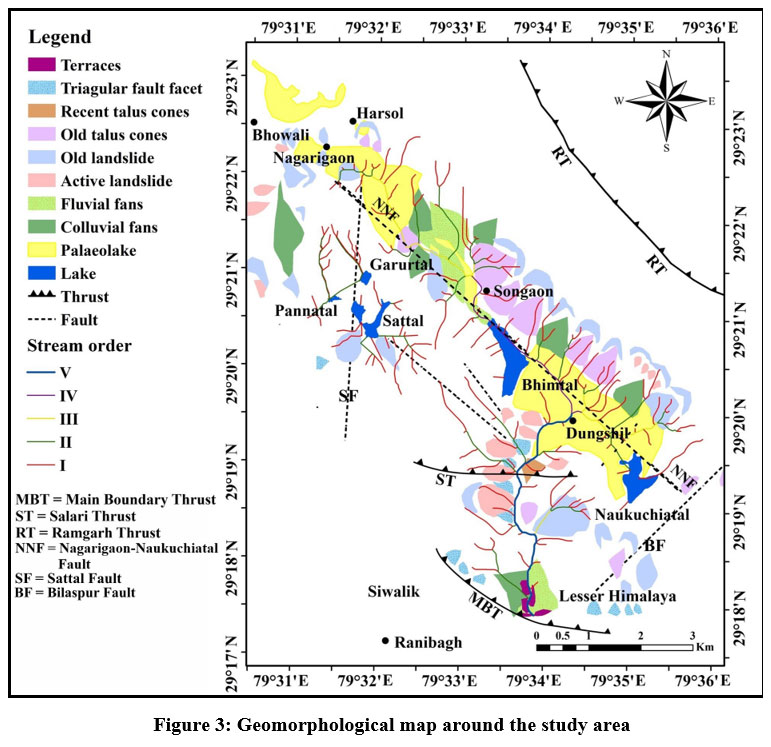
Lithology (Figure 2) around the lake mainly belongs to Bhimtal volcanics, consisting mainly of metabasites in association with meta-sedimentary formations, the later predominantly consist of quartzites with subordinate grits and phyllites and are associated with prehnite-pumpellyite metagreywacke facies and zeolite facies, grading into greenschist facies.33The main geomorphological features are, debris flow type fans, old and new landslide,depositsalluvial fans, valley scarps, triangular fault facets, talus cones, fluvial, colluvial and alluvial fans, palaeolake deposits along the Nagarigaon-Naukuchiatal fault (Figure 3) and waterfalls, entrenched meandering, shear zones as well as a deep gorge through which the palaeolake was breached.30
.jpg) | Figure 3a: Geomorphological map around the study area
|
Methodology
In this exercise, SOI toposheet No. 53O/11, ASTER-GDEM were processed in ArcGIS 10.4 version to calculate morphometric parameters, viz., Vf, HI, SL, Rb, Dd, Sµ and average Sinuosity (S), Relief (H). Drainage basins are defined using the Hydrology tools in GIS after additional processing of the DEM data. The extraction procedure incorporates void filling, flow direction, flow accumulation quantification, and drainage basin extract. Using programme MATLAB, we computed the 30 m SRTM DEM and Topo Toolbox (WGS84) to analyze the dynamics of drainage pattern with Bhimtal-Naukuchiatal basin84, 85. Topo Toolbox allows for the identification of ksn, and Chi (?) to understand the dynamics of drainage basins.
In the current exercise, various morphometric characteristics are examined, including linear parameters (stream order, bifurcation ratio), aerial or basin parameters (drainage density), relief parameters (relief), and morphometric parameters (vally floor width-height ratio, HI, stream length gradient index, steepness index, Chi, and asymmetry factor).
50The hierarchical link between the many stream segments that make up a drainage network is expressed by stream order (Sµ) which is initial stage for the whole excercise50.The number of streams in particular order (Nu) divided by the number in the next lower order is expressed by the dimensionless parameter known as the bifurcation ratio (Rb)48,50,70.Areal parameters determine how much erosion is occurring as a result of exogenic geomorphic processes70. The total stream length in a basin divided by basin's area is known as the drainage density. It specifies the relative position of drainage channels and measures the average length of streams per unit drainage area47,50. The relief parameters include basin relief (H), where H is elevation difference and is defined as the roughness of the topography48. Based morphological condition of the basins, the morphometric parameters describe the processes that define the landscape and active tectonics70. The ratio of the width and height of the valley is a value of the valley area that characterizes the uplift of an area50,76. HI describes the relative area distribution at various elevations. Higher HI values of the basin suggest that majority of the land surface is elevated compared to the mean, viz., plane highland terrain dissected by extremely sculpted channel70. Medium to less integral values are connected with uniformly distributed catchment area50. By examining potential tectonic tilting of the basins, it is feasible to determine the tectonic influence in a watershed48. Af depicts the flow-transverse direction tilting9. The Stream Length-Gradient (SL) index efficiently delineates the topographic break zones by defining the change in stream slope along a longitudinal river profile 84,85. The use of chimaps to show the migration of divides has grown in popularity. The variable chi at the divides indicates whether a drainage basin is a victim or aggressor, or whether it will lose or gain its drainage region in the future. chi (X) is a horizontal transformed coordinate taken from a drainage basin's outlet84,85. Ksn can be used to evaluate the longitudinal river channel's variability in uplift under steady state conditions. among the most widely used proxies, the steepness index (Ksn)-related SPIM driven model assesses the variation in rock upliftment in various catchments78. We selected a reference value of 0.45 to prevent anomaly changes82. Distance upstream serves as the X axis, while Ksn (on the dexter side) and elevation (on the sinister side) serve as Y axis indicators. As Ks is normalized to a reference value, different values of for the longitudinal profile result in varied Ks values. The concavity is caused by the stream power incision law (SPL), which states that along-river slopes S are related to upward area a multiplied by the negative mn-ratio, and continuous uplift hypotheses.
S ? A –m/n
According to the SPL, the amount of energy needed to incise into the stream bed depends on the stream gradient (S), the area of the upslope (A), as well as several factors (m and n).
Details of morphometric parameters are compiled in Table 2.
 | Figure 3b: Overall drainage in the study area (different stream order are shown by different color code).
|
Results
Ratio of Valley Floor Width-Height (Vf)
In present study, we took Vf values (Figure 4) from five different locations with values 0.49, 0.28, 0.19, 0.37 and 0.40. Such low values specify that the area has been controlled by recent ground movements and upliftment. Because the valley is completely encircled by peaks, the valley walls are practically vertical, indicating that the area is significantly more prone to erosion.
Table 2: Morphometric parameters with formulae
S.No | Parameters | Symbol | Formulae | References |
1. | Valley floor width to valley height ratio | Vf |
where, Vf = width-height ratio Vfw = floor width Eld = elevations of the sinister side valley divide Erd = elevations of the dexter side valley divide Esc = elevation | Keller and Pinter, 1996 |
2. | Hypsometric Integral | HI |
| A.N. Strahler, 1952;Keller and Pinter, 1996
|
3. | Stream-Length gradient Index | SL |
?H = change in elevation of the reach ?L = length of reach L = total channel length |
Keller and Pinter, 1996
|
4. | Bifurcation ratio | Rb | Rb Nµ = no. of stream of a given order Nµ+1 = no. of stream of next higher order |
Keller and Pinter, 1996
|
5. | Drainage density | Dd | Dd Lµ=total stream length of all orders, A= basin area | Horton, 1945; A. N. Strahler, 1964;
|
6. | Stream order(Sµ) and average sinuosity | S |
S = Sinuosity C = Channel length V = Valley length |
Bull & Mcfadden, 1977;
|
8. | Relief | H | H = Z-z Z = maximum elevation (m) z = minimum elevation (m) |
Strahler, 1952;
|
9. | Steepness index | Ksn |
| Flint, 1974; Kirby and Whipple, 2012). |
10. | Chi integral | (?) | ? = | Perron and Royden, 2013) |
11. | Asymmetry factor (AF) | AF |
| Cox, 1994; Keller & Printer, 2002; |
 | Figure 4: Stream profiles showing Vf values for different locations of Bhimtal basin A-A’: Profile between Khutani to Petunia, B-B’ Profile between Karkigaon to Mehragaon, C-C’: Profile across drainage just above the Bhimtal (mallital) lake, D-D’: Profile between Pandegaon to Dungsiltalla, E-E’: Dungsiltalla to Naukuchiatal.
|
Longitudinal profiles
Study area displays an upwardly concave contour, indicating extended basin and stream deterioration linked to longer periods of time. It also suggests the less channel down cutting. Figure 5 is longitudinal curve shown by river from Nagrigaon (upstream) to Amritpur (downstream).
 | Figure 5: Longitudinal stream curve
|
Hypsometric curve and Hypsometric Integral (HI)
 | Figure 6: HI index of selected area.
|
The basin contain the Nagrigaon-Naukuchiatal fault, the Bilaspur fault, and the Sattal fault have medium HI values (0.59), and sigmoidal in shape hypsometric curves, indicating that the development process is at a mature level (Figure 6). These regions are least influenced by tectonic activity and are primarily eroded.
Stream-Length (SL) Gradient Index
A total 16 km long Bhimtal stream was taken for analysis of the SL curve (Figure 7) which demonstrates that the greatest values correspond to the knickpoints regression. The abnormalities are related to the structure that divided the river portions from higher to lower stream. In our area, SL values fluctuate from 0 to 1384, which indicate possible tectonic activity. Along the longitudinal profile, major knickpoints are found at 6.5km and 12.7km from the source of the stream, which indicate occurrence of thrust and faults in vicinity.
 | Figure 7: SL index in the study area.
|
Bifurcation Ratio (Rb)
Bifurcation ratio for study area is shown below. Rb in the study area is found 4.46 which indicate the Bhimtal Naukuchiatal basin is geological more variable, pervious in nature, and thrust/fault controlled region (Table 3).
Table 3: Mean bifurcation ratio of the Stream
| Order | Stream's order | Rb | Mean Rb |
| 1 | 347 | 4.82 |
4.46 |
| 2 | 72 | 4 | |
| 3 | 18 | 6 | |
| 4 | 3 | 3 | |
| 5 | 1 |
Drainage density (Dd)
Dd is the consequence of interacting processes affecting surface runoff, which determines the drainage basin's output of water and sediment. The Dd and sinuosity for our area are shown in Table 4. Dd in the study area varies from 4.66 to 5.20 which is moderate drainage density showing the basin area impermeable or moderately impermeable underlying material, scarce vegetation, and steep topography.
Table 4: Dd and average sinuosity
| Drainage density (km/km2) | Average sinuosity |
| 4.87 | 1.06 |
| 5.20 | 1.11 |
| 4.85 | 1.11 |
| 5 | 1.16 |
| 4.66 | 1.29 |
Stream ordering (Sµ) and drainage pattern
In the study area, we observed five orders of stream (Figure 3) in the drainage network. Sinuosity is a characteristic of a river to travel from one place to another across its flood plain. The stream may leave scars of where the river channel once was as it meanders through the flood plain. A river that does not meander at all has sinuosity of 1.70The more meander in a river; closer the sinuosity value will get to 0. Due to the ruggedness of the terrain, no clear picture of the drainage pattern is observed but, in general, it is noticed that various small streams flowing down the slopes of the high ridges, join one or the other streams, which ultimately give rise to a few south-easterly bigger streams which are more braided in nature. There are three big streams of which the most prominent one is the Gaula river in the extreme south, just outside the investigation area. It flows due west and receives water from the various south-west flowing smaller streams that drain the slopes of Barchuna Dhar. Another striking stream, Nauti gad which originates near Bhowali and meets the Bhimtal lake. It flows out of the lake due south and meets the river Gaula. This stream is known as Bhimtal Gadhera. Another important stream is Champi gad in the NE that originates along the slopes of Tani peak as Tandi Gad, meets Kalsa river (that flows from E to W) and finally flows due SE meeting Malwatal area. The Kalsa gad and Champi gad show phenomenon of the incised meandering. All these streams except Gaula, contain little water during the summer months.
Relief
The difference in elevation of the earth's surface or comparative vertical disparity of the land surface is termed as relief. Relative relief approaches can efficiently depict three-dimensional maps without taking into account sea level, as well as variances in altitude50. It is generally, the “ruggedness” of the topography, particularly, the highest elevation minus the lowest elevation in a given area. The study area occupies highly variable relief and the relief values vary from minimum 509 to maximum 1,839 m and are classified into five groups (Figure 8).
 | Figure 8: Relief map of Bhimtal- Naukuchiatal basin.
|
Steepness index (Ksn)
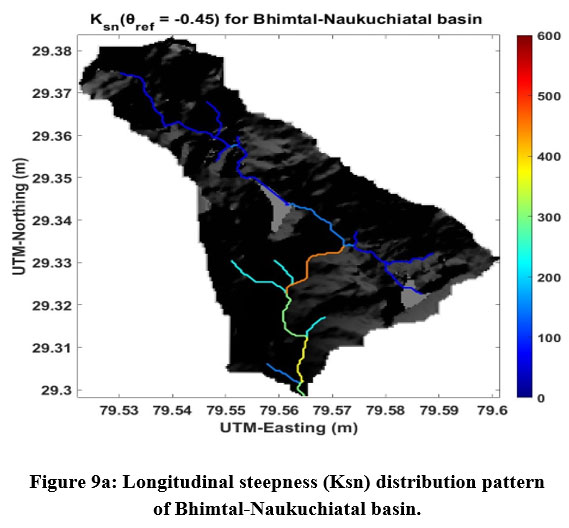
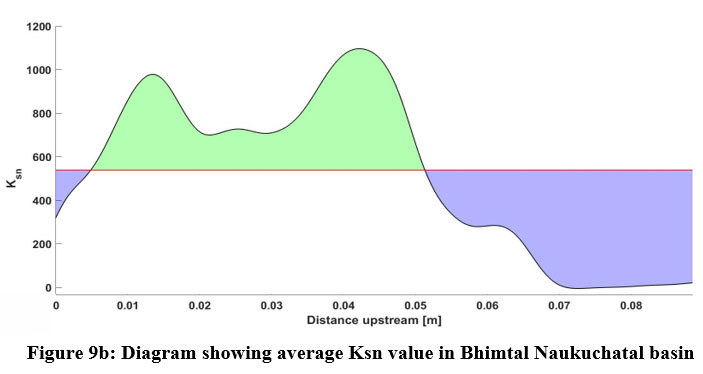
The variable Ksn values shown by major streams are shown in Figure 9a. The southern part of the basin showing high values of Ksn as compared to northern part which indicate the southern block of Nagrigaon Nakuchiatal fault is uplifted and northern block is down faulted block. The values of ksn is around 550 shown in Figure 9bwith thick red horizontal line represents the average Ksn value, and the green and blue curving areas represent positive and negative Ksn anomalies, respectively (Figure 9b). The values of ksn are around 550 which suggest that the basin is experiencing rapid tectonic upliftment.
 | Figure 9a: Longitudinal steepness (Ksn) distribution pattern of Bhimtal-Naukuchiatal basin.
|
 | Figure 9b: Diagram showing average Ksn value in Bhimtal Naukuchatal basin
|
Chi integral (X)
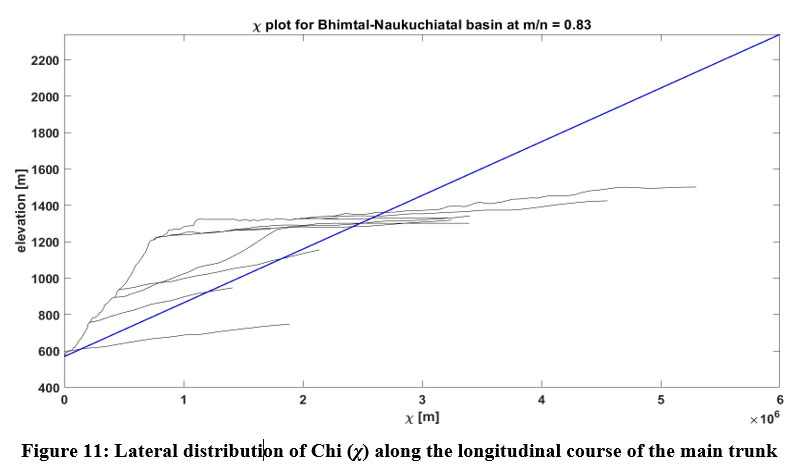
The Chi (X) plot for different values of mn is shown in Figure 10. Figure 11 shows the lateral distribution of Chi along the longitudinal course of the main trunk and tributary stream. From the Chi plot of Bhimtal-Naukuchiatal, it is clear that towards the upper reaches, the erosion activity (elevation range 1300 to 1500) is very high. Towards the middle riches of the river, the Chi values indicate lesser erosion activity and, in this portion, the rivers are actively incising due to tectonic uplift. Further, towards the lower reaches, the gradient change is caused by tectonically enhanced upliftment processes.
.jpg) | Figure 10: Chi (X) plot of Bhimtal-Naukuchiatal for different values of mn
|
 | Figure 11: Lateral distribution of Chi (X) along the longitudinal course of the main trunk
|
Asymmetry factor (AF)
The values of AF for Bhimtal Naukuchiatal basins is 40 which is less than 50, indicates tilting towards right facing downstream. Many hillslopes in the Bhimtal basin have lost their stability, resulting in increasing degradation and the occurrence of slope failures, especially throughout the MBT belt and fault valleys in Bhimtal streams. Slumps and rock falls are more prevalent on abrupt gradient, and debris flows occur on worn and previous landslide debris, whilst rock falls impact semi-consolidated old landslide fans and cones.
Discussion
The drainage system in the area follows a dendritic drainage pattern in whole Bhimtal Naukuchiatal basin. Lithology, structure, and topography all influence the drainage pattern. By observing the allotment of relative relief it is concluded that the basin consists mainly of mountainous terrain. The results show that most of the river streams are controlled by the intense pattern of NE-SW trending faults that can also be seen in the longitudinal profile. The structure of the valley floor is examined in relation to the valley's tectonic background. By calculating Vf value for different location of the study area, low values of Vf indicating high upliftment rate and more incision. Active tectonic modification can alter river system geometry which affects aggradational and degradational processes. This distortion is more obvious as streams and terraces are displaced across faults. Upwardly concave profile is obtained in the study area, which indicates the prolonged basin and the channel degradation associated with longer periods. As a result, morphometric variables and field geomorphic traits demonstrate that the region is structurally active. Differential upliftment, tilting in the Bhimtal Naukuchiatal basin all along and across the Nagrigaon Naukuchiatal fault, sattal fault and salari thrust is observed which is shown in the Figure 2 and the degree of tilting which is represented by AF values. Similarly we estimated channel sinuosity for all the tributary streams of main channel and observed that the sinuosity of trunk and tributary streams are varies from 1.06 to 1.29 which indicate most of the streams are braided in nature. The observed values of sinuosity indicate youth stage of channel where channel migration and subsequent incision is governed by active deformation. The steepness values and chi graph also indicate the Bhimtal Naukuchiatal basin is experiencing differential upliftment.
Conclusion
To create clear picture of relative tectonic activities occurring within Bhimtal- Naukuchiatal basin, we calculated morphotectonic proxies, such as the Vf, HI, SL, Bifurcation ratio (Rb), Drainage density (Dd), Stream Order (Sµ) and average Sinuosity (S), Relief (H), steepness (Ksn), Chi integral (?) And Asymmetric Factor (AF). The low value of Vf indicates high upliftment rate, more incision and less channel down cutting. The research area has intermediate HI values as well as a sigmoidal-shaped hypsometric curve, both of which signify a mature stage of river development. The SL values range from 0 to 1384, which suggests potential tectonic activity. The average bifurcation ratio as 4.46 indicates potential structural control. The Ksn values are approximately 550, suggesting that the basin is undergoing rapid tectonic upliftment. From the Chi plot, it is evident that erosion activity is particularly active in the higher reaches of channel (elevation range: 1300 to 1500), whereas the intermediate and down portions of the river show less erosion activity and active tectonic uplift. The calculated value of AF for Bhimtal Naukuchiatal is 40 which indicate the tilting of the basin is towards right. The faults in and around the study area are responsible for recent mass movement and also make the more vulnerable for landslide disaster. Construction should be banned in vicinity of fragile rocks, thrust/fault zone as there is a limit to how much weight these brittle, worn, steep angle slopes can support. Plantation should be done in and around the active landslide zones and awareness programs related to landslide hazard should be organized among the local population for better understanding of their habitat environment.
Acknowledgements
The Authors are thankful to Head, Department of Geology, Centre of advanced studies in Geology, Kumaun University Nainital for his support and the working facilities throughout the work. We area thankful to all authors for helping each other to make maps and writing work.
Conflict of Interest
The authors declare no conflicts of interest.
Funding Sources
There is no funding or financial support for this research work.
References
- Valdiya KS. Uplift and geomorphic rejuvenation of the Himalaya in the Quaternary period. Curr Sci. 1993;64:873-885. https://www.jstor.org/stable/24096201.
- Bookhagen B, Thiede RC, Strecker MR. Late Quaternary intensified monsoon phases control landscape evolution in the northwest Himalaya. Geology. 2005;33(2):149-152. doi:10.1130/G20982.1.
- Pérez-Peña JV, Azor A, Azañón JM, Keller EA. Active tectonics in the Sierra Nevada (Betic Cordillera, SE Spain): insights from geomorphic indexes and drainage pattern analysis. Geomorphology. 2010;119(1-2):74-87. doi:10.1016/j.geomorph.2010.02.020.
- Pazzaglia FJ. Fluvial terraces. Fluvial GeomorphologyShroder JF, Wohl E, eds.; vol9; 2013:379-412.
- Joshi LM, Kotlia BS. Neotectonically triggered instability around the palaeolake regime in Central Kumaun Himalaya, India. Quat Int. 2015;371:219-231. doi:10.1016/j.quaint.2014.10.033.
- El Hamdouni R, Irigaray C, Fernández T, Chacón J, Keller EA. Assessment of relative active tectonics, southwest border of the Sierra Nevada (southern Spain). Geomorphology. 2008;96(1-2):150-173. doi:10.1016/j.geomorph.2007.08.004.
- Gansser A. Geology of the Himalayas. Wiley Interscience; 1964:1-289.
- Tapponnier P, Molnar P. Active faulting and tectonics in China. J Geophys Res. 1977;82(20):2905-2930. doi:10.1029/JB082i020p02905.
- Joshi LM, Kotlia BS. Tectonic footprints and landscape evaluation along kulur river valley, Kumaun lesser Himalaya, India. J Asian Earth Sci. 2018;162:121-136. doi:10.1016/j.jseaes.2018.04.023.
- Valdiya KS. Geology of Kumaun Lesser Himalaya. Wadia Institute of Himalayan Geology; 1980.
- Yin A. Cenozoic tectonic evolution of the Himalayan orogen as constrained by along-strike variation of structural geometry, exhumation history, and foreland sedimentation. Earth Sci Rev. 2006;76(1-2):1-131. doi:10.1016/j.earscirev.2005.05.004.
- Célérier J, Harrison TM, Webb AAG, Yin A. The Kumaun and Garwhal lesser Himalaya, India: Part 1. Structure and stratigraphy. GeolSoc Am Bull. 2009;121(9-10):1262-1280. doi:10.1130/B26344.1.
- Valdiya KS. An outline of the structural set-up of the Kumaun Himalaya. Geological Society of India. 1979;20(4):145-157.
- Valdiya KS. Geology of Kumaun Lesser Himalaya. Wadia Institute of Himalayan Geology; 1981.
- Mathur, S. M., (1955) ‘On the origin of Bhimtal and neighbouring lakes in the Naini Tal district, UP. Quarterly Journal of the Geological Mining and Meteorological Society of India, v. 27(4), pp. 125-180.
- Nakata T. Active faults of the Himalaya of India and Nepal. Geol Soc Am Spec Pap. 1989; 232(1):243-264.
- Pant PD, Goel OP, Joshi M. Neotectonic movements in the Loharkhet area, district Almora, KumannFiimalaya. Geological Society of India. 1992;39(3):245-253.
- Sundriyal YP, Tripathi JK, Sati SP, Rawat GS, Srivastava P. Landslide-dammed lakes in the Alaknanda Basin, Lesser Himalaya: causes and implications. Curr Sci. 2007;93(4):568-574.
- Pathak V, Pant CC, Darmwal GS. Geomorphological and seismological investigations in a part of western Kumaun Himalaya, Uttarakhand, India. Geomorphology. 2013;193:81-90. doi:10.1016/j. geomorph.2013.04. 007.
- Kothyari GC, Luirei K. Late Quaternary tectonic landforms and fluvial aggradation in the Saryu River valley: central Kumaun Himalaya. Geomorphology. 2016;268:159-176. doi:10.1016/j.geomorph.2016.06.010.
- Kothyari GC, Kotlia BS, Talukdar R, Pant CC, Joshi M. Evidences of neotectonic activity along Gorigangariver, higher central Kumaun Himalaya, India. Geol J. 2020;55(9):6123-6146. doi:10.1002/gj.3791.
- Valdiya KS, Kotlia BS. Fluvial geomorphic evidence for Late Quaternary reactivation of a synclinally folded nappe in Kumaun Lesser Himalaya. Geological Society of India. 2001;58(4):303-317.
- Jain V, Sinha R. Response of active tectonics on the alluvial Baghmati River, Himalayan foreland basin, eastern India. Geomorphology. 2005;70(3-4):339-356. https:.doi:10.1016/j.geomorph.2005.02.012.
- Kale VS, Shejwalkar N. Uplift along the western margin of the Deccan basalt Province: is there any geomorphometric evidence? J Earth Syst Sci. 2008;117(6):959-971. doi:10.1007/s12040-008-0081-3.
- Dehbozorgi M, Pourkermani M, Arian M, Matkan AA, Motamedi H, Hosseiniasl A. Quantitative analysis of relative tectonic activity in the Sarvestan area, central Zagros, Iran. Geomorphology. 2010;121(3-4):329-341. doi:10.1016/j.geomorph.2010.05.002.
- Bahrami S. Analyzing the drainage system anomaly of Zagros basins: implications for active tectonics. Tectonophysics. 2013;608:914-928. doi:10.1016/j.tecto.07. 026.
- Burbank DW, Anderson RS. Tectonic Geomorphology. John Wiley & Sons; 2009.
- Malik JN, Mohanty C. Active tectonic influence on the evolution of drainage and landscape: geomorphic signatures from frontal and hinterland areas along the Northwestern Himalaya, India. J Asian Earth Sci. 2007;29(5-6):604-618. doi:10.1016/j.jseaes.2006.03.010.
- Taloor AK, Joshi LM, Kotlia BS, et al.Tectonic imprints of landscape evolution in the Bhilangana and Mandakini basin, Garhwal Himalaya, India: a geospatial approach. Quat Int. 2021;575-576:21-36. doi:10.1016/j.quaint.2020.07.021.
- Kotlia BS, Bhalla MS, Sharma C, et al.Palaeoclimatic conditions in the Upper Pleistocene and Holocene Bhimtal-Naukuchiatal lake basin in south-central Kumaun, North India. PalaeogeogrPalaeoclimatolPalaeoecol. 1997;130(1-4):307-322. doi:10.1016/S0031-0182(96)00126-5.
- Kotlia BS, Hinz-Schallreuter I, Schallreuter R, Schwarz J. Evolution of Lamayurupalaeolake in the Trans Himalaya: palaeoecological implications. EiszeitalterGgw. 1998;48:23-36. doi:10.3285/eg.48.1.16.
- Kotlia BS, Sanwal J, Phartiyal B, Joshi LM, Trivedi A, Sharma C. Late Quaternary climatic changes in the eastern Kumaun Himalaya, India, as deduced from multi-proxy studies. Quat Int. 2010;213(1-2):44-55. doi:10.1016/j.quaint.2009.09.002.
- Valdiya KS, Kotlia BS, Pant PD, et al.Quaternary palaeolakes in Kumaun Lesser Himalaya: finds of neotectonic and palaeoclimatic significance. Curr Sci. 1996;70(2):157-161.
- Thakur VC. Active tectonics of Himalayan frontal thrust and seismic hazard to Ganga Plain. Curr Sci. 2004;86:1554-1560. https://www.jstor.org/stable/24108706.
- Thomas, A. N., (1952) On the origins of the Kumaon lakes in the Himalayas. Geological Magazine, v. 89(6), pp. 385-400.
- Goswami PK, Pant CC. Morphotectonic evolution of the Binau–Ramganga–Naurar transverse valley, southern Kumaun Lesser Himalaya. Curr Sci. 2008;94(12):640-1645. https://www.jstor.org/stable/24100904.
- Joshi LM, Pant PD, Kotlia BS, Kothyari GC, Luirei K, Singh AK. Structural Overview and morphotectonic evolution of a strike-slip fault in the zone of North Almora Thrust, Central Kumaun Himalaya, India. J Geol Res. 2016;2016:1-16. doi:10.1155/2016/6980943.
- Seeber L, Gornitz V. River profiles along the Himalayan arc as indicators of active tectonics. Tectonophysics. 1983;92(4):335-367. doi:10.1016/0040-1951(83)90201-9.
- Rhea S. Geomorphic observations of rivers in the Oregon Coast Range from a regional reconnaissance perspective. Geomorphology. 1993;6(2):135-150. doi:10.1016/0169-555X(93)90043-2.
- Taloor AK, Ray PKC, Jasrotia AS, et al.Active tectonic deformation along reactivated faults in Binta basin in Kumaun Himalaya of north India: inferences from tectono-geomorphic evaluation. Geomorphologie. 2017;61(2):159-180. doi:10.1127/zfg/2017/0417.
- Kotlia BS, Goswami PK, Joshi LM, Singh AK, Sharma AK. Sedimentary environment and geomorphic development of the uppermost Siwalik molasse in Kumaun Himalayan Foreland Basin, North India. Geol J. 2018;53(1):159-177. https:.doi:10.1002/gj.2883.
- Nakata, T. (1972). Geomorphic history and crustal movement of the foot-hills of the Himalayas. Science Report Tohoku Univ. 7th series (Geography), 22, 39-177
- Nakata, T., Otsuki, K., & Khan, S. H. (1990). Active faults, stress field and plate motion along the Indo-Eurasian plate boundary. Tectonophysics, 181(1-4), 83-95. https://doi.org/ 10.1016/0040-1951(90)90009-W
- Valdiya, K. S. (1992). The main boundary thrust zone of the Himalaya, India
- Valdiya, K. S. (2003). Reactivation of Himalayan frontal fault: implications. Current Science, 1031-1040
- Kumar, L., Joshi, G., Singh, S., & Agarwal, K. K. Morphometry and morphostructural studies of the parts of GolaandKalsa River BasinsaroundChanphi-Okhalkanda, Kumaun Outer and Lesser Himalaya, Uttrakhand, India.
- Thomas, J., Joseph, S., & Thrivikramaji, K. P. (2010). Morphometric aspects of a small tropical mountain river system, the southern Western Ghats, India. International Journal of Digital Earth, 3(2), 135-156.
- Agrawal, N., Gupta, L., & Dixit, J. (2022). Geospatial assessment of active tectonics using SRTM DEM-based morphometric approach for Meghalaya, India. All Earth, 34(1), 39-54.
- El Hamdouni, R., Irigaray, C., Fernández, T., Chacón, J., & Keller, E. A. (2008). Assessment of relative active tectonics, southwest border of the Sierra Nevada (southern Spain). Geomorphology, 96(1-2), 150-173.
- Keller, E. A., & Pinter, N. (2002). Active tectonics (Vol. 338). Upper Saddle River, NJ: Prentice Hall.
- Harrison, T. M., Copeland, P., Kidd, W. S. F., & Yin, A. N. (1992). Raising tibet. Science, 255(5052), 1663-1670. DOI: 10.1126/science.255.5052.1663
- Harrison, T. M., Yin, A., Ryerson, F. J., Crowley, T. J., & Burke, K. C. (1998). Orographic evolution of the Himalaya and Tibetan plateau. Oxford Monographs on Geology and Geophysics, 39, 39-72
- Burtman, V. S., & Molnar, P. (1993). Geological and geophysical evidence for deep subduction of continental crust beneath the Pamir. DOI:10.1130/SPE281-p1
- Royden, L. H., Burchfiel, B. C., King, R. W., Wang, E., Chen, Z., Shen, F., & Liu, Y. (1997). Surface deformation and lower crustal flow in eastern Tibet. science, 276(5313), 788-790. DOI: 10.1126/science.276.5313.788
- Ramstein, G., Fluteau, F., Besse, J., &Joussaume, S. (1997). Effect of orogeny, plate motion and land–sea distribution on Eurasian climate change over the past 30 million years. Nature, 386(6627), 788-795. DOI: 10.1038/386788a0
- Kothyari, G. C., &Luirei, K. (2016). Late Quaternary tectonic landforms and fluvial aggradation in the Saryu River valley: Central Kumaun Himalaya. Geomorphology, 268, 159-176. https://doi.org/10.1016/j.geomorph.2016.06.010
- Kothyari, G. C., Joshi, N., Taloor, A. K., Kandregula, R. S., Kotlia, B. S., Pant, C. C., & Singh, R. K. (2019). Landscape evolution and deduction of surface deformation in the Soan Dun, NW Himalaya, India. Quaternary International, 507, 302-323. https://doi.org/10.1016/j.quaint.2019.02.016
- Kothyari, G. C., Kotlia, B. S., Talukdar, R., Pant, C. C., & Joshi, M. (2020). Evidences of neotectonic activity along Goriganga river, higher central Kumaun Himalaya, India. Geological Journal, 55(9), 6123-6146. https://doi.org/10.1002/gj.3791
- Bookhagen, B., & Burbank, D. W. (2006). Topography, relief, and TRMM?derived rainfall variations along the Himalaya. Geophysical Research Letters, 33(8). https://doi.org/10.1029/2006GL026037
- Kirby, E., & Whipple, K. X. (2012). Expression of active tectonics in erosional landscapes. Journal of structural geology, 44, 54-75. DOI:10.1016/j.jsg.2012.07.009
- Lavé, J., &Avouac, J. P. (2000). Active folding of fluvial terraces across the Siwaliks Hills, Himalayas of central Nepal. Journal of Geophysical Research: Solid Earth, 105(B3), 5735-5770. https://doi.org/10.1029/1999JB900292
- Kothyari, G. C., Shukla, A. D., &Juyal, N. (2017). Reconstruction of Late Quaternary climate and seismicity using fluvial landforms in Pindar River valley, Central Himalaya, Uttarakhand, India. Quaternary International, 443, 248-264. https://doi.org/10.1016/j.quaint.2016.06.001
- Seeber, L., &Gornitz, V. (1983). River profiles along the Himalayan arc as indicators of active tectonics. Tectonophysics, 92(4), 335-367. https://doi.org/10.1016/0040-1951(83)90201-9
- Wells, S. G., Bullard, T. F., Menges, C. M., Drake, P. G., Karas, P. A., Kelson, K. I., ... &Wesling, J. R. (1988). Regional variations in tectonic geomorphology along a segmented convergent plate boundary pacific coast of Costa Rica. Geomorphology, 1(3), 239-265. https://doi.org/10.1016/0169-555X(88)90016-5
- Dehbozorgi, M., Pourkermani, M., Arian, M., Matkan, A. A., Motamedi, H., &Hosseiniasl, A. (2010). Quantitative analysis of relative tectonic activity in the Sarvestan area, central Zagros, Iran. Geomorphology, 121(3-4), 329-341. http://dx.doi.org/10.1016/j.geomorph.2010.05.002
- Summerfield, M. A. (2014). Global geomorphology. Routledge. https://api.taylorfrancis.com/content/books/mono/download?identifierName=doi&identifierValue=10.4324/9781315841182&type=googlepdf
- Mesev, V., & Walrath, A. (2007). GIS and remote sensing integration: in search of a definition (pp. 1-16). John Wiley and Sons, Chichester.
- Demirkesen, A. C. (2008). Digital terrain analysis using Landsat?7 ETM+ imagery and SRTM DEM: a case study of Nevsehir province (Cappadocia), Turkey. International Journal of Remote Sensing, 29(14), 4173-4188. DOI:10.1080/01431160801891812
- Sharma, S., & Sarma, J. N. (2017). Application of drainage basin morphotectonic analysis for assessment of tectonic activities over two regional structures of the northeast India. Journal of the Geological Society of India, 89, 271-280.
- Keller EA, Pinter N. Active Tectonics; vol338. Prentice Hall; 1996.
- Bull WB, McFadden LD. Tectonic Geomorphology North and South of the Garlock Fault, California. Geomorphology in Arid Regions. Routledge; 2020:115-138.
- Peters G, van Balen RT. Tectonic geomorphology of the northern Upper Rhine graben, Germany. Glob Planet Change. 2007;58(1-4):310-334. doi:10.1016/j.gloplacha.2006.11.041.
- Ntokos D, Lykoudi E, Rondoyanni T. Geomorphic analysis in areas of low-rate neotectonic deformation: south Epirus (Greece) as a case study. Geomorphology. 2016;263:156-169. doi:10.1016/j.geomorph.2016.04.005.
- China S. Morphotectonic and lithostratigraphic analysis of intermontane Karewa Basin of Kashmir Himalayas, India. J Mt Sci (Bimonthly, Started in 2004). 2013;10(1).
- Smith, K. G. (1950). Standards for grading texture of erosional topography. American journal of Science, 248(9), 655-668.
- Horton RE. Erosional development of streams and their drainage basins: hydro physical approach to quantitative morphology. Bull GeolSoc Am. 1945;56(3):275-370, 275e370. doi:10.1130/0016-7606(1945)56[275:EDOSAT]2.0.CO;2.
- Strahler AN. Quantitative geomorphology of drainage basins and channel networks. In: Chow V, ed.Handbook of Applied Hydrology. McGraw-Hill; 1964:439-476.
- Whipple KX, Tucker GE. Dynamics of the stream?power river incision model: implications for height limits of mountain ranges, landscape response timescales, and research needs. J Geophys Res. 1999;104(B8):17661-17674. doi:10.1029/1999JB900120.
- Kothyari GC, Joshi N, Taloor AK, et al. Reconstruction of active surface deformation in the Rishi Ganga basin, Central Himalaya using PSInSAR: a feedback towards understanding the 7th February 2021 Flash Flood. Adv Space Res. 2022;69(4):1894-1914. doi:10.1016/j.asr.2021.07.002.
- Joshi N, Kothyari GC, Pant CC. Drainage conformation and transient response of river system in thrust segmentation of Northwest Himachal Himalaya, India. Quat Int. 2021;575:37-50. doi:10.1016/j. quaint.2020. 05.024.
- Gailleton B, Mudd SM, Clubb FJ, Grieve SWD, Hurst MD. Impact of changing concavity indices on channel steepness and divide migration metrics. J Geophys Res Earth Surf. 2021;126(10):JF006060:e2020. doi:10.1029/2020JF006060.
- Willett SD, McCoy SW, Perron JT, Goren L, Chen CY. Dynamic reorganization of river basins. Science. 2014;343(6175):1248765.10.1126. doi:10.1126/science.1248765
- Schumm SA, Dumont JF, Holbrook JM. Active tectonics and alluvial rivers2002. Cambridge University Press:276. https://www.researchgate.net/profile/Arie-Seijmonsbergen/publication/239841218_Book_review_active_tectonics_and_alluvial_rivers/links/5ad21224aca272fdaf78b120/Book-review-active-tectonics-and-alluvial-rivers.pdf;
- Schwanghart, W., Kuhn, N. J. (2010): TopoToolbox: a set of Matlab functions for topographic analysis. Environmental Modelling & Software, 25, 770-781. [DOI: 10.1016/j.envsoft.2009.12.002]
- Schwanghart, W., Scherler, D. (2014): TopoToolbox 2 – MATLAB-based software for topographic analysis and modeling in Earth surface sciences. Earth Surface Dynamics, 2, 1-7. [DOI: 10.5194/esurf-2-1-2014]


