Multitemporal Analysis of Land Use/Cover Changes and Landscape Fragmentation in Murshidabad District of West Bengal, India
Md. Mustaquim
*
 and Woheeul Islam
1
Department of Geography,
Aliah University,
Kolkata,
West Bengal
India
http://dx.doi.org/10.12944/CWE.18.2.18
Copy the following to cite this article:
Mustaquim M, Islam W. Multitemporal Analysis of Land Use/Cover Changes and Landscape Fragmentation in Murshidabad District of West Bengal, India. Curr World Environ 2023;18(2). DOI:http://dx.doi.org/10.12944/CWE.18.2.18
Copy the following to cite this URL:
Mustaquim M, Islam W. Multitemporal Analysis of Land Use/Cover Changes and Landscape Fragmentation in Murshidabad District of West Bengal, India. Curr World Environ 2023;18(2).
Download article (pdf)
Citation Manager
Publish History

Introduction
Earth is a dynamic body, change is the nature of the earth, but this change is triggered by human actions over the earth's surface1. Land use and land cover (LULC) are two terms that echo different meanings. Land use denotes to man's activity, various uses, and management of land and its resources. In contrast, land cover refers to a bio-physical covering over the earth's surface, which includes water, vegetation, soil, bare rock, and artificial structures, among other things2. Alterations to the environment by human activity over the past few decades have increased significantly3,4.The human being's need and greed to sustain themselves altered the earth's natural environment, and that change affected us. Human beings have a basic need to sustain themselves by accessing resources from the environment. Over time, this need has evolved into a desire for more, driven by greed and consumption. In pursuit of fulfilling these desires, human have significantly altered the earth's natural environment through activities like deforestation, industrialization, and pollution. As a consequence, these changes have had adverse effects on our ecosystem, leading to climate change, loss of biodiversity, and other environmental issues that now pose serious threats to our well-being and survival. Increased commercial activity, migration, and rapid population growth transform land use and land covers faster5,6. As people's earnings rise, led to urbanization and it can affect the economy and ecology. As the world's population grows, so does the demand for food and greater economic infrastructure, putting pressure on available land1,7. With rising levels of economic growth, urban forms and land use are causing a significant landscape change8.Unfortunately, there are no restrictions on land use conversion, so it has been done indiscriminately and inappropriately, which could seriously damage the ecosystem and the environment9. Land use and land cover map of any area is necessary to ensure its sustainability and to help in planning and managing of it. Land use studies frequently employ landscape metrics as a numerical indicator to gauge the spatial patterns of the landscape10. Landscapes are referred in geography as the combination of environmental and human phenomena that coexist in certain places on the surface of the globe11. A region's sustainability can be examined with the help of a proper understanding of land use. Human actions are the basis for any modification in land use. This study was conducted utilizing multi-temporal data to see changes and development in land use in the Murshidabad district from 1991 to 2021.The extent of land use change may be calculated using the Landscape metrics10. The Landscape metrics can be used to create spatial patterns of regional morphology. Many researchers utilize landscape metrics to track changes in land use, urban sprawl, and regional form. This study measures characterize land use fragmentation using Landscape Metric analysis with FRAGSTAT software. Many metrics are used in landscape-related research because they are based on geometric characteristics of landscape elements and can give straightforward quantitative assessments of complicated patterns12.This research looks the effects of dynamic transformations in land use and land cover on environmental analyses using a variety of metrics. Although, the transformation of land use can alter the rate of the ecological cycle13.Poor and unmanageable conversion and modification of land are major drivers of change in ecological, biological, and social processes14.
For a secure and healthy world, it is necessary to figure out and monitor this shift. It is now widely acknowledged that satellite-based data can be used to generate useful information for LULC15,16. The use of remote sensing data has made it feasible to investigate the changes in land cover in less time, at a lower cost, and with greater precision in conjunction with the Geographical Information System (GIS), which provides an appropriate medium for data collection, updating, and retrieval17-20. Its synoptic view, fixed temporal resolution, and cost-effectiveness make integrations of GIS and remote sensing useful tools for monitoring, mapping, and tracking change21-24.
Study Area
Murshidabad district is the northern most district of the Presidency Division and is located on the Eastern Peripheral Plains of West Bengal. Since 1947, when India gained independence, it has formed the eastern international boundary of the state bordering Bangladesh (formerly East Pakistan). Murshidabad is located in the heart of West Bengal, between 24º50'20" N and 23º43'30" N latitudes and 88º46'00" E and 87º49'17" E longitudes (Fig.1). Murshidabad district covers a total area of 5324 km225,26.
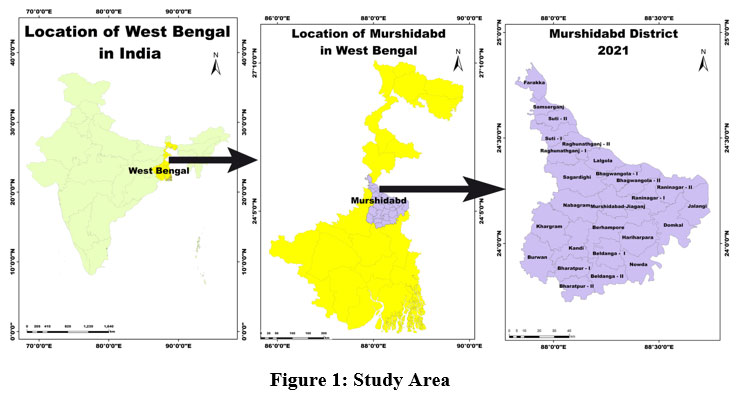 | Figure 1: Study Area
|
Murshidabad district is situated on the lower Gangetic plain. In the eastern portion of the Bhagirathi River, it resembles a dormant delta. The Bhagirathi River splits the district into approximately two equal halves. Bagri is the name of the eastern region, and Rarh is the name of the western part. Between these two areas of the district, diversity predominated in terms of socio-cultural characteristics, physiographic structure, and agricultural patterns27. Murshidabad district is a predominantly agrarian society. The typical monthly temperature ranges from 17°C to 35°C, while the average annual temperature is roughly 27°C. Summertime highs frequently exceed 40 °C. Wintertime lows range from 9°C to 11°C. May is the hottest month on average, with daily average temperatures, while January is the coldest month. The Bay of Bengal branch of the South-west monsoon lashes the city between June and September, providing the district with the majority of its annual rainfall. Annual rainfall is about 1,600 mm, with 300 mm of rain falling during August's monsoon season. The population density of the district has increased from 427 persons per km2 in 1961 to 1,334 persons per km2 in 2011. Similarly, the rural population density has raised from 396 persons per km2 in 1961 to 1,130 persons per km2 in 2011. It was also observed that the urban population density increased until 2001 but declined to 5,076 persons per km2 in the 2011 Census, down from 5,685 persons per km2 in the 2001 Census. The decadal growth rate is an essential indication of a district's and country's population dynamics. The district's total growth rate (Fig.2) has been dropping from 33.5% in 1951 to 21.1% in 2011, with exception of 1981-1991, when it climbed 28.2% from 25.5% in 197-81.
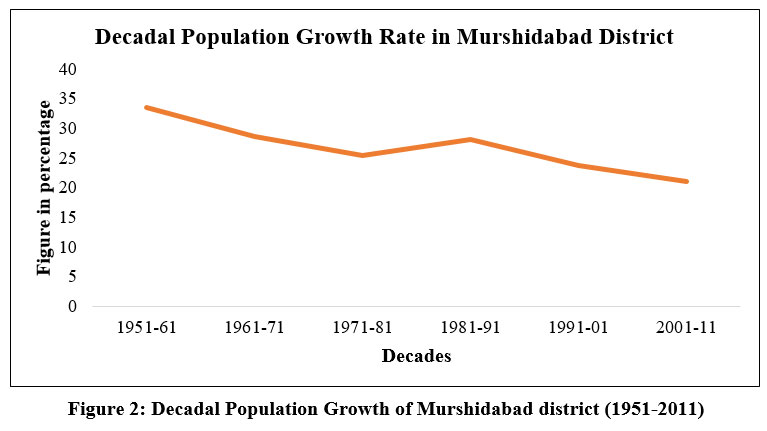 | Figure 2: Decadal Population Growth of Murshidabad district (1951-2011).
|
Database and Methodology
The datasets and methodology used in this paper are covered with all methodological elements, such as data collecting, data integration and data processing. Landsat Imagery is used here to map land use and land cover because of its easy availability and regularity35. The USGS Earth Explorer website has provided satellite imagery free of cost. For this investigation, we used 10-year interval photos from 1991 to 2021. Table 1 contains all pertinent details regarding the images.
Table 1: Details of satellite images used in the study
Year | Acquisition Date | Satellite | Sensor | Path/Row | Spatial Resolution (m) | Projection |
1991 | 02-02-1991 | Landsat 5 | TM | 138/43 | 30 | UTM-WGS84 |
24-01-1991 | 139/43 | |||||
2001 | 12-01-2001 | Landsat 5 | TM | 138/43 | 30 | UTM-WGS84 |
19-01-2001 | 139/43 | |||||
2011 | 23-12-2010 | Landsat 5 | TM | 138/43 | 30 | UTM-WGS84 |
14-12-2010 | 139/43 | |||||
2021 | 02-12-2020 | Landsat 8 | OLI/TIRS | 138/43 | 30 | UTM-WGS84 |
25-12-2020 | 139/43 |
Source: USGS Earth Explorer
Methodology
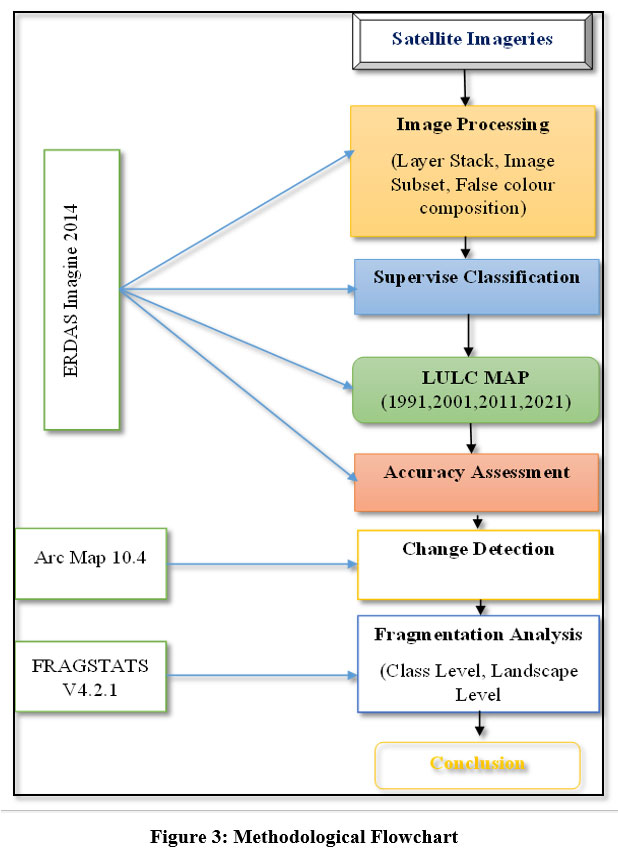
Methods adopted for this study are divided into three categories: classifying the area's land use and land cover, detecting changes, and identifying anthropogenic disturbances through fragmentation analysis (Fig.3).
Image Classification
ERDAS IMAGINE 2014 software extracted thematic details from the image for the land use and land cover classifications. Each land-use category has been given a signature based on visual perception techniques for accurate identification. The image was classified using the Maximum Likelihood Algorithm's Supervised Classification method. Alam et al. (2021)28, Saber et al. (2021)29, Roy & Kasemi (2021)30, and Chowdhury et al. (2020)31 were some of the more recent researchers who employed supervised classification with the MCL technique to identify the LULC change. The appropriate changes (Recode) were done after categorizing the satellite images to produce the map of land use and land cover. Four classes of land use and land cover, namely built-up areas, water bodies, plantation or forest land, sand bars, and agricultural land (Table 2), are observed in the district. This modified classification scheme was created based on the statistical manual for classification of the district's land use statistics, prior knowledge of the area, and the suitability of the current work as determined by various literature studies. It was adopted from the NATMO district planning series map of Murshidabad district.
 | Figure 3: Methodological Flowchart
|
Table 2: LULC Class Description
LULC Classes | Descriptions |
Agriculture | Land that is mainly used to grow crops and vegetables. |
Built-up | man-made or artificial structures like Settlements, roads, etc. |
Plantation or Forest | The light vegetation consists of areas where crops are grown, some small trees, and some orchards. |
Water Bodies | There are rivers, ponds, water-logged areas, etc. |
Source: Compiled by authors
Finally, the overall accuracy and the kappa coefficient are used for the accuracy evaluation of the classified image32-34. A Google Earth map and local information are used for references. Kappa is frequently used for accuracy assessments. The accuracy of a measurement can be determined using the well-known and trustworthy kappa coefficient35. It was 0.86 in 1991, 0.90 in 2001, 0.89 in 2021, and 0.92 with an overall accuracy of 89, 92, 86, and 90 percent, respectively.
Post Classification Change detection
Two symmetrical images must be compared and contrasted in order to find a change, and the reformed area must then be analyzed using image-handling techniques36. The causes of changes to the earth's surface might be either natural or man-made37. One of the most crucial tasks is detecting post-classification changes to determine their type, tempo, and intensity. However, variations in land cover within and between periods cannot be effectively accounted by a simple examination of change or the degree of change. Therefore, to monitor the size and direction of changes, change vector analysis is necessary. In this instance, the change transition matrix was created using ArcGIS 10.4. and Microsoft Excel is used to process and tabulate the data.
Fragmentation Analysis
It is necessary to effectively and accurately quantify the variability and connectedness of landscapes at biologically relevant scales in order to manage landscapes that promote human socioeconomic development and preserve ecosystems that support biodiversity38. Additionally, it ought to have taken into account both class-level and landscape-level indicators to fully comprehend how land-use change affects landscape fragmentation39. In order to analyse the spatial and ecological patterns of the study area, FRAGSTATS 4.2 is used40.
Table 3: Major Information regarding Matrices
Abbreviation | Metric | Description | Justification |
NP | Number of patches | Total number of patches in the Landscape | Fragmentation |
PD | Patch density (per 100 ha) | Number of patches per unit area | Fragmentation |
PLAND | Percentage of Landscape (%) | The proportion of the Landscape occupied by patch type. When the number of the associated patch type (class) in the environment goes down, it gets closer to 0. PLAND is equal to 100 if the whole Landscape is made up of only one type of patch. | Fragmentation |
LSI | Landscape shape index | Divided by the whole area and adjusted by a constant for a square standard, the landscape boundary and total edge within the Landscape | Aggregation |
LPI
| Largest patch index (%) | Each class's greatest patch's area corresponds to a percentage of the overall amount of land. | Dominance |
MPS | Mean patch size (ha) | Average patch size in each class, expressed in hectares | Fragmentation |
IJI
| Interspersion and juxtaposition index (%)
| Based on patch adjacencies, mixing of patches of various types. Increases to 100 as the patch type progressively intersperse with other patch types.
| Fragmentation |
CONTAG
| Contagion Index (%) | 0
| Fragmentation |
SHDI | Shannon's diversity index | SHDI equals minus the sum, a measure of diversity. When there is no diversity, it approaches 0, and it rises when more patch types are present. | Diversity |
Adapted from McGarigal et al. (2002)
A spatial pattern analysis application called FRAGSTATS is utilized to measure the structure of landscapes or to put it another way, the spatial heterogeneity of the Landscape41-43. However, essential uses of landscape metrics include identifying landscape patterns, biodiversity, and habitat fragmentation44-46. FRAGSTATS provides three different levels of matrices: patch, class, and Landscape41. However, we employed class-level metrics and landscape-level metrics for this investigation. Individual patches, which represent distinct areas with comparable features, are used to construct patch-level metrics. All patches of a specific type—LULC classes in this study—are used to calculate class-level metrics. Metrics at the landscape level combine all patches and class kinds in a specific area47. However, several types of matrices should be taken into consideration since no single indices can fully describe the intricate patterns of land-use change48. Based on our understanding about the study area, we chose metrics that can account for the impact of land use/cover change on landscape fragmentation39,42. Indices listed in Table 3 were used to carry out these analyses. Numerous studies on land-use change have used comparable matrices, including those by Sanchez et al. (2020)40, Singh et al. (2014)43, Dewan et al. (2010)39, Kamusoko et al. (2006)42. An overview of the landscape measurements used is given in the FRAGSTATS user's manual41.
Result and Discussion
The amount and rate of change between land cover classes from 1991 to 2021 at 10years interval are displayed in Table 4 and Fig.5. The water body (Fig.4) shrank from 1991 to 2001 by 63.64 km2 and from 2001 to 2011 by 23.74 km2, though it increases by 55.15 km2 in 2021. However, the figure is smaller than in 1991. Moreover, in 1991, 2001and 2011, the share of water bodies decreased by 5.17%, 3.99% and 3.54% respectively. Nevertheless, it raised by 4.57% in 2021.The area used for agriculture increased by 74.31 km2 in 2001 compared to 1991 but then fell by 165.47 km2 and 630.95 km2 from 2011 to 2021, respectively. The highest rate of change occurred from 2011 to 2021 and it is roughly 63.10 km2 per year (Table 5 and (Fig.4).
Table 4: Share of LULC Classes in 1991, 2001, 2011 and 2021
| Class Name | 1991 | 2001 | 2011 | 2021 | ||||
Area (km2) | % | Area (km2) | % | Area (km2) | % | Area (km2) | % | |
| Water Bodies | 277.53 | 5.17 | 213.89 | 3.99 | 190.14 | 3.54 | 245.29 | 4.57 |
| Agriculture | 4482.06 | 83.51 | 4556.37 | 84.89 | 4390.90 | 81.81 | 3759.95 | 70.05 |
| Sand Bar | 75.69 | 1.41 | 119.73 | 2.23 | 89.01 | 1.66 | 47.54 | 0.89 |
| Plantation and Forest | 394.20 | 7.34 | 243.05 | 4.53 | 416.22 | 7.75 | 863.02 | 16.08 |
| Built-up | 137.82 | 2.57 | 234.26 | 4.36 | 281.02 | 5.24 | 451.50 | 8.41 |
Source: Computed by authors
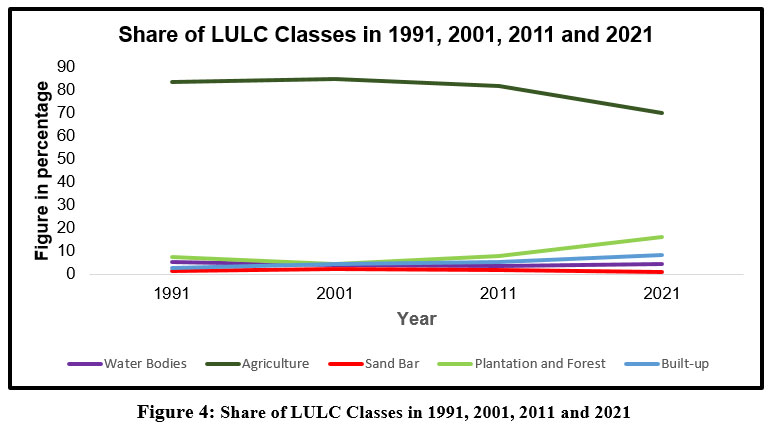 | Figure 4: Share of LULC Classes in 1991, 2001, 2011 and 2021.
|
However, share of agricultural land marginally increased by 84.89% in 2001 from 83.51% in 1991 though it has declined by 81.81% and 70.05% in 2011 and 2021, respectively.
Dramatic variations in the plantation and woodland cover classes were seen between 1991 and 2001(Fig.4). It was decreased by 151.15 km2, then grows by 173.17 km2 in 2011 and by 446.80 km2 in 2021, respectively. Compared to 7.34 % in 1991, the decrease in plantation and woodland cover is 16.08 % in 2021.
From 1991 to 2021, the built-up area grows continually (Fig.4). The rate of change was 9.64 km2 per year from 1991 to 2011, but it slowed down to 4.68 km2 per year over the following decades but increasing again by 17.05 km2 per year from 2011 to 2021. The maximum rate of change was recorded between the years of 2011 and 2021. In 1991, the share of the built-up area was 2.57 %; in 2001, it was 4.36 %; in 2011, it was 5.24 %; and in 2021, it will be 8.41 %.
The maximum amount of agricultural land is transformed into built-up area and plantation or forest land cover, according to the transition matrix from 1991 to 2011(Table 6). As a result, the area of agriculture has decreased from 83.76 % in 1991 to 82.08 % in 2011. Share of plantation or Forest land cover class did not vary considerably between 1991 and 2011, with a very small increase from 7.21% to 7.63%. On the other hand, the Built-Up area grew from 2.51% in 1991 to 5.14 % in 2011. Most of its area comes from agricultural land (2.4%) and 1.27% from plantations and forests. The land used by the water body decreased from 5.12% in 1991 to 3.51% in 2011, and the majority of it was turned into agricultural land (2.23%). Though only a small quantity of sand bar grows, this is primarily due to changes in the amount of water and sedimentation conditions at the time.
From Table 7, it was observed that between 1991 and 2021, agricultural land decreased from 83.76 to 70.30%. Whereas majority of that land are converted to Plantation or forest area (11.76%) and built-up area (4.82%). Although the rate of change is faster over time, that trend is relatively comparable to that of between 1991 and 2011. Significant shift of traditional agricultural practices along with various government programmes, such as Mahatma Gandhi National Rural Employment Guarantee Act of 2005 (MGNREGA) and the "Sabuj Shree" scheme, which was introduced in 2016–17, that contributed to the increment of plantation or forest land from 7.21% in 1991 to 15.96% currently. However, most of its area comes from agricultural land (11.76%). Built-up area growing significantly from 2.51% in 1991 to 8.33% in 2021 due to the high population growth and socio-economic progress. Such growth also induced by various government schemes such as "Pradhan Mantri Awas Yojana", "Nijashree", "MGNREGA", "Nija Griha Nija Bhumi", and others. In case of water body, initially, it was decreased from 5.17% in 1991 to 3.99% and 3.54% in 2001 and 2011 respectively. Though in 2021 it slightly increased from previous decades, however, the figure is very meager than 1991, it was 5.12% in 1991 and in 2021it was 4.52%. The "MGNREGA" scheme significantly boosts the amount of water body in the study area. Despite the sand bar changing, depending upon water level, amount of water and sediment conditions over time.
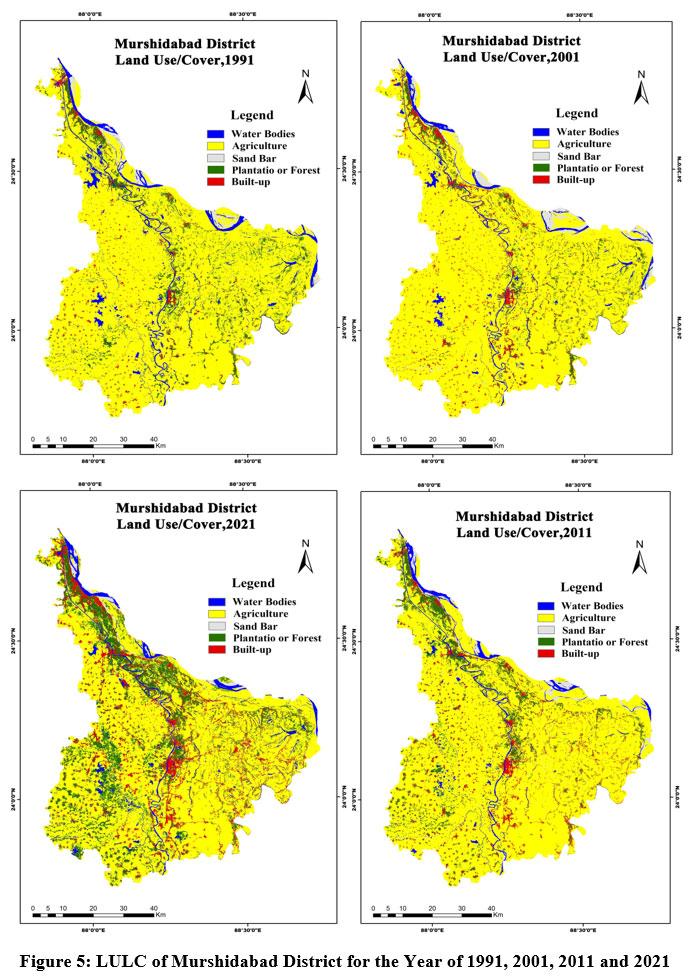 | Figure 5: LULC of Murshidabad District for the Year of 1991, 2001, 2011 and 2021
|
Table 5: Quantification and Magnitude of change for each LULC Class
Class Name | Magnitude | Rate of Change | ||||
1991-2001 | 2001-2011 | 2011-2021 | 1991-2001 | 2001-2011 | 2011-2021 | |
| Water Bodies | -63.64 | -23.74 | 55.15 | -6.36 | -2.37 | 5.51 |
| Agriculture | 74.31 | -165.47 | -630.95 | 7.43 | -16.55 | -63.10 |
| Sand Bar | 44.04 | -30.72 | -41.47 | 4.40 | -3.07 | -4.15 |
| Plantation and Forest | -151.15 | 173.17 | 446.80 | -15.11 | 17.32 | 44.68 |
| Built-up | 96.44 | 46.76 | 170.48 | 9.64 | 4.68 | 17.05 |
Source: Computed by authors
Table 6: Transition matrix of 1991 to 2011 (Figure in percentage).
1991 | LULC | 2011 | Total | ||||
Agriculture | Built-up | Plantation and Forest | Sand Bar | Water Bodies | |||
| Agriculture | 75.26 | 2.40 | 4.15 | 0.87 | 1.08 | 83.76 | |
| Built-up | 0.72 | 1.38 | 0.38 | 0.01 | 0.02 | 2.51 | |
| Plantation and Forest | 3.18 | 1.27 | 2.68 | 0.02 | 0.06 | 7.21 | |
| Sand Bar | 0.69 | 0.00 | 0.01 | 0.38 | 0.32 | 1.41 | |
| Water Bodies | 2.23 | 0.08 | 0.41 | 0.36 | 2.04 | 5.12 | |
| Total | 82.08 | 5.14 | 7.63 | 1.64 | 3.51 | 100.00 | |
Source: Computed by authors
Table 7: Transition matrix of 1991 to 2021 (Figure in percentage).
1991 | LULC | 2021 | |||||
Agriculture | Built-up | Plantation and Forest | Sand Bar | Water Bodies | Total | ||
| Agriculture | 65.09 | 4.82 | 11.76 | 0.32 | 1.76 | 83.76 | |
| Built-up | 0.40 | 1.53 | 0.54 | 0.00 | 0.04 | 2.51 | |
| Plantation and Forest | 2.22 | 1.84 | 2.97 | 0.01 | 0.17 | 7.21 | |
| Sand Bar | 0.71 | 0.02 | 0.11 | 0.27 | 0.30 | 1.41 | |
| Water Bodies | 1.88 | 0.13 | 0.59 | 0.28 | 2.24 | 5.12 | |
Total | 70.30 | 8.33 | 15.96 | 0.88 | 4.52 | 100.00 | |
Source: Computed by authors
Matrices Analysis
The study area's scenery changes at the class level as seen in Table 8. The increase in NP for agricultural land from 3570 in 1991 to 3780 in 2001 to 5199 in 2011 and 10173number in 2021, as well as the accompanying PD and PLAND reduction over time, indicates that geographic variability in the class grows with increased disturbance. Fragmentation occurs when the NP rises but the area under the class falls43. As anthropogenic disturbance grows, MPS declines, and LSI rises, indicating increased complexity. Patches that have a lower IJI are not well dispersed or are not equally next to one another. The land has become fragmented as a result of the haphazard conversion of agricultural land to woodland and built-up. However, the growth in NP, PD, MPS, PLAND, and LPI for built-up and plantation and forest land cover shows the dominance of these two classes. Increased population pressure and built-up area as a result of urbanization. According to the land-use change research, the area's natural land cover has been rapidly replaced by built-up areas. As a result of a shift in traditional agricultural practices to orchard-based farming and plantation, woodland and plantation cover is rapidly increasing. Increasing LSI and IJI, on the other hand, indicates that the shape becomes more complex and interspersed with adjacent patch types. Increasing IJI indicates that both land cover classes are intermixed with other patch types, implying that the development of both land cover classes is patchy and that these LSI are becoming more complex. The Landscape is becoming increasingly complicated as a result of increased human demand and anthropogenic disturbance.
Table 8: Class Level Matrices
Year | TYPE | PLAND | NP | PD | MPS | LPI | LSI | IJI |
1991 | Agriculture | 83.51 | 3570 | 0.67 | 125.55 | 38.57 | 65.54 | 77.29 |
2001 | Agriculture | 84.89 | 3780 | 0.70 | 120.54 | 40.97 | 60.83 | 86.71 |
2011 | Agriculture | 81.81 | 5199 | 0.97 | 84.46 | 37.72 | 74.27 | 79.50 |
2021 | Agriculture | 70.05 | 10173 | 1.90 | 36.96 | 32.39 | 110.92 | 68.50 |
1991 | Built-up | 2.57 | 8609 | 1.60 | 1.60 | 0.10 | 105.61 | 57.76 |
2001 | Built-up | 4.36 | 9774 | 1.82 | 2.40 | 0.16 | 120.12 | 47.43 |
2011 | Built-up | 5.24 | 14778 | 2.75 | 1.90 | 0.22 | 149.45 | 52.78 |
2021 | Built-up | 8.41 | 17190 | 3.20 | 2.63 | 0.40 | 158.35 | 59.40 |
1991 | Plantation and Forest | 7.34 | 16192 | 3.02 | 2.43 | 0.20 | 153.16 | 44.13 |
2001 | Plantation and Forest | 4.53 | 14237 | 2.65 | 1.71 | 0.06 | 138.98 | 43.69 |
2011 | Plantation and Forest | 7.75 | 18069 | 3.37 | 2.30 | 0.53 | 154.77 | 48.42 |
2021 | Plantation and Forest | 16.08 | 22584 | 4.21 | 3.82 | 0.94 | 183.34 | 53.84 |
1991 | Sand Bar | 1.41 | 377 | 0.07 | 20.08 | 0.20 | 22.67 | 38.02 |
2001 | Sand Bar | 2.23 | 907 | 0.17 | 13.20 | 0.43 | 29.16 | 24.33 |
2011 | Sand Bar | 1.66 | 1922 | 0.36 | 4.63 | 0.19 | 37.58 | 56.20 |
2021 | Sand Bar | 0.89 | 471 | 0.09 | 10.09 | 0.10 | 22.23 | 69.84 |
1991 | Water Bodies | 5.17 | 6250 | 1.16 | 4.44 | 1.46 | 70.16 | 53.55 |
2001 | Water Bodies | 3.99 | 3045 | 0.57 | 7.02 | 1.35 | 52.24 | 50.93 |
2011 | Water Bodies | 3.54 | 3984 | 0.74 | 4.77 | 1.85 | 56.62 | 71.78 |
2021 | Water Bodies | 4.57 | 7910 | 1.47 | 3.10 | 1.51 | 79.12 | 80.91 |
Source: Computed by authors
Note: Percentage of Landscape (PLAND), Number of atches (NP), Patch density (PD), Mean patch size (MPS), Largest Patch Index (LPI), Landscape shape index (LSI), Interspersion and juxtaposition index (IJI)
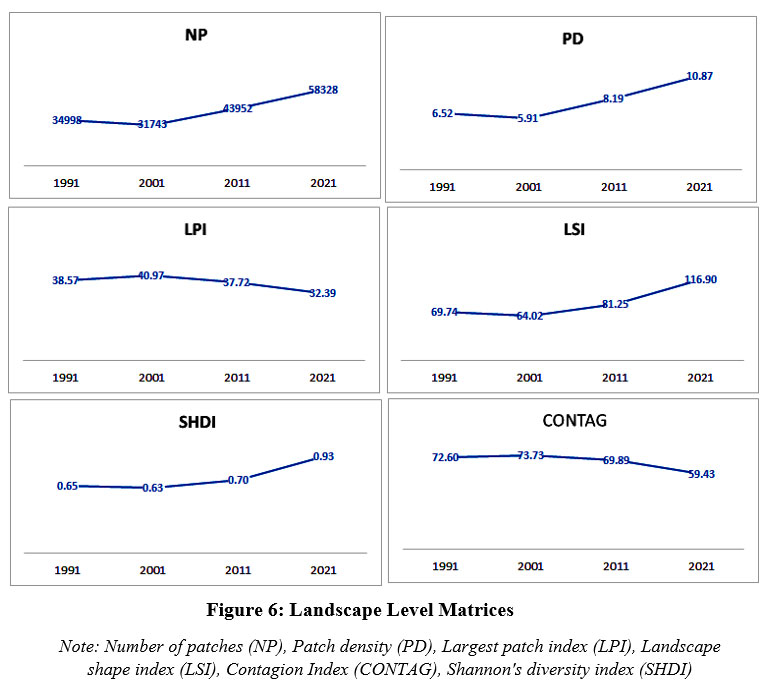
 | Figure 6: Landscape Level Matrices.
|
Note: Number of patches (NP), Patch density (PD), Largest patch index (LPI), Landscape shape index (LSI), Contagion Index (CONTAG), Shannon's diversity index (SHDI)
PLAND for aquatic bodies fell to 3.99% in 2001 from 5.17% in 1991, then fell again to 3.54% in 2011 before rising to 4.57% in 2021. In 2021, the LSI indicates that it became more complicated in shape, while the IJI suggests that it was well interleaved with adjacent patch types. Water body class changes are influenced by government programmes such as Mahatma Gandhi National Rural Employment Guarantee Act (2005) and conversion to built-up land use.
Sand bars are naturally deposited sand along riverine tracts, and their levels fluctuate based on the amount of water and sediment present at the time. However, we evaluate NP, PD, LPI, LSI, CONTAG and SHDI (Table 3) to explain the spatial pattern of landscape change using landscape level matrix (Fig. 6). NP declines from 34998 number in 1991 to 31743 number in 2001 but then rises from 43952 in 2011 to 58328 in 2021, indicating an increase in landscape fragmentation. PD has a similar tendency as NP: it fell from 6.52% in 1991 to 5.9% in 2001, then rose to 8.19% in 2011 and 10.87% in 2021. However, LPI rises to 40.97% in 2001 from 38.57% in 1991, then drops to 37.32% in 2011 and 32.39% in 2021, indicating that growing NP and PD, together with decreasing LPI, suggest greater fragmentation across the Landscape. The LSI value increased to 67.74 in 1991, 81.25 in 2011, and 116.90 in 2021; however, it only decreased to 64.02 in 2001. As a result, a rapidly increasing LSI implies that the shape is becoming more complicated over time due to anthropogenic disturbance. Since 2001, the CONTAG value has steadily fallen, suggesting discontinuous and heterogonous geographic distribution. Growing SHID also indicates increasing landscape diversity.
Conclusions
With the help of geospatial tools and multiple landscape matrices, the dynamics of land cover change in Murshidabad district are discussed along with its nature, speed, and extent in this work. The rapid socio-economic development and the high population growth rate over the research period contributed to the built-up area's expansion. As a result, over time, a fruitful agricultural area was transformed into an impenetrable surface. On the other hand, traditional agriculture practices are being replaced by cultivating in semi-permanent orchards. Additionally, orchard-based farming is less prone to variations in traditional agricultural inputs. As a consequence, between 1991 and 2021, the proportion of agricultural land declined from 83.76% to 70.30%, while the built-up area increased from 2.51%to 8.33%.
Fragmentation of the Landscape by incorporating landscape indices into the classified image is also considered. The findings show that anthropogenic disturbance has further fragmented agricultural land. On the other hand, as a built-up area grows, its nature becomes more complex. The Landscape Matrix showed that LSI was rising over time as a result of anthropogenic disturbance, indicating that the Landscape was growing more complex. Conversely, the CONTAG value has continuously decreased, pointing to a discontinuous and uneven distribution of LULC across the area. The investigation depicted that over time, the land became more fragmented. Land-use change maps can be used as an early warning system to accomplish sustainable land use planning, protecting natural ecosystems and biodiversity from anthropogenic activity.
As the proportion of agricultural land declines, it is crucial to protect the remaining fertile agricultural land from further conversion into built-up areas. The expansion of built-up areas needs to be managed effectively to avoid unplanned urbanization. Implement urban planning strategies that encourage compact, well-connected cities with green spaces, and infrastructure that optimizes land use. Involving local communities in land-use planning and decision-making can lead to more sustainable outcomes. Raising awareness about the importance of preserving natural resources and the consequences of rapid urbanization can garner public support for conservation efforts. Enforcing regulations and policies that control land use changes and prevent unauthorized land conversion is crucial. This may involve zoning laws, environmental impact assessments, and strict enforcement of land use regulations. By implementing these suggestions, the Murshidabad district may work towards maintaining a balance between human development and the preservation of the natural environment, leading to a more sustainable future.
Conflict of Interest
There is no conflict of interest.
Funding Sources
There is no funding sources.
References
- Moradi F, Kaboli HS, Lashkarara B. Projection of future land use/cover change in the Izeh-Pyon Plain of Iran using CA-Markov model. Arabian Journal of Geosciences. 2020;13:1-17.
CrossRef - Prakasam C. Land use and land cover change detection through remote sensing approach: A case study of Kodaikanal taluk, Tamil nadu. International journal of Geomatics and Geosciences. 2010;1(2):150.
- Arveti N, Etikala B, Dash P. Land use/land cover analysis based on various comprehensive geospatial data sets: a case study from Tirupati area, south India. Advances in Remote Sensing. 2016;5(02):73.
CrossRef - Kangabam RD, Selvaraj M, Govindaraju M. Assessment of land use land cover changes in Loktak Lake in Indo-Burma Biodiversity Hotspot using geospatial techniques. The Egyptian Journal of Remote Sensing and Space Science. 2019;22(2):137-143.
CrossRef - Selçuk R, Nisanci R, Uzun B, Yalcin A, Inan H, Yomralioglu T. Monitoring land-use changes by GIS and remote sensing techniques: case study of Trabzon. 2003:1-11.
- Al-sharif AA, Pradhan B. Monitoring and predicting land use change in Tripoli Metropolitan City using an integrated Markov chain and cellular automata models in GIS. Arabian journal of geosciences. 2014;7:4291-4301.
CrossRef - Lal T. Population Pressure and Changes in Land Use Pattern: A Study of Akhnoor Tehsil. Unpublished Ph D Thesis, University of Jammu, Jammu. 2011;
- Chanu CS, Elango L, Shankar GR. A geospatial approach for assessing the relation between changing land use/land cover and environmental parameters including land surface temperature of Chennai metropolitan city, India. Arabian Journal of Geosciences. 2021;14:1-16.
CrossRef - Weslati O, Bouaziz S, Serbaji MM. Mapping and monitoring land use and land cover changes in Mellegue watershed using remote sensing and GIS. Arabian Journal of Geosciences. 2020;13:1-19.
CrossRef - Hosea H, Pravitasari AE, Setiawan Y, Rustiadi E. Landscape metric in the analysis of urban form in Cekungan Bandung urban region. SPIE; 2019:75-86.
CrossRef - Keita MA, Ruan R, An R. Spatiotemporal change of urban sprawl patterns in Bamako District in Mali based on time series analysis. Urban Science. 2020;5(1):4.
CrossRef - Dasgupta A, Kumar U, Ramachandra T. Urban Landscape analysis through spatial metrics. 2009:18-20.
- Prasad G, Ramesh MV. Spatio-temporal analysis of land use/land cover changes in an ecologically fragile area—Alappuzha District, Southern Kerala, India. Natural Resources Research. 2019;28:31-42.
CrossRef - Liping C, Yujun S, Saeed S. Monitoring and predicting land use and land cover changes using remote sensing and GIS techniques—A case study of a hilly area, Jiangle, China. PloS one. 2018;13(7):e0200493.
CrossRef - Badreldin N, Goossens R. Monitoring land use/land cover change using multi-temporal Landsat satellite images in an arid environment: a case study of El-Arish, Egypt. Arabian Journal of Geosciences. 2014;7:1671-1681.
CrossRef - Mishra PK, Rai A, Rai SC. Land use and land cover change detection using geospatial techniques in the Sikkim Himalaya, India. The Egyptian Journal of Remote Sensing and Space Science. 2020;23(2):133-143.
CrossRef - Cihlar J. Land cover mapping of large areas from satellites: status and research priorities. International journal of remote sensing. 2000;21(6-7):1093-1114.
CrossRef - Biswal V. Integration of GIS and Remote Sensing for Urban Land Use Study in District Nainital.
- Patel LK, Tripathi S. A Geospatial Approach to Analyze the Impact of Population Growth on Bundelkhand Landscape, Central India. International Journal. 2016;5(6):1755-1767.
CrossRef - Kachhwala T. Temporal monitoring of forest land for change detection and forest cover mapping through satellite remote sensing. 1985:77-83.
- Duan Y, Wang X, Wei Y. Land use change analysis of Daishan Island using multi-temporal remote sensing imagery. Arabian Journal of Geosciences. 2020;13(15):741.
CrossRef - Rawat JS, Biswas V, Kumar M. Changes in land use/cover using geospatial techniques: A case study of Ramnagar town area, district Nainital, Uttarakhand, India. The Egyptian Journal of Remote Sensing and Space Science. 2013;16(1):111-117.
CrossRef - Mhawish YM, Saba M. Impact of population growth on land use changes in Wadi Ziqlab of Jordan between 1952 and 2008. International Journal of Applied Sociology. 2016;6(1):7-14.
- Chauhan H, Nayak S. Land use/land cover changes near Hazira Region, Gujarat using remote sensing satellite data. Journal of the Indian society of Remote Sensing. 2005;33:413-420.
CrossRef - General R. Census Commissioner, India. Census of India. 2011;2000
- Pant M. A Study on flood hazards and disaster mitigation in the Murshidabad district of West Bengal.
- Bandyopadhyay BK, Sengupta, S., Biswas, P. D., . District Gazetteers, Murshidbad, Govt. of West Bengal. Govt. of West Bengal; 2003.
- Alam N, Saha S, Gupta S, Chakraborty S. Prediction modelling of riverine landscape dynamics in the context of sustainable management of floodplain: a Geospatial approach. Annals of GIS. 2021;27(3):299-314.
CrossRef - Saber A, El-Sayed I, Rabah M, Selim M. Evaluating change detection techniques using remote sensing data: Case study New Administrative Capital Egypt. The Egyptian Journal of Remote Sensing and Space Science. 2021;24(3):635-648.
CrossRef - Roy B, Kasemi N. Monitoring urban growth dynamics using remote sensing and GIS techniques of Raiganj Urban Agglomeration, India. The Egyptian Journal of Remote Sensing and Space Science. 2021;24(2):221-230.
CrossRef - Chowdhury M, Hasan ME, Abdullah-Al-Mamun M. Land use/land cover change assessment of Halda watershed using remote sensing and GIS. The Egyptian Journal of Remote Sensing and Space Science. 2020;23(1):63-75.
CrossRef - Cai L, Wang M. Effect of the thematic resolution of land use data on urban expansion simulations using the CA-Markov model. Arabian Journal of Geosciences. 2020;13:1-10.
CrossRef - Mishra VN, Rai PK. A remote sensing aided multi-layer perceptron-Markov chain analysis for land use and land cover change prediction in Patna district (Bihar), India. Arabian Journal of Geosciences. 2016;9:1-18.
CrossRef - Aldhshan SR, Shafri HZM. Change detection on land use/land cover and land surface temperature using spatiotemporal data of Landsat: a case study of Gaza Strip. Arabian Journal of Geosciences. 2019;12:1-14.
CrossRef - Bose A, Chowdhury IR. Monitoring and modeling of spatio-temporal urban expansion and land-use/land-cover change using markov chain model: a case study in Siliguri Metropolitan area, West Bengal, India. Modeling Earth Systems and Environment. 2020;6:2235-2249.
CrossRef - Kelarestaghi A, Jafarian Jeloudar Z. Land use/cover change and driving force analyses in parts of northern Iran using RS and GIS techniques. Arabian Journal of Geosciences. 2011;4(3):401-411.
CrossRef - El-Hattab MM. Applying post classification change detection technique to monitor an Egyptian coastal zone (Abu Qir Bay). The Egyptian Journal of Remote Sensing and Space Science. 2016;19(1):23-36.
CrossRef - Borthwick R, de Flamingh A, Hesselbarth MH, Parandhaman A, Wagner HH, Abdel Moniem HE. Alternative quantifications of landscape complementation to model gene flow in banded longhorn beetles [Typocerus v. velutinus (Olivier)]. Frontiers in Genetics. 2020:307.
CrossRef - Dewan AM, Yamaguchi Y, Ziaur Rahman M. Dynamics of land use/cover changes and the analysis of landscape fragmentation in Dhaka Metropolitan, Bangladesh. GeoJournal. 2012;77:315-330.
CrossRef - Sánchez Sánchez Y, Martínez Graña A, Santos-Francés F, Reyes Ramos JL, Criado M. Multitemporal analysis of land use changes and their effect on the landscape of the jerte valley (Spain) by remote sensing. Agronomy. 2021;11(8):1470.
CrossRef - McGarigal K, Cushman S, Neel M, Ene E. FRAGSTATS: spatial pattern analysis program for categorical maps. University of Massachusetts, Amherst. 2002.
- Kamusoko C, Aniya M. Land use/cover change and landscape fragmentation analysis in the Bindura District, Zimbabwe. Land degradation & development. 2007;18(2):221-233.
CrossRef - Singh SK, Pandey AC, Singh D. Land use fragmentation analysis using remote sensing and Fragstats. Remote sensing applications in environmental research. 2014:151-176.
CrossRef - Gardner RH, O’Neill RV, Turner MG. Ecological implications of landscape fragmentation. Springer; 1993.
CrossRef - Keitt TH, Urban DL, Milne BT. Detecting critical scales in fragmented landscapes. Conservation ecology. 1997;1(1)
CrossRef - Herold M, Scepan J, Clarke KC. The use of remote sensing and landscape metrics to describe structures and changes in urban land uses. Environment and planning A. 2002;34(8):1443-1458.
CrossRef - Sertel E, Topalo?lu RH, ?all? B, Yay Algan I, Aksu GA. Comparison of landscape metrics for three different level land cover/land use maps. ISPRS International Journal of Geo-Information. 2018;7(10):408.
CrossRef - Seto KC, Fragkias M. Quantifying spatiotemporal patterns of urban land-use change in four cities of China with time series landscape metrics. Landscape ecology. 2005;20:871-888.
CrossRef


