Performance Evaluation of Photovoltaic Thermal Collector (PVT) by Cooling Using Nano Fluid in the Climate Condiation of India
Mrigendra Singh1
*
 , S.C Solanki1
, Basant Agrawal2
and Rajesh Bhargava3
, S.C Solanki1
, Basant Agrawal2
and Rajesh Bhargava3
1
Department of Mechanical Engineering,
Ujjain Engineering college,
Ujjain,
Madhya Pradesh
India
2
Department of Mechanical Engineering,
SGSITS,
Indore,
Madhya Pradesh
India
3
Dy. Registrar Academics,
RGPV,
Bhopal,
Madhya Pradesh
India
http://dx.doi.org/10.12944/CWE.18.2.21
Copy the following to cite this article:
Singh M, Solanki S. C, Agrawal B, Bhargava R. Performance Evaluation of Photovoltaic Thermal Collector (PVT) by Cooling Using Nano Fluid in the Climate Condiation of India. Curr World Environ 2023;18(2). DOI:http://dx.doi.org/10.12944/CWE.18.2.21
Copy the following to cite this URL:
Singh M, Solanki S. C, Agrawal B, Bhargava R. Performance Evaluation of Photovoltaic Thermal Collector (PVT) by Cooling Using Nano Fluid in the Climate Condiation of India. Curr World Environ 2023;18(2).
Download article (pdf)
Citation Manager
Publish History

Introduction
Nowadays, energy is an essential part of many businesses. For almost all industries, fossil fuels have been the primary energy source, but because of their depletion and environmental hazards, developing countries have developed other strategies for supplying energy. One innovative renewable energy source that is receiving attention is solar energy, which can generate both electrical and thermal energy. Solar energy given that solar energy reserves are limitless. Its use is flexible and pollution-free; it should soon overtake other energy sources as the primary source for human activity.1
Photovoltaic (PV) technology is acknowledged as a critical strategy for achieving sustainable development and lowering carbon emissions. Increasing electrical efficiency and reducing manufacturing costs are crucial for technological innovation to promote the development of PV technology. Reducing surplus energy from the photovoltaic module is essential to enhance the performance because the converting effectiveness of the PV panel declines with the growing working temperatures.2
Solar PV modules' electrical efficiency decreases as the surface temperature rises over time. PV modules' heat degradation must be reduced to raise system efficiency3,4. Can be done by inserting the heat absorber sheet with tubes composed of high rate of heat transfer material and flowing liquid like air, liquid, and nano composit liquid on the back side of the solar module. A photovoltaic heat collector generates heat and electrical current from sun irradiation by fusing a heat collector and a solar panel.5,6 By removing extra heat from the solar module and increasing pefromance of the photovoltaic module and surplus heat is used to water heating and space heating.7
The PVT system's purpose is to improve the transformation of solar radiation into electric energy. Several design factors, including the mass transfer rate, the number of glass covers, the absorbing tube's design, diameter and thickness, and the heat medium's thermal conductivity, affect how well the PVT system performs. Different researchers have documented a significant amount of work on PVT systems based on air, water and nanofluid cooling on PVT system. Primary work is focused on air and water cooling system.
Wolf (1976) A mathematical examination of the effectiveness of a composite photovoltaic heat collector connected to a heat preserves tank has been conducted. Using the weather in Boston, his assessment is applied to a solitary house. The outcomes demonstrated that combining a heat collector with a solar module is a workable strategy. In the following work, several studies were undertaken to examine a composite photovoltaic-thermal collector's heat and electrical effectiveness.8
Sarhaddi et al. (2010) looked into the efficiency of PV/T air collectors. The heat and electrical effectiveness reportedly increased to 17.18% and 10.01%, respectively.9
Arslan et al.(2020). Did a numerical and experimental evaluation of a PVT system air is used at mass transfer rates of 0.045 kg/sec and 0.031 kg/sec. The findings revealed that the transfer rate of 0.045 kg/sec had an average current and heat effectiveness of 13.98% and 49.5%, respectively.10
Huang et al. (2001). It has contrasted the effectiveness of a typical solar water heater system to that of a PVT collector that uses water as heat removal fluid. The PVT system's total effectiveness was 38%, 76% more effective than a solar water heater.11 Yazdanpanahi et al.(2015). Investigated both experimental and numerical research were done on the PVT water collector. With a relative error of 3.96%, it has been stated that the numerical results match the experiment's measurement. The PVT water collector's most incredible exergy efficiency was reported to be 13.95%.12
Aste et al. (2015). To assess the electrical and thermal characteristics, a new mathematical model was used to construct a flat plate PV/T collector and experimentally suggest a novel glazed PV/T module. It was discovered the inventive PV/T module outperforms a basic module in the numerical analysis of a three-dimensional PV/T module with and without a cooling system.13 now a days nanofluid cooling is more efficient as compare to water and air cooling system. Various research carried out using nanofluid in PVT collector. Using nanofluid to improve heat transfer properties will increase collector effectiveness while lowering PV cell temperature. Solutions from dispersing solid particles of a nanometric size in a primary fluid are known as nanofluids14. The viscosity, heat transfer rate, and density of the liquid, commonly referred to as the liquid's thermodynamic characteristics, interact with the cooling nanofluids in the PVT collector and, compared to the base fluid, are higher in nanofluids.15,16
Choi (1995). Indicate the solid nanoparticles suspension in the base liquid. It was discovered that adding Al2O3 to water boosted its effective thermal conductivity by 20% for volume fractions of 1 to 5%.17
Yousefi et al. (2012) Investigated the impact on the effectiveness of the PVT collector by adding nanopartical of Al2O3 (0.002 and 0.004 by weight of 15nm size) to pure water and using the resulting retention as a cooling liquid in place of pure water. According to the study, suspension 0.002 of nano alumina by mass improve the system efficiency when employing nanofluids by 28.3% compared to water as a cooling liquid. 18
Sardarabadi et al. (2014) They have reported an experimental study on a silica/water nanofluid-cooled plate-and-channel PVT system. The result indicates that energy and exergy efficiency can be enhanced when nanoparticle mass concentration varies from 1% to 3%. In a plate and channel PV/T system, they employed different nanofluids. Conclusion: TiO2/water and ZnO/water nanofluids outperformed Al2O3/water concerning electrical energy output, and ZnO/water beat Al2O3/water concerning thermal efficiency.19
Ghadiri et al. (2015). Purified water and a ferro liquid (Fe3O4-water) at concentrations of 1% and 3% each were used to assess the performance of a PVT collector. They discovered utilizing a 3% ferro liquid increased the PVT system's overall effectiveness by 45%. The total performance was enhanced to almost 50% when a cooling fluid with a 50 Hz alternating magnetic field was utilized.20
Shenoy A et al. (2016) The curved channel have recently been used in various energy transfer applications to enchance the amount of heat exchanged and improve effectiveness. A more significant and reliable heat transfer can be achieved in the curved channel system by expanding the energy transfer area and having a evenly dispersed of the tubes.21 Sardarabadi et al. (2016) Diffrent metal-oxide nanoparticles (Al2O3, TiO2, and ZnO) distributed in distilled water with a 0.2 weight percent concentration were compared experimentally and numerically. The findings demonstrated that ZnO had the maximum heat effectiveness, while TiO2 and ZnO nanofluids had maximum electrical effectiveness.22 Jin et al.(2017) Fe3O4 nanoparticles in different concentrations were mixed with an ethylene glycol/water (1:1,v/v) combination includes methylene blue or copper sulphate. They discovered that the spectrum absorption of the beam splitters was comparable to that of flawless effects for Si and InGaP PV cells.23
Fayaz et al. (2018) They have examine the response of the PVT collector to the closed-loop mass transfer speed of the MWCNT nanosolution. The mass transfer rates of the nanosolution ranged from 0.0084 to 0.0336 kg/sec. Electrical and heat performance rose by 0.6% and 5.13%, respectively, with a maximum mass transfer speed of 120 kg/h.24
Al-Waeli et al. (2019) Discover the optimal cooling fluid, researchers experimentally compared the viscosity, density, and thermo-physical characteristics of three different kinds of nanofluids. All of the investigated nanofluids had higher densities and viscosities than pure water. According to their findings, ethylene glycol-water mixtures exhibit a more significant density increase than the others when compared to water; nevertheless, propylene glycol-water mixtures exhibit greater viscosity growth than the other types of examined nanofluids. For PVT applications, new varieties of COSO4-based Ag nanofluid have been tested as spectrum beam splitters.25
S. Mishaa et al. (2019). Determine the exit water and exterior temperature of photovoltaic heat collector using mathematical calculation, where radiation exposure of 0.6, 0.8, and 0.10 kWh with the mass transfer speed at 0.024, 0.048, and 0.060 kg/sec and water temperature inlet 26 oC. Perform CFD Simulation and Experimental Analysis of photovoltaic heat collector using water as acoolent through Natural Malaysian Climate. For this inquiry, the experiment was performed outside in the Malaysian climate at various transfer rates between 0.024–0.084 kg/sec. The experimental results were used to validate the CFD results.26
Yuting et al. (2020) It investigated the numerical evaluation of a photovoltaic heat collector using two different nanofluids as a heat removal agent. They discovered that the Al2O3/water nanofluid PVT collectors perform better than the TiO2/water nanofluid PVT collectors. The electrical effectiveness of the PVT system is considerably more noticeable when the mass transfer rate of the nanofluid is 0.03 kg/sec.27
Mohamed et al. (2020) Perform a numerical analysis of the effects of dispersing copper (Cu) and alumina (Al2O3) nanoparticles in pure water on the effectiveness of a covered photovoltaic-thermal collector (PVT) enhanced using nanofluids. According to the results, utilizing Cu-water nanofluid can improve system effectiveness more effectively than Al2O3/water. Additionally, the findings show that utilizing a 2% volume concentration of copper nanoparticles enhances Cu water nanofluid's heat and electrical effectiveness by 4.1% and 1.9%, respectively, over pure water.28
Madalina et al. (2021) Parametric analysis is used to evaluate the effects of different factors on electrical, heat, and total effectiveness. The findings indicated that, in most cases, there was a trade-off between electrical and heat effectiveness. In terms of wind speed and insulation, low wind and high insulation provide thermal advantages that outweigh the reduction in electrical efficiency. It was discovered that when the packing factor is maximized, the electrical gains outweigh the heat loss. The heat exchanger's channels' width should also be increased to the full extent of available technology for maximum performance.29
Jidesh et al. (2021) A semi transparent photovoltaic-thermal composit collector utilizing CuO nanofluid was experimentally validated. It was discovered indicates the typical decrease in solar panel temperatures of semitransparent photovoltaic heat collector using water and CuO nanosolution was 9 and 12 oC, accordingly. SPV-THC's electrical effectiveness increased by 11.2% and 5.9% when employing CuO nanofluid and water compared to traditional opaque photovoltaic modules.30 . In the current scenario, different researchers use ANN to validate and forecast the performance parameters of PVT collectors.
Adriano Pamain et al. (2022) Find out the various non-linear autoregressive artificial neural network algorithms employed in photovoltaic power output prediction. The results of the experiment and forecasts show good agreement. The estimated energy from both modules using the Bayesian regularisation algorithm demonstrates good processing capabilities compared to the other three algorithms, which are apparent from the measured performance indices, and all the techniques outperformed each other.31
Enas Taha Sayed et al. (2022) They look at the use of AI to boost the heat and performance of nanofluid-based PV heat/nano-increses phase change materials. The recommended method combines PSO (particle warm optimization) with ANFIS modeling. The following four operating variables are taken into account: heat transfer liquid mass transfer rate, phase change material layer thickness, mass fraction of nanoparticles in phase change material, and mass fraction of nanoparticles in nanofluid. An adaptive neuro-fuzzy inference system model has been created using a dataset to simulate heat energy and exergy outputs about the aforementioned working parameters. The optimal PCM thickness, mass transfer rate, MFNPCM, and MFN fluid values are then estimated using PSO.32 Orhan Büyükalaca et al. 2023. Carry out numerical analysis and ANN modeling of the effectiveness of hexagonal BN-water nanofluid PVT collectors, and analyze the PVT collector's effective parameters using various input parameters. The findings showed that while the electrical effectiveness constantly rises as the volume concentration ratio rises, the heat effect grows up to 0.18 volume concentration before declining. Additionally, utilizing the hBN/water nanofluid, two separate sets of ANN models were created to forecast five effectiveness metrics of the PVT collector.33
According to a thorough literature analysis, nanofluids can enhance the effectiveness of photovoltaic-thermal systems. The heat and electrical effectiveness of a plate and tube-based PVT solar collector using Cu/water nanofluid at a volume fraction of 2% and 3% as a coolant to remove heat from the absorber sheet is investigated on summer, winter, and monsoon season using a mathematical model.
Methodology
Collector Design and Overview
Fig.1 shows the design of the plate and tube-type photovoltaic heat collector it was thought of for this work. The composite system is covered in glass. An air gap separates it from the PV panel glass. The hybrid solar system's numerous parts include the photovoltaic panel, an absorber sheet attached below the PV panel through an adhesive covering, and finally, an attached fluid flowing channel on the back surface of the absorber sheet. The heat-removing liquid moving through the channel transfers the heat the absorbing plate holds. The heat used to heat the solar cells is converted into usable energy. The bottom and corners of the hybrid collector are covered with insulating material.46,47
The effectiveness of a PVT collector based on nanofluids is examined in summer, winter, and monsoon condition. Likewise, the results of diffusing nanoparticles at various volume fractions in pure water. Geometrical characteristics of the fluid-flowing tube and the effect of nanofluid mass transfer rate on module temperature. The intensity of sun radiation, atmospheric temperature, air velocity, and relative humidity are considered for various seasons in the Indian city of Ujjain for this study.
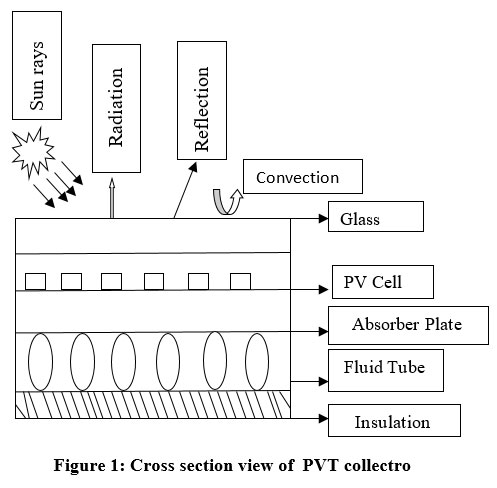 | Figure 1a:. Cross section view of PVT collectro
|
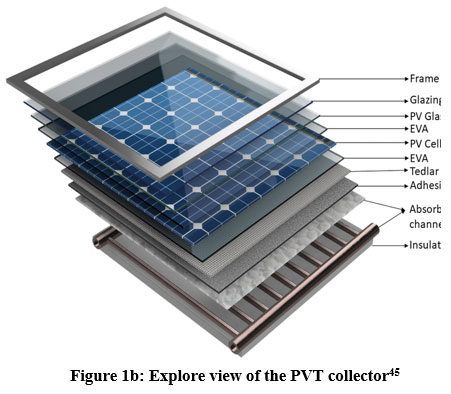 | Figure 1b: Explore view of the PVT collector45
|
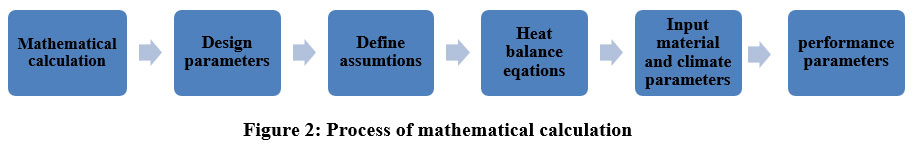
The amount of solar energy and the atmospheric air temperature rise initially, peaking around noon, then gradually declining during the day. Average wind speeds are considered for mathematical calculations throughout the year. The impact of dust buildup and relative humidity is disregarded. It is consider that solar panels are installed perpendicular to the path of solar radiation and that the PVT collector's slope angle is 30 degrees. Developed Excel VBA program to build a mathematical model and solve the energy balance equation and obtain performance parameters for various seasons. Table 3 includes the design specifications for this nanofluid-based PVT collector. Process of calculation show in Fig.2.
 | Figure 2: Process of mathematical calculation
|
Heat balance equation for PVT System
A portion of the solar radiation that strikes the PVT collector and enters the PV module is transformed into electricity by the solar cell. The working fluid cools the sticky layer and absorber plate, which also transfers extra heat from the photovoltaic module. An energy balance that describes the movement of heat between various system components is applied at each layer to simulate the photovoltaic thermal collector. For mathematical modeling, the ensuing presumption is taken into account.34
1. The energy distribution of various components of the PVT collector is assumed to be one-dimensional.
2. Thermo physical characteristics like thermal conductivity, dynamic viscosity, and specific heat of coolant are temperature independent.
3. Each PVT component should have a consistent temperature, and the edges of the PVT collector should be perfectly insulated; energy transfer between the system to surrounding is negligible.
4. No dust accumulation and partial shading on the PV panel are considered.
5. The optical properties like reflection, Transmittance, and absorption of the material remain constant along the area.
6. Ohmic losses of the photovoltaic cells are negligible.
Heat balance equation for glass cover
In this concept, solar energy strikes the glass cover, where it is first absorbed in part by the environment and in part by the photovoltaic cell via heat transfer. The equation for the heat balance is
.png)
Heat balance equation for PV module
[Rate of heat absorbed by solar cell + Rate of heat absorbed by nonpacking area] = [Total energy loss from the upper surface of the PV panel to atmosphere] + [Total energy transfer between panel to absorber plate] + [Rate of power genration]

Using equation (2), find the solar cell temperature
.jpg)
Heat balance equation for absorber plate
[Rate of heat transferred to absorber sheet] = [Rate of heat transfer to the fluid through absorber sheet]

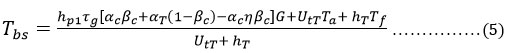
Using equation no. (3) & (4) find the expression of the rear surface temperature of the PV panel
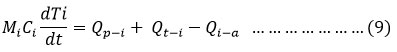
Heat balance equation for flowing liquid
[Rate of energy transferred to the liquid through absorber sheet ] = [(Rate of thermal energy carried by the flowing liquid) + (Rate of energy loss from fluid to surrounding through insulation)]
.jpg)
Rearrange the equation (6) and get the linear differential equation
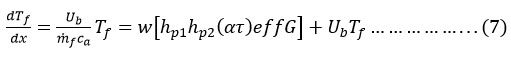
Solve equation no. (7) Using initial boundary condition x=0, Tf = Tfi & x=L, Tf = Tfo
.jpg)
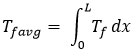
Find the average fluid temperature of the PVT system
Heat balance equation for insulation layer
Performance evaluation of the PVT collector:
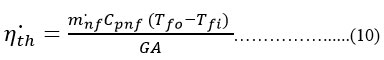
Heat efficiency
Heat energy

Temperature Dependent Electrical efficiency

Electrical Power & Pressure Drop30
.jpg)
Where ?P is a pressure drop, and ?pIs the standard pump efficiency
.jpg)
Where K1 and K2 are the pipe flow loss coefficient between entry and exit of the pipe and f is the friction factor.
The overall efficiency of PVT collector

Thermo physical properties of nanofluid
Density
The density of nanofluids may find by.

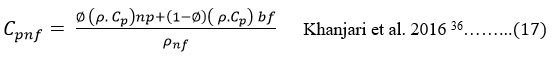
Heat capacity
The specific heat capacity of nanofluids may find by
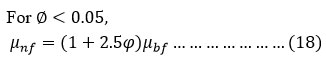
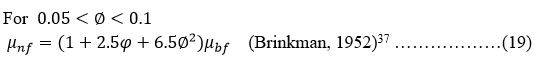
Viscosity
dynamic viscosity of nanofluid
Thermal conductivity
Heat conduction of the nanofluid is

Convective heat transfer coefficient between tube and flowing fluid
Li and Xuan, 2002). suggested a numerical model to describe the Nusselt number of a nanofluid.39
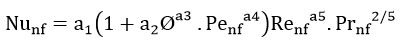
Where a1, a2, a3, a4, and a5 are constant coe?cients, and Ø refers to the volume fraction of nanofluid. (Yazdanifard et al., 2017).The P_e, P_r, and R_e denote the Peclet number, Prandtl number, and Reynolds number of nano?uid, they are characterised by Eqs. 40,48 (21)–(24).

Table 1: Details of photovoltaic panel
Specification | Solar module | Pmax | Voc | Isc | Vmax | Imax | ?s | Working temperature range | Size (mm) | Weight | Cell type | Cell packing factor |
Value | 200W | 200W | 30 V | 8.56 A | 24.6 V | 8.13 A | 15.3% | - 40°C to 85°C | 1320 x 992 x 35 | 14.5 kg | Polycrystalline | 0.8 |
Table 2: Thermophysical property of coolant
Property | Volume Fraction (%) | Density (kg/m3) | Heat capacity (J/kgK) | Rate of heat transfer (W/mK) |
Water | - | 998.2 | 4182 | 0.6 |
Cu/water nano | 2% | 1155.81 | 3605.16 | 0.91 |
Cu/water nano | 3% | 1235 | 3356.04 | 0.967 |
Result and anlysis
This study evaluates the performance of PVT collectors in the Indian city of Ujjain over the summer, winter, and monsoon seasons when utilizing copper/water as a coolant in volume fractions of 2% and 3%.
Atmospheric parameters
The hourly variations of sun irradiation, atmospheric temperatures, atmospheric air velocity, and atmospheric relative humidity are used in the mathematical calculation and are displayed in Fig.3(a), Fig. 3(b), Fig.3(c), and Fig.3(d) for summer, winter, and monsoon. It is observed that the maximum sun radiation available at noon in summer, winter, and monsoon is 983 w/m2, 800 w/m2, and 600 w/m2 as shown in Fig.3(a). The variation of ambient temperature is indicates in Fig.3.(b) ambient temperature gradually risees from morning to afternoon and slightly reduces to evening. The maximum temperature achieved at noon in different seasons is 40 oC, 30 oC and 25oC. The surrounding temperature greatly influences convective, radiative, and conductive heat losses. Additionally, the production of solar cells in terms of electricity is greatly influenced by the ambient temperature.30
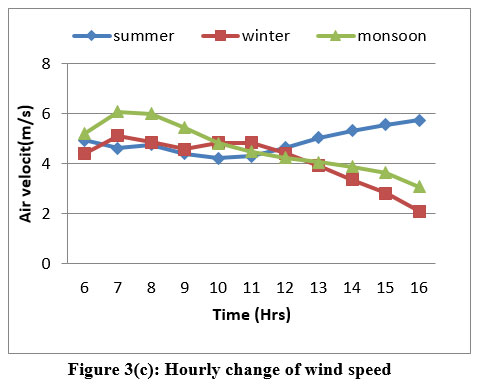
The average air velocity depicted in Fig.3(c) Wind speed fluctuates from 5 to 6 m/sec in the summer, from 2 to 4 m/sec in the winter, and from 3 to 5 m/sec in the monsoon. The atmospheric air velocity has affected convection related heat loss.30 Fig.3(d) Displays the atmospheric relative humidity. The atmospheric relative humidity in the summer ranges from 45 to 15%. Morning to evening sees a modest decline. The atmospheric relative humidity in the months of winter and monsoon ranges from 70 to 80% and 90 to 80%, respectively, with a little increase from morning to evening gradually grows from dawn to night. The effectiveness of the PVT collector is only a little influenced by the atmospheric relative humidity. But long time, it impacted the PV panel's lifespan.41
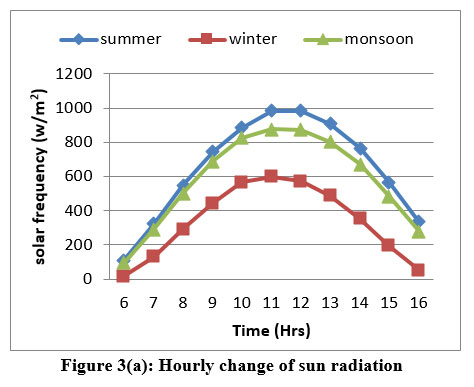 | Figure 3(a): Hourly change of sun radiation.
|
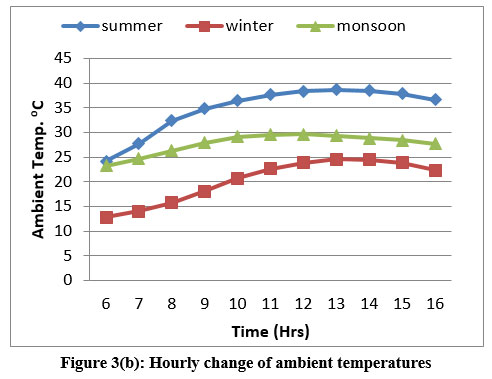 | Figure 3(b): Hourly change of ambient temperatures.
|
 | Figure 3©: Hourly change of wind speed.
|
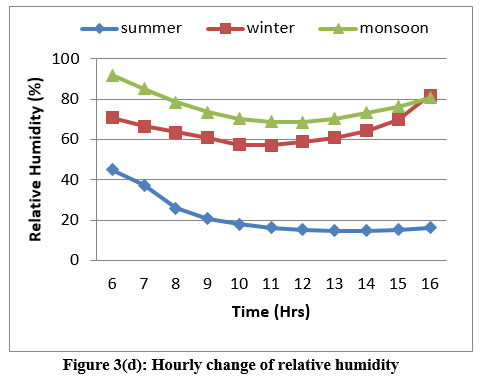 | Figure 3(d): Hourly change of relative humidity .
|
Table 3: Criteriea for design for the photovoltaic thermal collector
| Components | Parameters | Value | Unit |
| Glass Cover | Thickness | 0.006 | m |
| Transmissivity | 0.95 |
| |
| Absorptivity | 0.04 |
| |
Rate of heat transfer | 0.8 | w/mk | |
| PV panel | Absorptivity | 0.9 |
|
| Rate of heat transfer | 100 | w/mk | |
| Stendared efficiency | 15.3% |
| |
| Thermodynamic coefficient | 0.0045 | 1/K | |
| Absorber | Thickness | 5×10^-4 | m |
| Rate of heat transfer | 380 | w/mk | |
| Channel | Outer radius of tube (d1,d2) | 0.0075, 0.0062 | m |
| Thickness | 0.0003 | m | |
| Total Length | 2.5 | m | |
| Tube spaceing | 0.1 | m | |
| Total number of tubes | 10 |
| |
| Insulation layer | Thickness | 0.07 | m |
| Rate of heat transfer | 0.03 | w/mk | |
| Coolent liquid | Intinal temperature of fluid | 28 | oC |
| Environment condition | Velocity of air | 1.2 | m/sec |
| Ambient temperature |
|
| |
sun radiation intensity |
|
| |
| Collector slope angle | 300 |
|
PVT collector outlet temperature of fluid
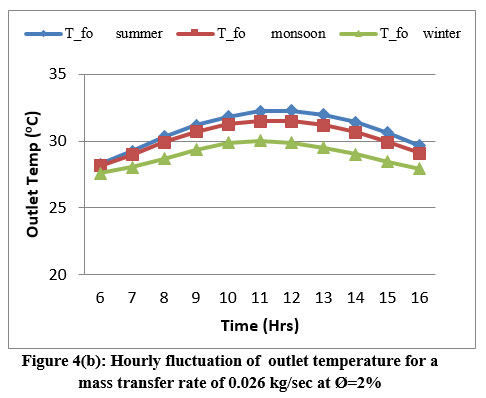
The outlet temperature of nanofluid is calculated in different seasons at 2% cu/water volume fraction and the diameter of the tube is 0.015 m with mass transfer rates variations from 0.016 to 0.036 kg/sec. Fig.4.(a), Fig.4.(b), Fig.4.(c) display the hourly fluctuation of outlet temperature.
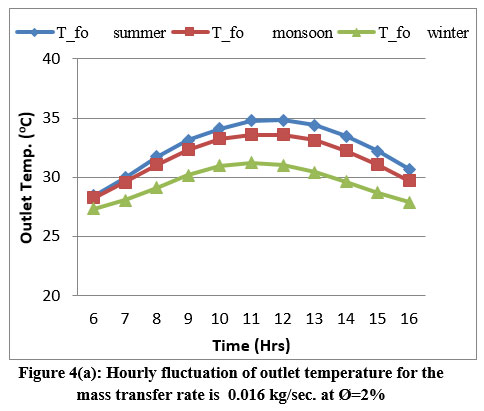 | Figure 4(a): Hourly fluctuation of outlet temperature for the mass transfer rate is 0.016 kg/sec. at Ø=2%.
|
 | Figure 4(b): Hourly fluctuation of outlet temperature for a mass transfer rate of 0.026 kg/sec at Ø=2%
|
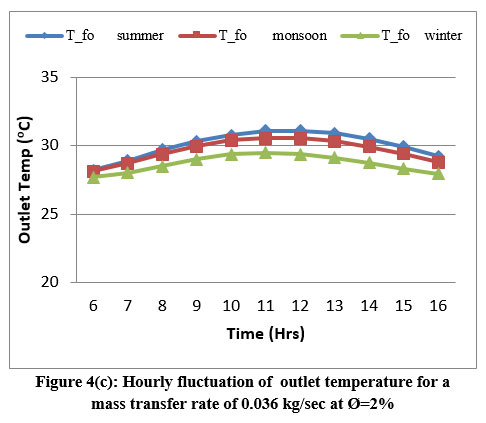 | Figure 4(c): Hourly fluctuation of outlet temperature for a mass transfer rate of 0.036 kg/sec at Ø=2% .
|
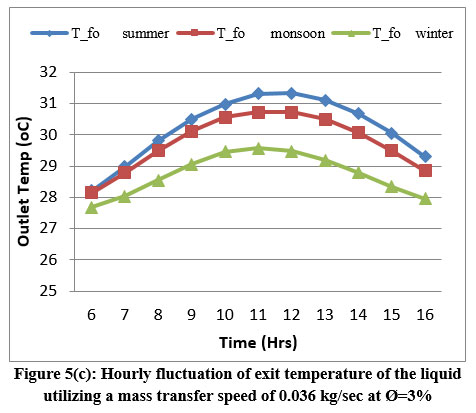
The outlet temperature gradually increases morning from 6 h to noon and slightly decreases in the evening at 16 h. The maximum outlet temperature is achieved at noon in different seasons. It is noticed that increase in mass transfer speed between 0.016 to 0.036 kg/sec the outlet temperature is slightly reduced.42 Maximum outlet temperature achieved in summer is 35 oC at a mass transfer speed is 0.016 kg/sec. and minimum value achieved in winter seasons is 25 oC at a mass transfer rate of 0.036 kg/sec. an another hand considering cu/water volume fraction is 3%, the thermo physical property of the nanofluid is changed.14 Table.2 show the thermophysical property of nanofluid. Fig.5.(a), Fig.5.(b), and Fig.5.(c) indicates the hourly fluctuation of outlet temperature at a volume fraction of 3%, and the diameter of the tube remains same with same mass transfer rate variation. The outlet temperature of fluid slightly rises with the rising volume fraction in different seasons, respectively. The maximum outlet temperature is achieved in summer at 36 oC at a mass transfer speed of 0.016 kg/sec. And the minimum value achieved in winter seasons is 26 oC at a mass transfer speed 0.036 kg/sec.
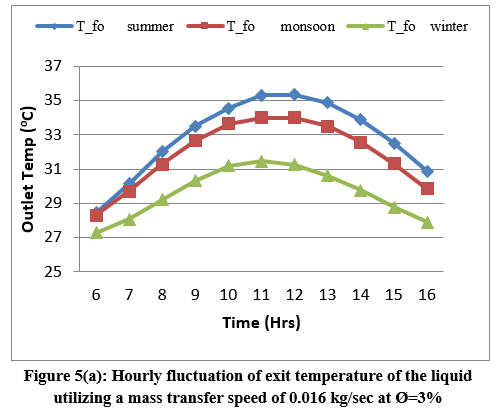 | Figure 5(a): Hourly fluctuation of exit temperature of the liquid utilizing a mass transfer speed of 0.016 kg/sec at Ø=3%.
|
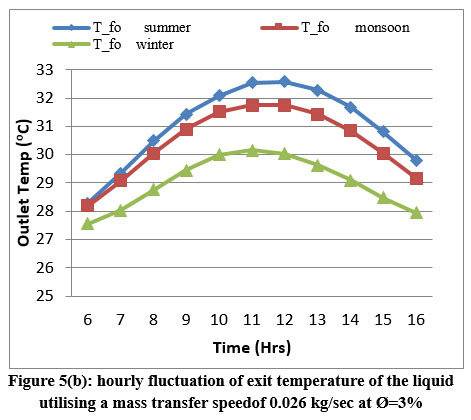 | Figure 5(b): hourly fluctuation of exit temperature of the liquid utilising a mass transfer speedof 0.026 kg/sec at Ø=3%.
|
 | Figure 5(c): Hourly fluctuation of exit temperature of the liquid utilising a mass transfer speed of 0.036 kg/sec at Ø=3%.
|
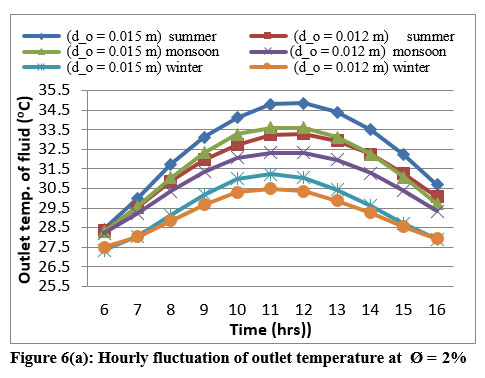
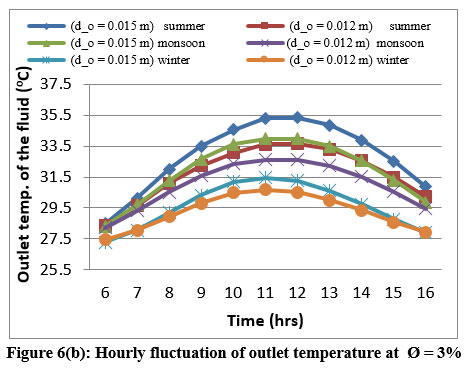
Fig.6(a) and Fig.6(b) Indicates hourly fluction of outlet temperature of nanofluid with the variation of tube diameter at 15 and 12 mm. with volume fraction is 2% and 3% and constant mass transfer rate is 0.016 kg/sec.
 | Figure 6(a): Hourly fluctuation of outlet temperature at Ø = 2%.
|
 | Figure 6(b): Hourly fluctuation of outlet temperature at Ø = 3% .
|
It is noticed the exit temperature of the fluid is directly connected to diameter tube. Tube diameter increases, and the outlet temperature also rises.27 Maximum outlet temperature achieved in summer seasons is 35 oC at a tube diameter of 15 mm and a volume fraction of 3%. The minimum outlet temperature achieved in winter is 30 oC at a tube diameter of 12 mm with a volume fraction is 2%.
Fig.7. shown the flactuation of outlet temperature with mass transfer rate for monsoon season. At constant solar radiation 876 w/m2 and tube diameter 0.015 m and different volume fractions 2%, 3%, and 4%. This suggests that the increase in mass transfer permits a high evacuation quantity of heat from the PVT system. Thereby the working cell temperature is reduced.27 As opposed to that, increase in volume fraction, the exit temperature is also increasing.
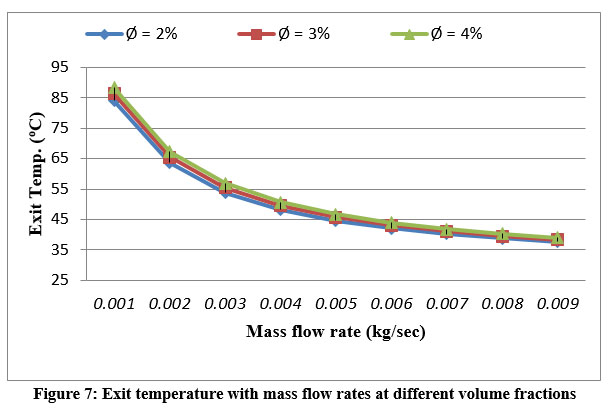 | Figure 7: Exit temperature with mass flow rates at different volume fractions
|
Heat effectiveness of PVT collector
Direct gain is the term used to describe the heat effecitveness of the PVT collector, which is produced by sun energy passed on the absorber covering with a collector's unpacking zone. Additionally, the solar cell's energy is transported to the absorber sheet, which is taken by the cooling liquid running through the channel. Heat effectiveness is evaluated on 2% and 3% of the volume portion on a constant channel diameter is 15 mm in different seasons. The hourly changes of heat effectivenes at volume fraction at 2% with mass transfer speed of 0.016 and 0.026 kg/sec is depicted in Figs. 8(a) and 8(b). From morning six hours to noon, thermal efficiency slightly rises, and from afternoon until 16 hours in the evening, it slightly falls. thermal efficiency is reached at 33%, 30%, and 26%. Mass transfer rate directly influences thermal efficiency. Increasing the mass transfer rate results in a modest gain in thermal efficiency. Present result is compare to prvious litrature 36,28
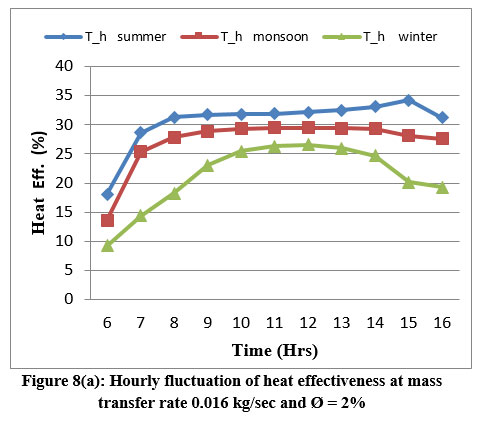 | Figure 8(a): Hourly fluctuation of heat effectiveness at mass transfer rate 0.016 kg/sec and Ø = 2%
|
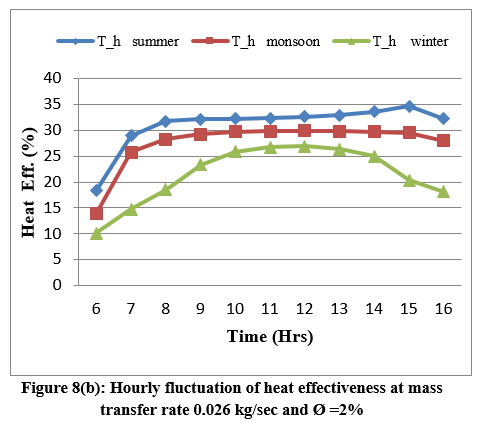 | Figure 8(b): Hourly fluctuation of heat effectiveness at mass transfer rate 0.026 kg/sec and Ø =2%.
|
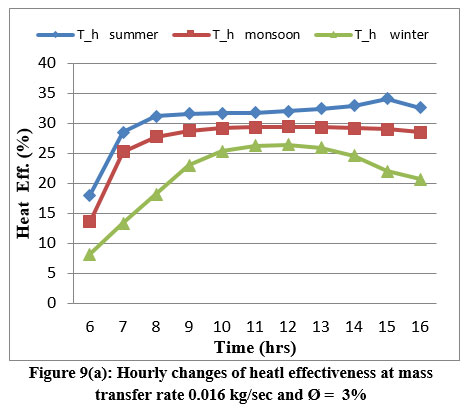
On the other hand, the volume fraction is thought to be 3%. Decreses heat capacity is observed in nanofluid. It has an impact on the coefficient of heat transfer. The hourly fluctuation in heat effectiveness for the same tube diameter and mass flow rate is shown in Fig.9(a) and Fig.9(b). A modest reduction in heat effectiveness occurs as volume concentration rises.27
 | Figure 9(a): Hourly changes of heatl effectiveness at mass transfer rate 0.016 kg/sec and Ø = 3%.
|
.jpg) | Figure 9(b): Hourly changes of heat effectiveness at mass transfer rate 0.026 kg/sec and Ø = 3% .
|
Fig.10(a) and Fig.10(b) illustrate the hourly fluctuation in heat performance of nanofluid-based PVT collectors in volume fractions of 2% and 3% at a fixed mass transfer speed of 0.016 kg/sec with varied diameters of fluid-flowing channel at 12 mm and 15 mm in various seasons. Increasing the channel diameter improves heat effectiveness. At a volume concentration of 3%, the summertime maximum thermal efficiency is 35%.
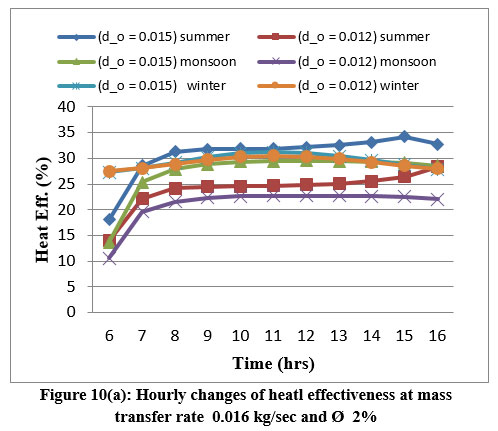 | Figure 10(a): Hourly changes of heatl effectiveness at mass transfer rate 0.016 kg/sec and Ø 2%.
|
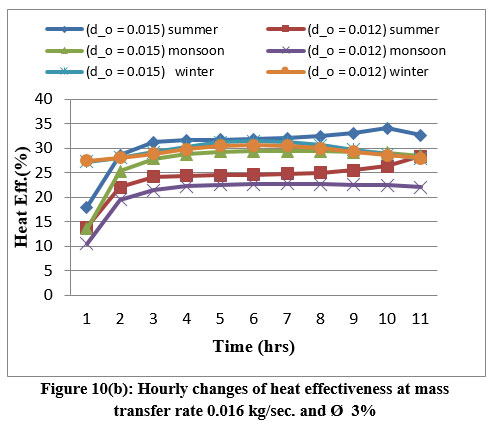 | Figure 10(b): Hourly changes of heat effectiveness at mass transfer rate 0.016 kg/sec. and Ø 3%.
|
Fig.11 Indicates the fluctuation in heat performance with a mass transfer rate of a copper/water nanofluid at various volume fractions of 2%, 3%, and 4% during the summer season. At constant solar radiation and tube diameter of 900 kw/h and 15 mm, it has been found that heat effectiveness enhances as the mass transfer rate varies from 0.001 to 0.009 kg/sec On the other hand, it decreases when the volume fraction rises. Maximum thermal efficiency is attained at a mass transfer speed of 0.009 kg/sec in a 2% cu/water nanofluid volume fraction.
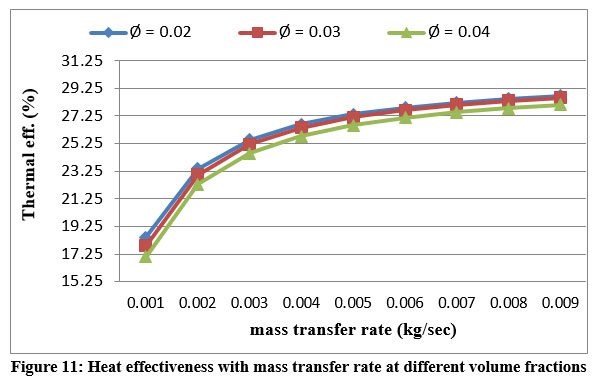 | Figure 11: Heat effectiveness with mass transfer rate at different volume fractions.
|
Heat gain of PVT collector
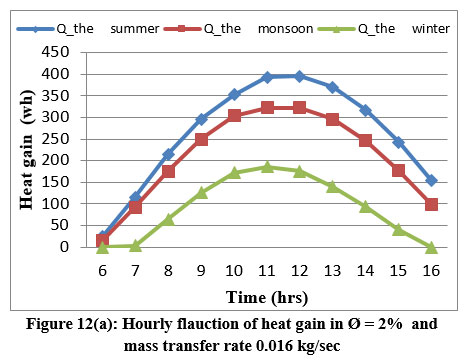
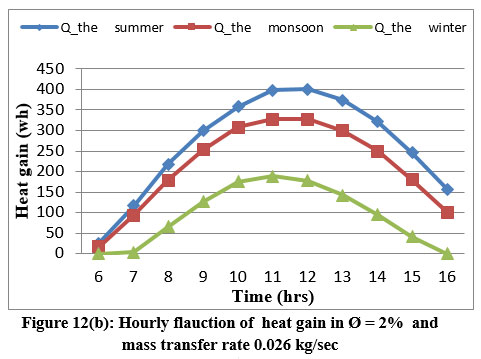
Different seasons are used to calculate beneficial heat gain. The hourly fluctuation of heat gain for a volume percentage of 2%, a constant tube diameter of 15 mm, and various mass transfer rates of 0.016 and 0.026 kg/sec are indicated in Fig. 12(a) and Fig.12(b). From morning until noon, heat gain increases somewhat, and from noon to evening, it decreases slightly. Summer time is when heat gain is at its highest, and wintertime is when it is at its lowest.
 | Figure 12(a): Hourly flauction of heat gain in Ø = 2% and mass transfer rate 0.016 kg/sec.
|
 | Figure 12(b): Hourly flauction of heat gain in Ø = 2% and mass transfer rate 0.026 kg/sec.
|
Fig.13 indicates the hourly flacutation of heat gain of a cu/water nanofluid at a volume fraction of 3% at the same tube diameter and mass transfer rate of 0.016 kg/sec. The heat gain is somewhat decreased when the volume fraction is increased.
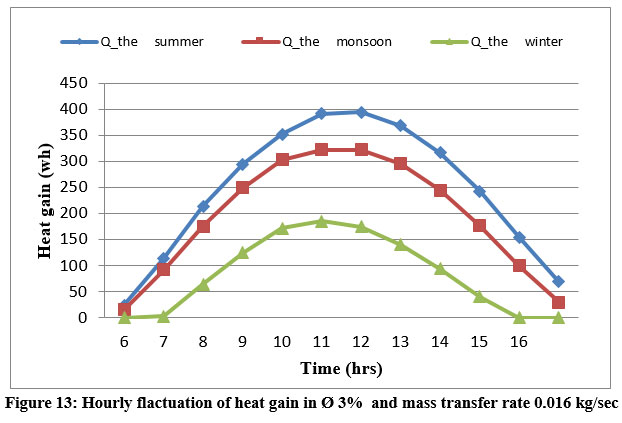 | Figure 13: Hourly flactuation of heat gain in Ø 3% and mass transfer rate 0.016 kg/sec.
|
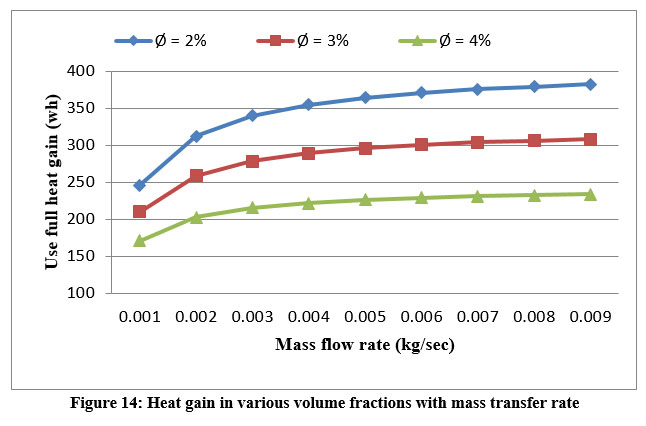
Fig.14 Indicates the fluctuation of heat gain against mass transfer rate from 0.001 to 0.009 at constant solar radiation 900 kw/h in the month of summer in different volume fractions 2%, 3%, and 4%; it is noticed that heat gain rises with rising the mass transfer28 and reducing with volume fraction. Maximum heat gain is achieved at 357 w/h in 2% of volume fraction and 0.009 kg/sec of mass transfer rate. And minimum value 155 w/h in 4% volume fraction at 0.001 kg/sec.
 | Figure 14: Heat gain in various volume fractions with mass transfer rate.
|
Back Surface temperature:
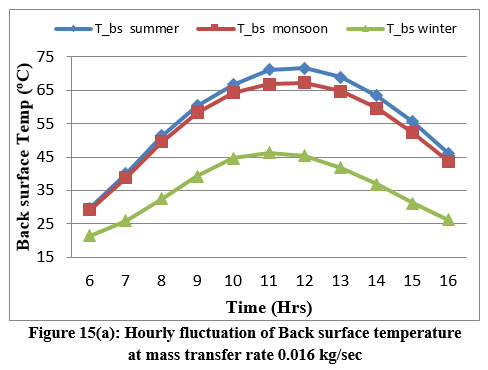
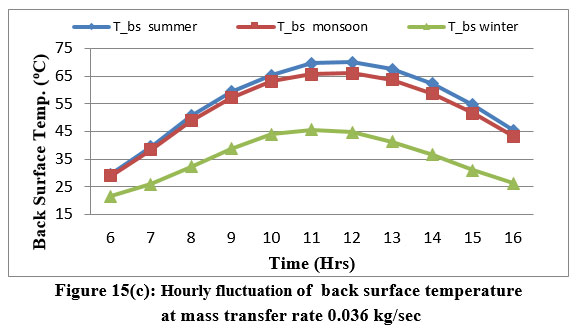
Back surface temperature is calculated in summer, winter, and monsoon seasons in different volume fractions of 2% and 3% at a tube diameter is 15 mm and variation of mass transfer rate between 0.016 kg/sec to 0.036 kg/sec. Fig. 15(a), Fig. 15(b), and Fig. 15(c) show the hourly fluctuation of the back surface temperature of cu/water nanofluid PVT collector in volume fraction 2%, at a diameter of tube 15 mm, and varies mass transfer rates between 0.016 to 0.036 kg/sec. Back surface temperature increases between morning to noon and slightly decreases between noon to evening. Back surface temperature affects the heat and electrical effectiveness of the PVT system. The corresponding maximum temperature is 71 oC, 66 oC, and 31 oC in summer, winter, and monsoon. With a mass transfer speed of 0.016 kg/sec. Back surface temperature is affected by the mass transfer rate. Rises the mass flow and reduces the back surface temperature. Minimum back surface temperature is achieved at 0.036 kg/sec. present calculated result is compare to36 khanjari et al. 2017.
 | Figure 15(a): Hourly fluctuation of Back surface temperature at mass transfer rate 0.016 kg/sec.
|
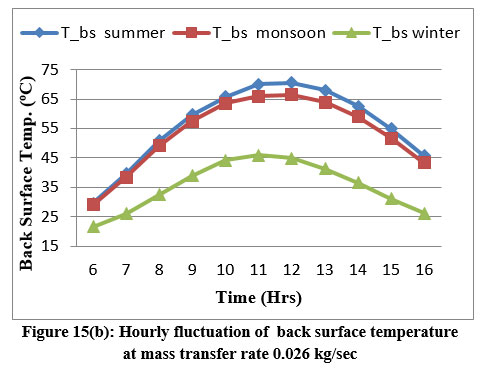 | Figure 15(b): Hourly fluctuation of back surface temperature at mass transfer rate 0.026 kg/sec.
|
 | Figure 15(c): Hourly fluctuation of back surface temperature at mass transfer rate 0.036 kg/sec.
|
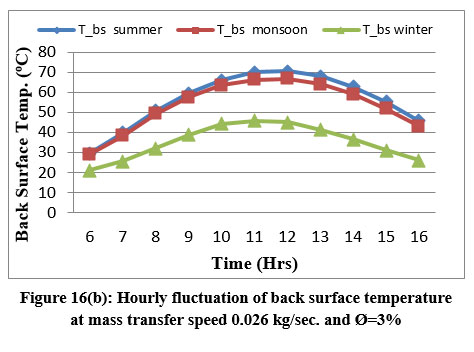
Fig.16(a), Fig.16(b), and Fig.16(c) show hourly variation of back surface temperature When the volume fraction is considered 3% and tube diameter is the same, and the mass transfer rate varies between 0.016 to 0.036 kg/sec. in different seasons. It has been noted that the back surface temperature is slightly reduces with rising the volume fraction due to the coolant's high heat capacity. This result compare to yuting jia et al. 202027
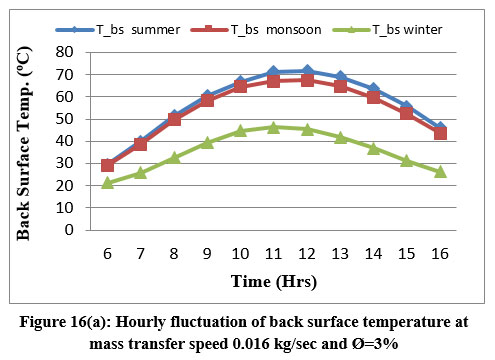 | Figure 16(a): Hourly fluctuation of back surface temperature at mass transfer speed 0.016 kg/sec and Ø=3%.
|
 | Figure 16(b): Hourly fluctuation of back surface temperature at mass transfer speed 0.026 kg/sec. and Ø=3%.
|
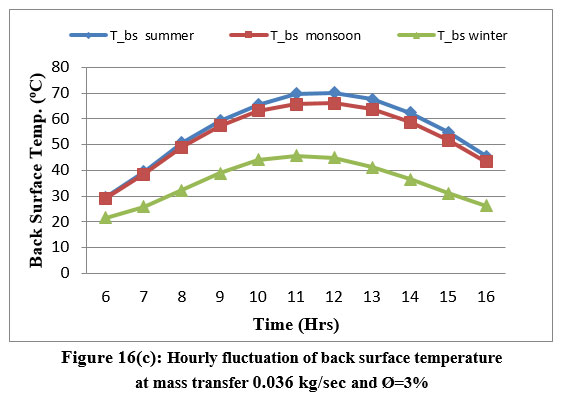 | Figure 16(c): Hourly fluctuation of back surface temperature at mass transfer 0.036 kg/sec and Ø=3%.
|
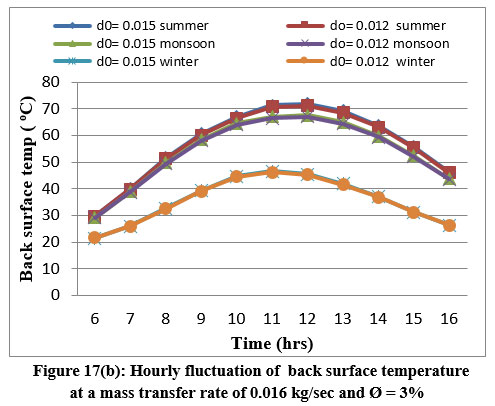
Fig.17(a) Show the hourly fluctuation of back surface temperature at a volume fraction of 2% and constant mass transfer rate of 0.016 kg/sec in different tube diameter 12 and 15 mm in summer, winter, and monsoon. The diameter of the tube is inversely connected to the energy extraction of fluid and its ability to improve heat extraction from the back side sheet and enhance better PV cooling effect. Fig.17(a) shows the temperature reduction with decreasing the tube diameter.27
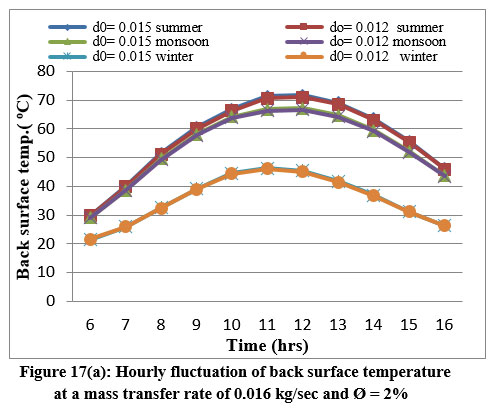 | Figure 17(a): Hourly fluctuation of back surface temperature at a mass transfer rate of 0.016 kg/sec and Ø = 2%.
|
 | Figure 17(b): Hourly fluctuation of back surface temperature at a mass transfer rate of 0.016 kg/sec and Ø = 3%
|
Fig.18 Indicates the fluctuation of back surface temperature against mass transfer rate at a volume fraction of 2% and a tube diameter of 15 mm in different seasons. An enhance the mass flow rate allows for a reduction in the rear side temperature.28 Maximum rear side temperature is achieved in the summer season and minimum in winter.
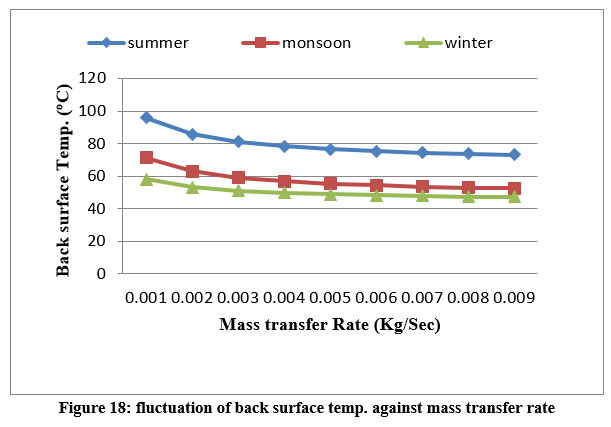 | Figure 18: fluctuation of back surface temp. against mass transfer rate.
|
Electrical Efficiency
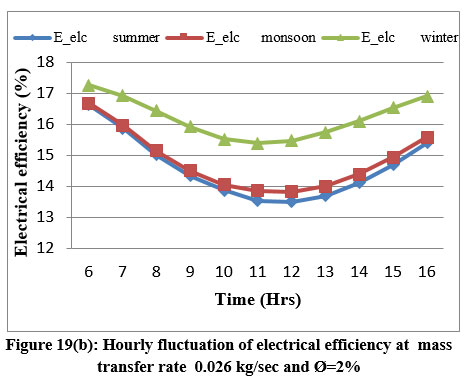
Electrical efficiency is calculated for PVT collector in different seasons. Fig.19(a) and Fig.19(b) show the fluctuation of temperature dependent electrical efficiency at a volume fraction of 2% and the tube diameter is 15 mm with a variety of mass transfer 0.016 and 0.026 kg/sec. electrical efficiency slightly decreases from morning to afternoon then increases to evening. electrical efficiency is directly connected with mass transfer rate enhance the mass transfer rate electrical performance is slightly increased. Maximum electrical efficiency is achieved in the winter season at a mass transfer speed of 0.026 kg/sec. and minimum electrical effectiveness is achieved in summer. This calculated result is compare to previous literature28 Mohamed et al. 2020.
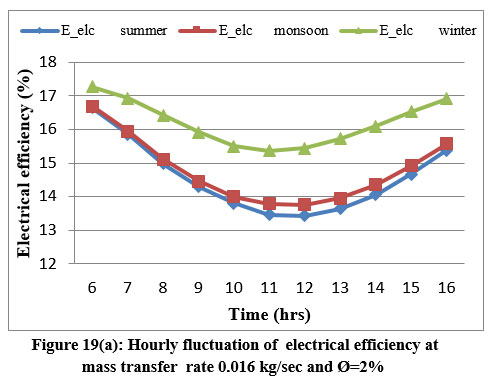 | Figure 19(a): Hourly fluctuation of electrical efficiency at mass transfer rate 0.016 kg/sec and Ø=2%.
|
 | Figure 19(b): Hourly fluctuation of electrical efficiency at mass transfer rate 0.026 kg/sec and Ø=2%.
|
Fig.20 Indicates the hourly fluctuation of electrical perfromance of the photovoltaic system in different seasons for a volume fraction of 2% at a mass transfer speed is 0.016 kg/sec with varying diameters of tube 15 mm and 12 mm tube diameter. Electrical performance is related to the diameter of the tube. Electrical performance slightly increases with decreasing the tube diameter.
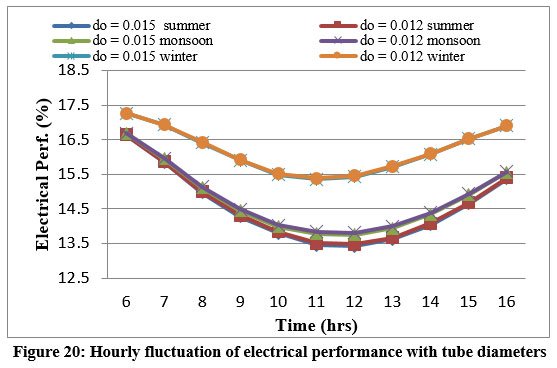 | Figure 20: Hourly fluctuation of electrical performance with tube diameters
|
Fig.21. The variation of electrical efficiency against mass transfer rate in different volume fractions 2%, 3%, and 4% with mass transfer rates varying from 0.01 to 0.09 kg/sec. At constant solar radiation 900 w/h in the month of summer. It is noticed that enhance the mass transfer speed improves the heat extraction of the photovoltaic panel is increase the electrical effectiveness of the system. Electrical effectiveness is enhanced with the rising volume fraction of nanofluid. Maximum effectiveness achieved at volume fraction is 4%.
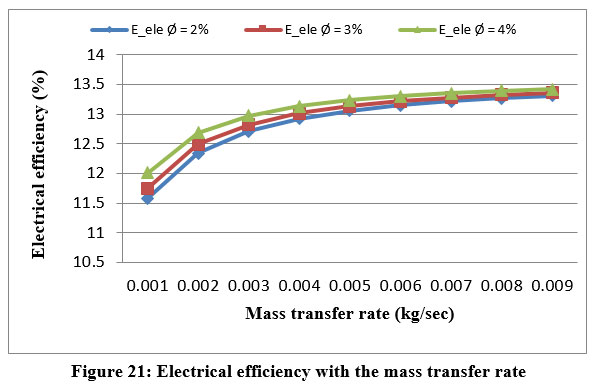 | Figure 21: Electrical efficiency with the mass transfer rate.
|
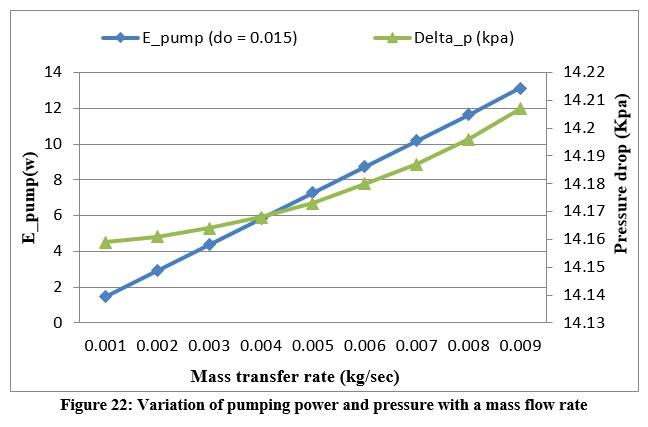
Pumping power
Fig. 21 shows the variation of pumping power and pressure drop against mass transfer rate at a volume fraction of 2% and tube diameter is 15 mm. It is observed that an enhance the mass flow also increase in pressure drop and pumping power of the PVT system.27 is based on the numerical equation
 | Figure 22: Variation of pumping power and pressure with a mass flow rate
|
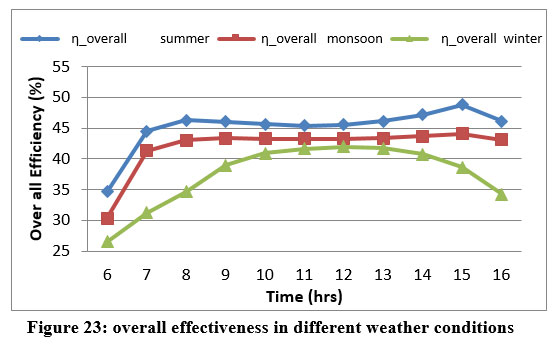
Overall efficiency
The total effectiveness of the nanofluid base photovoltaic thermal collector is a combination of the heat and electrical effectiveness of the system. Fig.23 indicates hourly variation of the overall efficiency of volume fraction 2% and tube diameter is 15 mm and mass flow rate is 0.016kg/sec. maximum efficiency is available in the month of summer and minimum in winter.
.jpg) | Figure 23: overall effectiveness in different weather condition
|
Conclusions
In this study, the mathematical calculation is carried out for different components of a nanofluid-based PVT collector. It examines the performance parameters of the PVT collector in different seasons at 2% and 3% volume fractions of cu/water, fluid. The accuracy of predicted result is compare to the numrical results avalible in litrature. Following conclusions are obtained.
1. The exit temperature of the fluid is inversely connected with the mass transfer rate. And directly connected with tube diameter. Enhance the mass transfer rate to reduce the exit temperature. And enlarge the tube diameter exit temperature of the fluid increases. And another way to increase the volume fraction the exit temperature of the fluid is also increased. Maximum exit temperature is achieved in the summer seasons at a volume fraction of 3%, tube diameter of 15 mm, and mass transfer 0.016 kg/sec is 35.28 oC
2. Back surface temperature is inversely related to mass transfer rate. And directly connected to the tube diameter. With the enhance in the mass transfer rate, the back surface temperature is reduced, And Tube diameter is reduced back surface temperature is reduced.
3. Thermal performance increased with increasing the mass transfer rate. Thermal efficiency decrease with increasing volume fraction. Maximum thermal efficiency is achieved in the month of summer at 32.5% in volume fraction is 2% and mass transfer rate is 0.036kg/sec.
4. The electrical effectiveness of the PVT collector is improved with increasing the mass transfer rate and volume fraction. The average electrical efficiency is summer, winter, and monsoon 14.5%, 14.8%, and 16.8% respectively.
5. Heat gain is increased when increasing in the mass transfer rate and reduced with increasing volume fraction. Maximum heat gain is 399.92 wh achieved in the summer season at a volume fraction is 2% and mass transfer rate of 0.036 kg/sec.
6. Pumping power and pressure drop increases in the mass transfer rate increase.
7. Over all average efficiency achieved in summer, winter, and monsoon seasons is 45.12%, 42.01% and 37.40% at volume fraction 2%.
The summarized work of this investigation is for the electrical effectiveness of PV modules in winter and monsoon seasons is more suitable compared to the summer season because, in winter and monsoon seasons, the atmospheric temperature is near to the STC condition and gives minimum voltage loss in PV panels. It is more suitable for the better electrical performance of the system.3,4
Future work will focus on establishing an experimental stand to validate the model and the dynamic fusion with household customers. Also, perform uncertainty analysis for the accuracy of experimental results. On the other hand, find out the exergy and cost-effectiveness of a physical model.
Acknowledgments
This research work was supported by financial assistance under the fellowship program entitled "Chief Minister Scholarship for Ph.D. on Climate Change" with reference no.: 3152-53/SKMCCC/EPCO/2021 from the Environmental Planning & Coordination Organization (EPCO), Ministry of Environment, Govt. of Madhya Pradesh, India.
Conflict of Interest
There is no conflict of interest between the authors.
Funding
The author(s) have received financial support for publication, under the fellowship program entitled "Chief Minister Scholarship for Ph.D. on Climate Change" with reference no.: 3152-53/SKMCCC/EPCO/2021 from the Environmental Planning & Coordination Organization (EPCO), Ministry of Environment, Govt. of Madhya Pradesh, India.
References
- Abdelrazik, A.S., Al-Sulaiman, F.A., Saidur, R. A review on recent development for the design and packaging of hybrid photovoltaic/thermal (PV/T) solar systems. Renew. Sustain. Energy Rev. 2018; 95,110–129.
- Duffie JA, Beckman WA. Solar engineering of thermal processes. 1980,
- P. Singh , N. Ravindra, Temperature dependence of solar cell performance –an analysis, Solar Energy materials and Solar cells, 2012, vol.101 36-45.
- M. El-Adawi, I. Al-Nuaim, The temperature variation of a solar cell in Relation to its performance, Journal of Environmental science and engineering, 2010, vol.4 56-59.
- Hasan MA, Sumathy K. Photovoltaic thermal module concepts and their performance analysis: A review. Renewable and Sustainable Energy Reviews,2010, 14:1845-59.
- T.T. Chow, A review on photovoltaic/thermal hybrid solar technology, Applied Energy, 2010,87 365–379.
- K. Sukhatme, Suhas P. Sukhatme, Solar Energy: Principles of Thermal Collection and Storage,Tata McGraw-Hill, 1996
- Wolf, M., Performance analyses of combined heating and photovoltaic power systems for residences, Energy Convers, 1976,16, 79–90.
- Sarhaddi, F., Farahat, S., Ajam, H., Behzadmehr, A., Adeli, M.M.. An improved thermal and electrical model for a solar photovoltaic thermal ( PV/T ) air collector. Appl. Energy. 2010; 87 (7), 2328–2339.
- Arslan, E., Aktas, M., Can, F. Experimental and numerical investigation of a novel photovoltaic thermal ( PV/T ) collector with the energy and exergy analysis. J. Clean. Prod. 2020 276.
- Huang, B.J., Lin, T.H., Hung, W.C., Sun, F.S. Performance evaluation of solar photovoltaic/thermal systems. Sol. Energy. 2001; 70, 443–448.
- Yazdanpanahi, J., Sarhaddi, F., Adeli, M.M. Experimental investigation of exergy efficiency of a solar photovoltaic thermal ( PVT ) water collector based on exergy losses. Sol. Energy. 2015. 118, 197–208.
- Aste N, Leonforte F, Del Pero C. Design, modeling and performance monitoring of a Photovoltaic thermal (PVT) water collector. Sol Energy. 2015;112:85–99.
- Sani E, Barison S, Pagura C, Mercatelli L, Sansoni P, Fontani D, et al. Carbon nanohorns-based nano?uids as direct sunlight absorbers. Opt Express 2010;18:5179–87
- Yousif J, Kazem HA, Boland J. Predictive models for photovoltaic electricity production in hot weather condition. MDPI-Energies 2017;10 (7):971.
- Kazem HA, Yousif JH, Chaichan MT. Modeling of daily solar energy system prediction using a support vector machine for Oman. Int J Appl Eng Res 2016;11(20):10166–72.
- Choi S.U.S. Enhancing thermal conductivity of fluids with nanoparticles. Develop. Appl. Non-Newtonian Flows, 1995; 99-106
- Youse?, T., Veysi, F., Shojaeizadeh, E., Zinadini, S. An experimental investigation on the e?ect of Al2O3–H2O nano?uid on the e?ciency of ?at-plate solar collectors. Renew. Energy. 2012; 39, 293–301.
- M. Sardarabadi, M. Passandideh-Fard, and S. Z. Heris, Experimental investigation of the effects of silica/water nanofluid on PV/T (photovoltaic thermal units),Energy, 2014, vol. 66, pp. 264-272.
- Ghadiri, Matin, Sardarabadi, Mohammad, Pasandideh-fard, Mohammad, Moghadam Ali, Jabari. Experimental investigation of a PVT system performance using nano ferro?uids. Energy Convers. 2015; Manage,103, 468–476.
- Shenoy A, Sheremet M, Pop I. Convective flow and heat transfer from wavy surfaces: viscous fluids, porous media, and nanofluids. CRC Press. 2016
- M. Sardarabadi, M. Passandideh-Fard. Experimental and numerical study of metal oxides/ water nanofluids as a coolant in photovoltaic thermal systems (PVT), Sol. Energy Mater. Sol. Cells. 2016; 157 533–542
- Jin J, Jing D. A novel liquid optical filter based on magnetic electrolyte nanofluids for hybrid photovoltaic/thermal solar collector application. Sol Energy. 2017;155:51–61.
- Fayaz, H., Nasrin, R., Rahim, N.A., Hasanuzzaman, M. Energy and exergy analysis of the PVT system: effect of nanofluid flow rate. Sol. Energy. 2018; 169, 217–230.
- Al-Waeli AH, Chaichan MT, Sopian K, Kazem HA. Influence of the base fluid on the thermo-physical properties of PV/T nanofluids with surfactant. Case Stud Therm Eng. 2019; 13:100340.
- S. Misha, A.L. Abdullah, N.Tamaldin et al., Simulation CFD and experimental investigation of PVT water system under natural Malaysian weather condition. Energy Reports. 2019; 11.162.
- Yuting Jia, Fengming Ran, Chuqiao Zhu, Guiyin Fang. Numerical analysis of photovoltaic thermal collector using nano?uid as a coolant. Sol Energy. 2020;625-636
- Mohamed Hissouf,M ’barek Feddaoui, Numerical study of a covered Photovoltaic-Thermal Collector (PVT) enhancement using nano?uids, Solar Energy,2020,199,115-127.
- Madalina Barbu, Monica Siroux, Numerical model and parametric analysis of a liquid based hybrid photovoltaic thermal (PVT) collector, Energy Reports, 2021, 7,7977-7988.
- P. Jidhesha, T.V. Arjunanb, N. Gunasekara. Thermal modeling and experimental validation of semitransparent photovoltaic thermal hybrid collector using CuO nanofluid. Journal of Cleaner Production. 2021.
- Adriano Pamain , P.V. Kanaka Rao. Prediction of photovoltaic power output based on different non-linear autoregressive artificial neural network algorithms. Global Energy Interconnection. April 2022, Volume 5 Number 2 (226-235)
- Enas Taha Sayed, Hegazy Rezk 3, Abdul Ghani Olabi. Application of Arti?cial Intelligence to Improve the Thermal Energy and Exergy of Nano?uid-Based PV Thermal/Nano-Enhanced Phase Change Material. Energies MDPI, Nov. 2022, 15, 8494
- Orhan Büyükalaca, Hac? Mehmet K?l?ç, Umutcan Olmu?, Numerical analysis and ANN modeling of the performance of hexagonal boron nitride-water nanofluid PVT collectors, Thermal Science and Engineering Progress, 1 August 2023, Volume 43, 101997.
- Tiwari, A., Sodha, M.S. Performance evaluation of hybrid PV/thermal water/air heating system: a parametric study. Renew. Energy. 2006. 31 (15), 2460–2474.
- Pak, B.C., Cho, Y.I. Hydrodynamic and heat transfer study of dispersed ?uids with submicron metallic oxide particles. Exp. Heat Transfer Int. J. 1998; 11, 151–170.
- Khanjari, Y., Pourfayaz, F., Kasaeian, A.B., Numerical investigation on using of nano?uid in a water-cooled photovoltaic thermal system. Energy Convers. Manage. 2016; 122, 263–278.
- Brinkman, H.C. The viscosity of concentrated suspensions and solutions. J. Chem. Phys. 1952; 20, 571.
- Maxwell, J.C. A Treatise on Electricity and Magnetism, Clarendon Press. 188; vol. 1
- Li, Q., Xuan, Y. Convective heat transfer and ?ow characteristics of Cu-water nano?uid. Sci. China, Series E: Technol. Sci. 2002; 45, 408–416.
- Yazdanifard, F., Ebrahimnia-Bajestan, E., Ameri, M., Investigating the performance ofawater-basedphotovoltaic/thermal (PV/T) collector in laminar and turbulent ?ow regime. Renew. Energy. 2016; 99, 295–306.
- Park, Nochang, Oh, Wonwook, Kim, D. Effect of temperature and humidity on the degradation rate of multicrystalline silicon photovoltaic module. Int. J. Photoenergy, 2013.
- Khanjari, Y., Pourfayaz, F., Kasaeian, A. Numerical investigation on using of nano?uid in a water-cooled photovoltaic thermal system. Energy Convers. 2016, Manage. 122, 263–278.
- Chwieduk, Dorota, Soalr Energy in Building. Elsevier. 2014.
- Duffie, J.A., Beckman, W.A., Solar Engineering of Thermal Processes. John Wiley & Sons, Inc, New York. 1991.
- Sree Harsha Bandaru, Victor Becerra , Sourav Khanna. A Review of Photovoltaic Thermal (PVT) Technology for Residential Applications: Performance Indicators, Progress, and Opportunities, MDPI-Energies. 2021; 14, 3853
- F. Yazdanifard, M Ameri, Performance of nanofluid based photovoltaic thermal system: a review, Renew, Sustain Energy Rev. 2017; 76, 323-352
- Khanjari, Y., Kasaeian, A., Pourfayaz, F. Evaluating the environmental parameters a?ecting the performance of photovoltaic thermal system using nano?uid. Appl. Therm. Eng. 2017. 115, 178–187.
- T.L. Bergman, F.P. Incropera, Fundamentals of heat and mass transfer, John Wiley & Sons, 2011


