Studies on Limnological Parameters and their Impact on the Distribution and Diversity of Zooplankton in Anchar Lake, Kashmir
Maqsooda Akhtar
 , Yahya Bakhtiyar
*
, Zahoor Ahmad Mir
, Muni Parveen
and Raheela Mushtaq
, Yahya Bakhtiyar
*
, Zahoor Ahmad Mir
, Muni Parveen
and Raheela Mushtaq
1
Fish Biology and Limnology Research Laboratory, Department of Zoology,
University of Kashmir,
Srinagar,
Jammu and Kashmir
India
http://dx.doi.org/10.12944/CWE.18.2.29
Copy the following to cite this article:
Akhtar M, Bakhtiyar Y, Mir Z. A, Parveen M, Mushtaq R. Studies on Limnological Parameters and Their Impact on the Distribution and Diversity of Zooplankton in Anchar Lake, Kashmir. Curr World Environ 2023;18(2). DOI:http://dx.doi.org/10.12944/CWE.18.2.29
Copy the following to cite this URL:
Akhtar M, Bakhtiyar Y, Mir Z. A, Parveen M, Mushtaq R. Studies on Limnological Parameters and Their Impact on the Distribution and Diversity of Zooplankton in Anchar Lake, Kashmir. Curr World Environ 2023;18(2).
Download article (pdf)
Citation Manager
Publish History

Introduction
Water is an essential and basic aspect that is necessary for the growth and existence of every living being on earth and covers nearly 71% of its surface in the form of fresh and marine waters 1. The freshwater available on the earth provides services in many sectors like industries, agriculture, fisheries, and domestic activities 2. Over the past two decades, the deterioration of freshwater quality is speeding up due to various natural and anthropogenic activities, which pose a major global challenge 3. Some of the principal causes of water quality degradation and detrimental threats to freshwater ecosystems include the discharge of chemicals from industries, fertilizers from agricultural activities, and sewage from domestic activities. Freshwater bodies have become a limited resource due to excessive pollution, over-exploitation of water resources, and other domestic activities 4-7. Lentic ecosystems such as wetlands, ponds, and lakes sustain a variety of biological communities like phytoplankton, zooplankton, zoobenthos, macrophytes, fishes, and aquatic birds. These communities are crucial to the aquatic food web, nutrient cycling, ecosystem flexibility, and ecological balance. In a lake ecosystem, communities like zooplankton and macrophytes act as potential bioindicators of pollution and are also primary food sources for fish. However, in the last few decades, the distribution, abundance, and richness of macrophytes and zooplankton communities have been influenced due to various anthropogenic activities which have caused serious threats to the ecology of lakes. Moreover, the physicochemical parameters have been adversely changed from their optimum ranges in the eutrophic lakes. One of the vital bioindicators of the aquatic environment is the zooplankton community. Zooplankton are crucial for maintaining the health of our ecosystem as they play specific roles like nutrient recycling, providing food for other biotic communities, and maintaining soil fertility 8,9, and being at the core of the chain of aquatic food webs which serve as a substantial source of nutrition directly or indirectly for nearly all freshwater fishes 10. The biotic and abiotic aspects of aquatic ecosystems can be reflected by zooplankton diversity patterns and community structure, which can help in tracking ecological changes 11,12. Local and regional environmental factors that alter the variety, abundance, and composition of zooplankton populations cause changes in their spatial patterns 13. Furthermore, zooplankton populations are vulnerable to anthropogenic influences, and the communities are very sensitive to environmental changes. While assessing them through various techniques may help in predicting the long-term changes in lake ecosystem 14-17. According to Manickam et al. (2018)18, zooplankton can act as an indicator for changes in trophic dynamics and the ecological health of lakes caused by variations in nutrient loading and climatic conditions. Changes in zooplankton diversity, abundance, and community structure can all act as indicators of environmental change or stress 16, 19. Since changes in physicochemical conditions of aquatic systems result in corresponding changes in the richness, abundance, and distribution of zooplankton which have been regarded as ecologically significant organisms 20,21. The implementation of any management methods requires knowledge of the aspects of water quality and the survey on the pollution status of water bodies.
The present Anchar Lake is under heavy stress due to significant ecological changes brought about by heavy urbanization around the lake. Pollution of this lake is a major problem since it is a breeding ground for many aquatic birds and a food supply for animals. The influx of inorganic nutrients through surface run-off from surrounding agricultural land, sewage from domestic activities, and illegal disposal of garbage into the Anchar Lake are the main detrimental hazards to the ecosystem of the lake 22
Additionally, the lake's water quality has been severely diminished by the discharge and unintentional release of hazardous chemicals from the neighbouring Sher e Kashmir Institute of Medical Sciences (SKIMS) hospital23. To deal with the threats and harmful impacts on the lake ecosystem, it is necessary to study the current status of the lake by analyzing its biotic communities and physicochemical parameters. In this respect, the current study has been conducted to examine the physicochemical characteristics of Anchar Lake as well as the distribution, density, and variety of zooplankton groups.
Materials and methods
Study area
The Anchar Lake is located between the geographic coordinates 34° 20' to 34° 26' N latitude and 74° 82' to 74° 85' E longitude and at 1583 m a.s.l., towards the Northwestern side of Srinagar city J&K, India (Fig. 1). The lake receives water from two sources wherein, it is fed by the Sindh River at the northern end and Khushal Sar Lake at its southern end. While on the other hand, it recharges the adjoining Shalbugh wetland through minor outlet channels. A survey conducted by ESRO (2007)24 reported that in the previous two decades, the lake has been illegally encroached on and reduced from an area of 19.54 km2 to 5.8 km2. The lake has been degraded by effluents from the Sindh (Jhelum river tributary), agricultural wastes, and untreated sewage from the surrounding area (particularly the 66 km2 watershed). In addition, the lake is polluted by the disposal of unethical biomedical wastes from Kashmir’s known SKIMS hospital. As a result of these unplanned and illegal activities, the water quality of Anchar Lake has worsened and is currently under heavy degradation. Based on the pollution status, vegetation, and land use around the catchment area, four sites have been selected from the lake (Fig. 2).
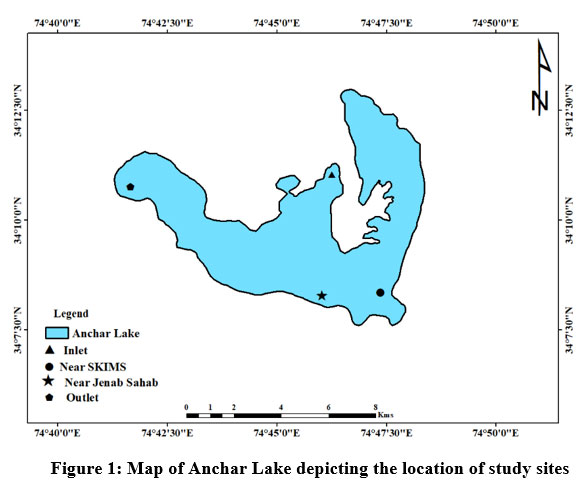 | Figure 1: Map of Anchar Lake depicting the location of study sites
|
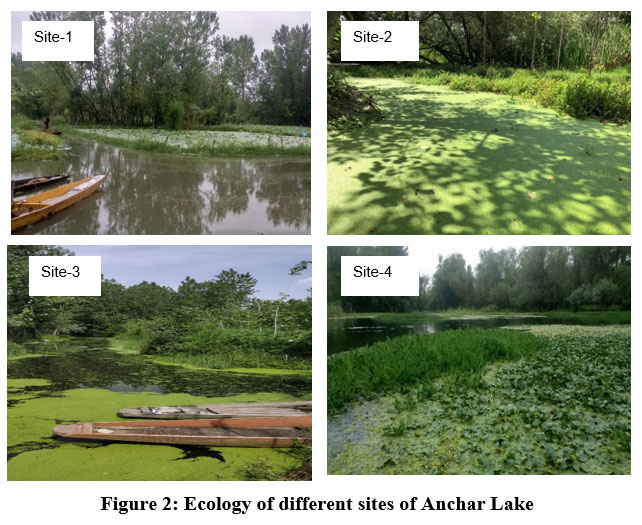 | Figure 2: Ecology of different sites of Anchar Lake.
|
The selected sampling sites for the present study as shown in Fig. 1 are as under:
Site-A1 is located between coordinates 34°08'13'' N and 74°46'50'' E, where the Sind River joins northern side of the lake by network of canals.
Site-A2 is located between coordinates 34°08'30' N and 74°46'42' E towards the southeast of the lake adjacent to SKIMS hospital with marshy land. It receives biomedical wastes and sewage from the SKIMS hospital drainage system.
Site-A3 is located between coordinates 34°10'38' N and 74°47'57' E towards the northeast of the lake. This location is covered by thickly by trees, particularly Poplar and Willow trees. The wastewater from nearby household toilets and kitchen trash from residences is dumped directly into the lake.
Site-A4 is situated at the exit of the lake on the southern side between coordinates 34°09'41'N and 74°47'30'E. This site receives slow-moving waters from the middle of the lake. It is distinguished by macrophytes and extensive growth of trees along its banks.
Analysis of physicochemical parameters
From January 2019 to December 2020, water sampling was carried out at four distinct sites of the lake, below the water's surface (almost 10 to 15 cm). During the present study, the physicochemical parameters like water temperature (WT), transparency, pH, and electrical conductivity (EC) were noted on the spot while the remaining samples underwent laboratory analysis. A mercury thermometer was used to record the temperature, while a 20 cm-diameter standard Secchi disc was used to gauge transparency. The pH and electrical conductivity were monitored through a hand-held digital pH meter (Systronics-MKVI) and conductivity meters (Systronics-DB-104). The parameters like dissolved oxygen (DO), free carbon dioxide (FCO2), total alkalinity (TA), total hardness (TH), chloride (Cl-), nitrate-nitrogen (NO3-N), nitrite-nitrogen (NO2-N), and total phosphorus (TP) were detected through standard methods APHA (2017)25.
Qualitative and quantitative analysis of zooplankton species
The samples used in the current investigation were taken from Anchar Lake with the help of a standard plankton net of bolting silk having a mesh size of 150 um. The collected samples were kept in 50 ml vials and were fixed in 4% formaldehyde solution. Zooplankton samples were counted using the Sedgwick rafter cell. The systematic identification of zooplankton species was done through a binocular microscope (MLX-16B1296) with the help of standard taxonomic works 26,27.
Plankton samples were collected for quantitative enumeration by filtering 10 litres of water retrieved independently from various depths using Rutner's sampler (2000 ml) and stored in 4% formalin. The conserved sample was shaken before 1 ml was removed with a wide-mouthed glass pipette into the Sedgwick rafter cell and examined under a binocular microscope at the time of counting. For accuracy, the subsamples were counted three times, and the mean value was selected to calculate the number of individuals per litre (ind./l) of water using Welch's 28 formula.

n: number of individuals per cubic meter of water; a: individuals per 1 ml of concentrated sample; c: volume of concentrated sample; l: volume of water usually sieved (10 liters).
Diversity indices
Various indices were used to calculate the diversity based on species richness, abundance, and evenness.
Shannon-Wiener index ‘H’’ (Shannon and Weaver 1963) 29
Simpson index ‘1-D’ (Simpson 1949)30
Margalef”s index ‘MD’ (Clifford and Stephenson 1975) 31
The evenness index (J) was calculated by using the formula of Pielou 32
Statistics Analytical
SPSS (ver. 20.0) was used to carry out statistical analysis wherein the significant variation was determined through one-way ANOVA using Tukey’s test. The ecological correlations between physicochemical parameters and zooplankton were estimated by using a two-tailed Pearson’s correlation. The population density was calculated as ind./l in MS Excel software. The diversity indices and cluster analysis were performed in Past software.
Results and Discussion
Physicochemical parameters
The descriptive summary regarding the general variation on site-season scales in the physicochemical parameters of the Anchar Lake is depicted in Table 1 while the significant variations are depicted in Fig. 3.
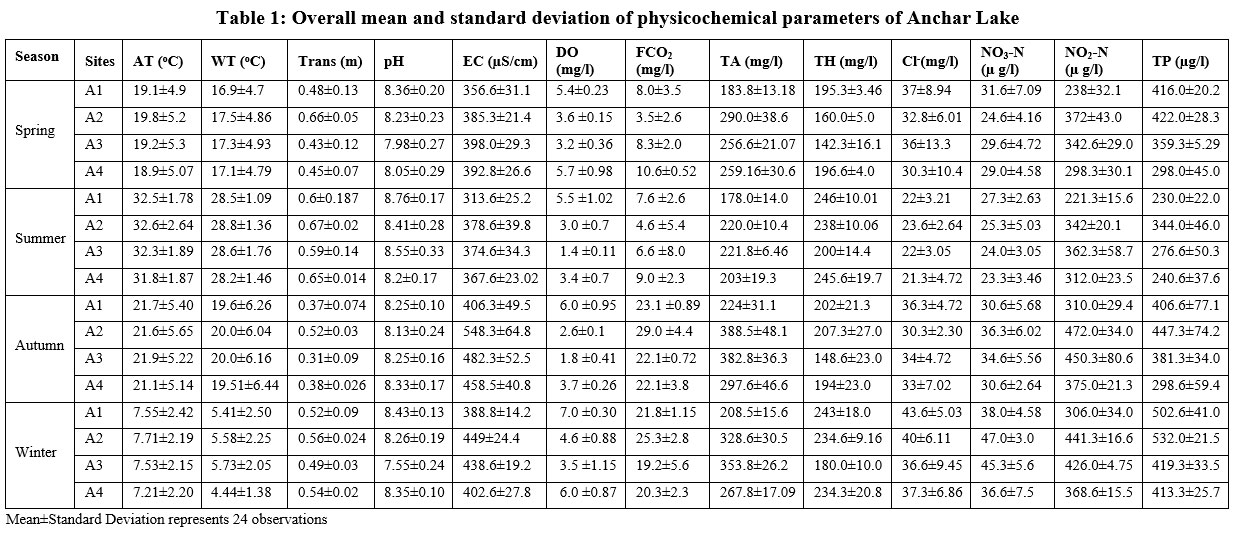 | Table 1: Overall mean and standard deviation of physicochemical parameters of Anchar Lake.
|
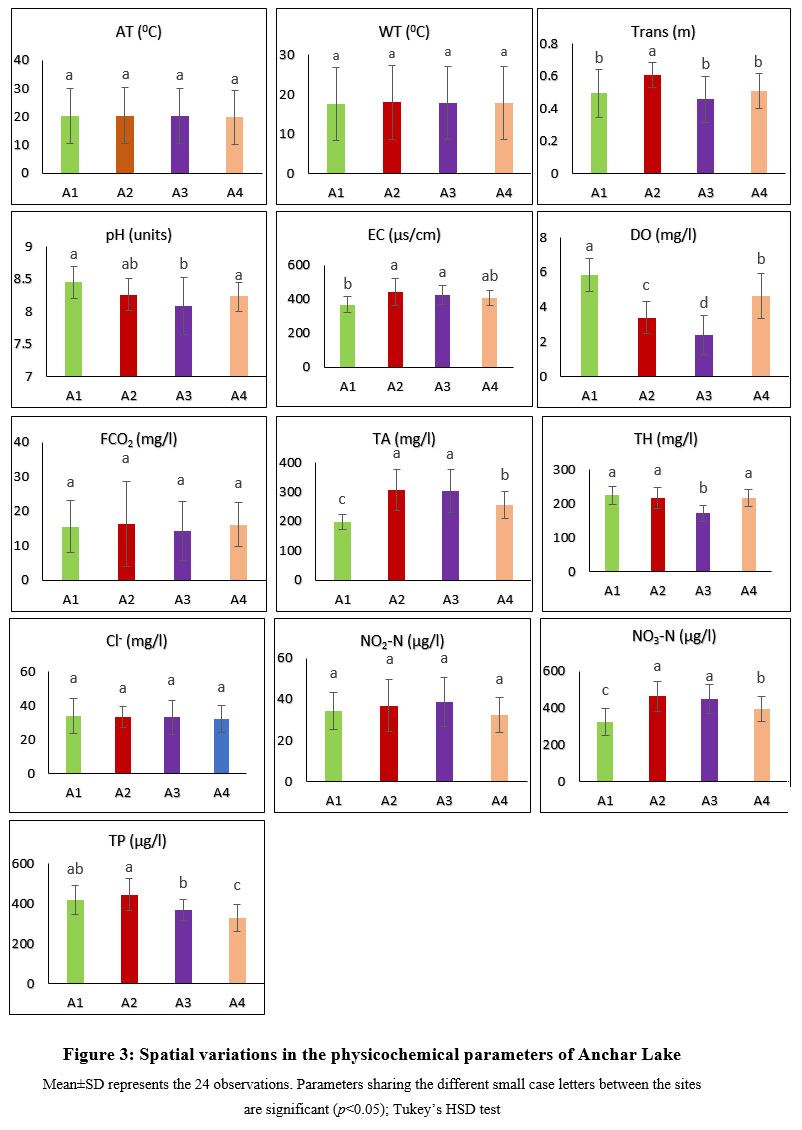
.jpg) | Figure 3: Spatial variations in the physicochemical parameters of Anchar Lake
|
During the current study, a significant variation (p < 0.05) was observed in transparency, dissolved oxygen, pH, electrical conductivity, total alkalinity, nitrate-nitrogen, total hardness, and total phosphorus between the different sites of Anchar Lake, whereas non-significant variation was observed in air temperature, water temperature, free carbon dioxide, chloride, and nitrite-nitrogen (Fig. 2).
During the research period, air temperature (AT) did not fluctuate between the different sites. The winter was bitterly cold with a minimum mean value of 7.21±2.2 oC at site A4. The highest annual mean value of air temperature of the lake was found to be 32.6±2.64 oC in summer at site A2. Water temperature (WT) was recorded as lowest at 4.44±1.38 oC during winter at site A4, while highest at 28.8±1.36 oC in summer at site A2. The increase in the WT during the summer season may be due to the maximum sunlight falling on the water surface of the lake which is also confirmed by the strong correlation between AT and WT. Similar findings regarding the fluctuation in the temperature were also reported by Chowdhury and Mazumder (1981)33 while studying the limnology of Lake Kaptai.
The lake water was found to be murky throughout the research period, resulting in decreased transparency value of 0.31±0.09 m in the autumn at site-A3 and high transparency value of 0.67±0.02 m in the summer at site-A2. Overall higher values for transparency were observed during the summer period and low during the winter and autumn seasons in Anchar Lake which has been related to different factors, viz., planktonic population 34,35, glacial silt 35, suspension of phytoplankton in water 36 the volume of water body 37 and addition of sewage 38.
The pH was recorded as a minimum of 7.55±0.24 in the winter at site-A3 and a maximum of 8.76±0.17 in the summer at site-A1. The lower pH during the winter season may be due to low photosynthetic activity and freezing of the surface water layer which increases the respiratory carbon dioxide level and organic acids in the lake 39-42. While the rise in pH during summer appears to be linked to increased photosynthetic activity, a faster temperature rise, and a longer photoperiod 43,44.
Electrical conductivity (EC) is used to assess the aqueous solution's capability to conduct an electric current. During the current investigation, EC was recorded to be maximum (548.3±64.8 us/cm) in the autumn at site A2 and a minimum of 313.6±25.2 in the summer season at site A1. The lower conductivity throughout the summer may be attributed to the utilization of ions by macrophytes. EC was higher as compared to earlier studies wherein values of EC in the lake were recorded as 95 to 490 us/cm 45. The higher values at site A2 in the Anchar Lake might be due to the increased pollution and higher trophic status 46.
The outcomes are in line with the findings of Freimuth (1994) 47, wherein, he found an increase in EC throughout the autumn and linked it to an increase in organic material.
The alkalinity ranged from 178.0±14.0 mg/l in the summer at site A1 to 388.5±48.1 mg/l in the autumn at site A2. The difference between summer and autumn alkalinity in epilimnetic waters determines a higher level of eutrophication in Lake 48. The alkalinity level in the lake might rise due to the accumulation of the ions of bicarbonate as the pace of their absorption decreases over the winter and autumn months. The lower alkalinity in the summer is due to a decrease in bicarbonate ions which might be utilized through phytoplankton development. The greater alkalinity at site A2 involved the combined effect of detergent, chloride, and other pollution loadings 49.
Dissolved oxygen (DO) is one of the most crucial factors in water quality analysis. In the present study, DO was recorded at a maximum of 7.0±0.30 mg/l in winter while a minimum of 1.4±0.11 mg/l in summer. The increased level of DO during the winter may be due to the fact that cold water has a higher oxygen content than warm water, which creates an inverse connection between dissolved oxygen and water temperature 50. Moreover, the greater rate of decomposition of organic matter influenced by the higher temperature and microbial activity in the summer season decreases the level of DO 9, 49, 51,52. According to Dokulil et al. (2006) 53, biological activities and eutrophication in the lake cause a decrease in the DO levels of water. While the high DO during the winter season indicates low biological activity in Lake 54.
Free carbon dioxide (FCO2) involves the release of carbon dioxide by the respiration activity of living organisms in aquatic ecosystems. In the current study, FCO2 was observed to be lowest (3.5±2.6 mg/l) in spring at site A2 while the highest value of 29.0±4.4 mg/l was reported in the autumn season at site A2. The maximum FCO2 noticed in the autumn may be attributed to the breakdown of organic materials. The higher FCO2 levels in the autumn season may be because of microbial decomposition and metabolic activities which release a huge amount of CO2. Similar results regarding the seasonal trend of FCO2 in Anchar Lake were also observed by various other workers 55,56, 57.
The chloride ion (Cl-) is found in most natural waters. According to Dokulil et al. (2006) 53, excessive Cl- concentration in freshwater is considered a sign of contamination. In the present study, the minimum Cl- concentration of 21.3±4.72 mg/l was reported in summer at site A4 while the maximum of 43.6±5.03 mg/l in winter at site A1. The outcomes are in accordance with the findings of Salim et al. (2015) 58. The maximum Cl- concentration at site-A1 appears due to chloride-containing wastes like domestic sewage and disposal of municipal garbage, flowing from the catchment region, while the low concentration in summer reflects the diluting effect of contaminants by surface runoff, reducing the chloride content of the lake.
The quantity of carbonates and bicarbonates due to calcium and magnesium salts determines the total hardness (TH) of water. In the existing study, a maximum value of 246±10.01 mg/l of TH was detected in the summer at site A1 while a minimum value of 142.3±16.1 mg/l was in the spring at site A3. According to Sawyer (1960) 59, three categories of TH have been created: mild (0-75 mg/l), moderately harsh (75-150 mg/l), and hard (151-300 mg/l). The higher TH of the Anchar Lake might be due to the presence of vast amounts of sewage, detergents, and other human activities. Moreover, eutrophication is also an indication of the higher hardness of the aquatic habitat 60.
The nitrite-nitrogen (NO2-N) was found to be highest (472.0±34.0 µg/l) in autumn at site A2 and the lowest (221.3±15.6 µg/l) in summer at site A1. Because nitrite is an unstable product originating from the nitrification of ammonia or denitrification of nitrates, it is usually considered that nitrite concentrations in freshwaters are insignificant 61,62. The increasing NO2-N at site A2 in Anchar Lake is likely due to increased sewage pollution and fertilizer use in the catchment region.
The nitrate-nitrogen (NO3-N) concentration was reported to be maximum (47.0±3.0 µg/l) in winter at site A2 and minimum (23.3±3.46 µg/l) in the summer at site A4. The high values in the lake during the winter season are a result of the decomposition of autochthonous and allochthonous elements. The increase in NO3-N concentration during winter may also be attributed to the fact that under high oxygen concentration, the nitrate-rich sediments add increasing quantity of NO3-N to water 63,64. The reduced concentration of nitrates in the summer might be related to the absorption of these nutrients by autotrophs during their growth and development 65.
Phosphorus is a critical limiting nutrient that causes eutrophication in freshwater systems 66. The highest concentration of 532.0±21.5 µg/l of phosphorus in the current investigation was found during winter at site A2 and the lowest concentration of 230.0±22.0 µg/l was found during summer at site A1. The primary sources of phosphorus are household waste, detergents, fertilizers from agricultural fields, and wastewater. Higher phosphorus levels in the lake have been linked to pollution from the discharge of sewage, agricultural wastes, and surface runoff from the catchment area 67. The presence of a high level of phosphorus also indicates eutrophic conditions, which can give rise to algal blooms in the lake. While low phosphorus concentrations in summer may be attributable to phytoplankton's utilization of nutrients, other factors may also contribute to this phenomenon 68. Moreover, the high anthropogenic pressure at inlet locations from sewage and other pollution effluents results in high phosphorus concentration in the lake 69.
Correlation
The descriptive analysis of the correlation between the physicochemical parameters of Anchar Lake is presented in Table 2. Wherein, significantly positive and strong correlations were observed for AT with WT; pH with AT; Cl- with EC and TA; DO with Cl- and TH; FCO2with EC, TA, Cl-; NO2-N with EC, TA, Cl- and FCO2; NO3-N with EC, TA, DO, FCO2, and NO2-N; TP with EC, TA, Cl-, DO, FCO2, NO2-N, and NO3-Nwhereas significantly negative and strong correlations were observed for both AT and WT with Cond., TA, Cl-, DO, FCO2, NO2-N and TP; Trans with EC, TA, and FCO2; TA with pH, TH and DO.
Table 2: Correlation coefficients between various physicochemical parameters of water in Anchar Lake.
| AT | WT | Trans | EC | TA | pH | Cl | TH | DO | FCO2 | NO2-N | NO3-N | TP | |
| AT | 1 | ||||||||||||
| WT | .987** | 1 | |||||||||||
| Trans | .243* | .215* | 1 | ||||||||||
| EC | -.317** | -.288** | -.326** | 1 | |||||||||
| TA | -.407** | -.378** | -.330** | .791** | 1 | ||||||||
| pH | .273** | .249* | .191 | -.254* | -.353** | 1 | |||||||
| Cl- | -.742** | -.758** | -.243* | .263** | .290** | -.288** | 1 | ||||||
| TH | -.002 | -.035 | .340** | -.249* | -.362** | .363** | -.090 | 1 | |||||
| DO | -.508** | -.507** | -.040 | -.259* | -.362** | .123 | .370** | .433** | 1 | ||||
| FCO2 | -.528** | -.514** | -.427** | .667** | .608** | -.112 | .380** | .086 | .139 | 1 | |||
| NO2-N | -.720** | -.705** | -.233* | .467** | .517** | -.189 | .551** | .089 | .197 | .605** | 1 | ||
| NO3-N | -.214* | -.209* | -.161 | .634** | .662** | -.242* | .218* | -.110 | -.407** | .461** | .548** | 1 | |
| TP | -.676** | -.684** | -.025 | .362** | .366** | -.044 | .545** | .115 | .350** | .530** | .641** | .279** | 1 |
*Correlation is significant at the 0.05 level (2-tailed)- reflects the confidence level is 95%.
**Correlation is significant at the 0.01 level (2-tailed)-reflects the confidence level is 99%
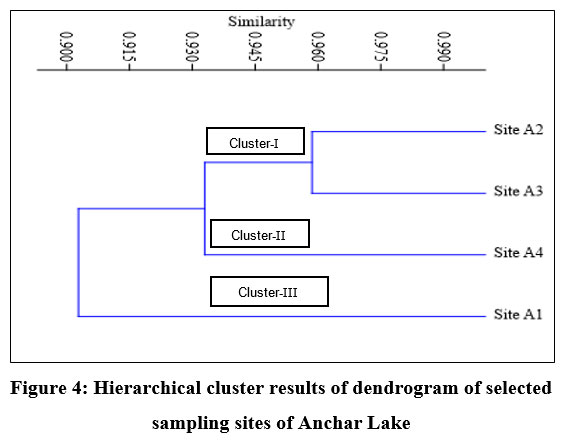
Cluster analysis
By using cluster analysis, the degree of resemblance between sites in terms of physicochemical parameters was determined. During the present study, the cluster analysis on the dataset of Anchar Lake revealed three well-defined clusters in the form of a dendrogram (Fig. 4). The cluster-I represent site-A2 and site-A3 with 0.96% similarity, cluster-II represents site-A4, and cluster-III represent site-A1. On clustering different sites of Anchar Lake, Site A2, and A3 showed maximum similarity during the study period. Site A1 recorded the least similarity with other sites.
 | Figure 4: Hierarchical cluster results of dendrogram of selected sampling sites of Anchar Lake
|
Zooplankton densities
Zooplankton is the most significant biotic community in an aquatic ecosystem and plays a function in the food web, energy transfer, and nutrient cycling 70-72. They also serve as potential bioindicators and are a well-suited way of understanding the pollution load of lentic ecosystems 73. This plankton community is considered to be a good source of knowledge while studying environmental events and disturbances like climate change and trophic shifts in Lake 74. In this investigation, a total of 44 species of zooplankton were found in Anchar Lake which belonged to two major taxonomic groups viz., Rotifera and Cladocera, wherein 27 species were identified from Rotifera while 17 species were identified from Cladocera (Table 3).
Table 3: Distribution pattern of zooplankton at four sites in Anchar Lake.
| Zooplankton | Site-A1 | Site-A2 | Site-A3 | Site-A4 |
Cladocera | ||||
| Family: Chydoridae | ||||
| Alona affinis | - | + | + | + |
| Alona costata | - | - | + | - |
| Alona monocanthus | + | + | + | + |
| Acropus harpae | + | + | + | + |
| Camptocercus rectirostris | + | + | - | + |
| Chydorus sphaericus | + | + | - | + |
| Pleuroxus denticulatus | + | + | - | - |
| Family: Daphnidae | ||||
| Ceriodaphnia quadrangula | + | + | + | - |
| Daphnia pulex | + | + | + | + |
| Daphnia rosea | - | - | + | - |
| Daphnia magna | + | + | + | + |
| Simocephalus vetulus | - | + | + | - |
| Family: Moinidae | ||||
| Moina micrura | + | + | + | + |
| Family: Bosminidae | ||||
| Bosmina coregoni | + | + | + | + |
| Bosmina longirostris | + | + | + | + |
| Family: Sididae | ||||
| Diaphanosoma brachyurum | + | + | + | + |
| Family: Macrothricidae | ||||
| Macrothrix rosea | - | + | + | - |
| Total | 12 | 15 | 14 | 11 |
Rotifera | ||||
| Family: Brachionidae | ||||
| Brachionus angularis | + | + | + | + |
| Brachionus quadridentata | + | + | + | + |
| Brachionus bidentate | - | - | + | - |
| Keratella cochlearis | + | + | + | + |
| Keratella hiemalis | - | + | - | + |
| Keratella quadrata | + | + | + | + |
| Notholca acuminate | - | + | - | + |
| Mytilina ventralis | + | + | + | + |
| Mytilina mucronata | - | - | + | + |
| Platyias quadricornis | + | - | - | + |
| Platyias patulus | - | + | - | + |
| Family: Trichocercidae | ||||
| Trichocerca cylindrical | - | - | + | - |
| Trichocerca longiseta | - | - | + | + |
| Family: Lepadellidae | ||||
| Lepadella ovalis | + | + | + | + |
| Lepadella patella | - | - | + | + |
| Family: Lecanidae | ||||
| Monostyla quadridentata | - | - | + | + |
| Monostyla bulla | + | + | + | - |
| Monostyla lunaris | - | + | - | - |
| Family:Notommatidae | ||||
| Cephalodella auriculata | + | - | - | + |
| Cephalodella gibba | + | - | - | + |
| Family: Synchaetidae | ||||
| Polyarthra vulgaris | + | - | + | + |
| Family: Gastropidae | ||||
| Gastropus stylifer | + | - | - | + |
| Family: Filinidae | ||||
| Filinia longiseta | + | + | - | + |
| Filinia terminalis | - | - | + | - |
| Family: Philodinidae | ||||
| Philodina roseola | - | + | + | - |
| Family: Testudinellidae | ||||
| Testudinella sp. | + | + | - | + |
| Family: Asplanchnidae | ||||
| Asplanchna priodonta | - | + | - | - |
| Total | 14 | 15 | 16 | 20 |
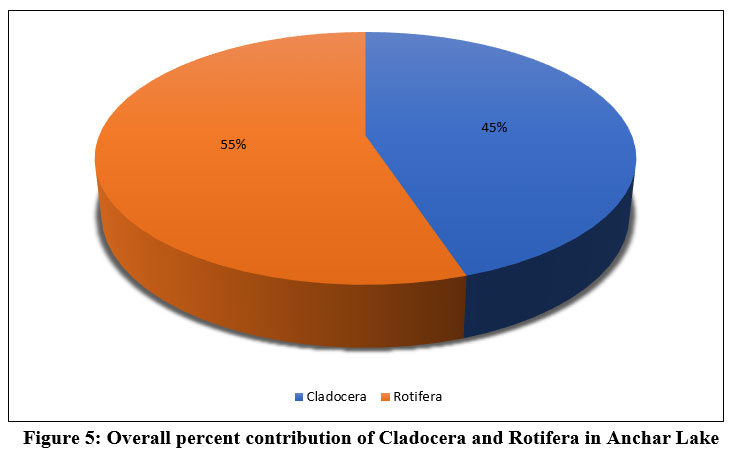
In the present study, the maximum percentage contribution was recorded from class Rotifera (55%) followed by Cladocera (45%) inhabiting the Anchar Lake (Fig. 5), Throughout the study period, the highest Cladocera density was recorded at site-A2. (15.8±28.39 ind./l) and minimum density at site-A4 (11.38±10.4 1ind./l) whereas the maximum density of Rotifera (7.29±5.26 ind./l) at the site-A4 and minimum density (5.04±5.11 ind./l) at site-A2 (Tables 4 & 5).
 | Figure 5: Overall percent contribution of Cladocera and Rotifera in Anchar Lake
|
Table 4: Spatial variation in population density (ind./l) of Cladocera species in Anchar Lake
| Species | A1 | A2 | A3 | A4 |
| Alona affinis | 0 | 7.791±13.44 | 24.75±17.95 | 10.41±10.34 |
| Alona costata | 0 | 0 | 27.62±8.54 | - |
| Alona monocanthus | 11±12.09 | 11.79±12.28 | 11.46±12.84 | 9.0±9.63 |
| Acropus harpae | 26.42±13.84 | 23.95±10.86 | 22.08±15.28 | 20.87±12.46 |
| Camptocercus rectirostris | 22.42±15.46 | 13.54±12.19 | 0 | 13.91±12.46 |
| Chydorus sphaericus | 32.21±14.90 | 32.5±9.88 | 0 | 30.83±11.84 |
| Pleuroxus denticulatus | 21.16±13.24 | 18.37±15.59 | 0 | 0 |
| Ceriodaphnia quadrangula | 16.3±15.43 | 17.92±16.93 | 19.45±16.26 | 0 |
| Daphnia pulex | 24.79±15.65 | 19.66±15.73 | 21.29±13.79 | 24.33±11.06 |
| Daphnia rosea | 0 | 0 | 17.37±12.22 | 0 |
| Daphnia magna | 28.66±13.84 | 22.79±16.26 | 25.25±16.63 | 25.46±14.006 |
| Simocephalus vetulus | 0 | 13.16±11.89 | 10.58±11.52 | 0 |
| Bosmina coregoni | 21.33±9.29 | 18.66±12.11 | 21.42±8.107 | 18.2±11.13 |
| Bosmina longirostris | 20.04±14.89 | 20.83±16.38 | 24.08±15.32 | 13.5±9.26 |
| Moina micrura | 7.5±9.41 | 8.58±8.77 | 8.04±9.16 | 8.12±9.46 |
| Diaphanosoma brachyurum | 19.5±12.96 | 19.79±15.79 | 20.37±13.80 | 18.83±17.55 |
| Macrothrix rosea | 0 | 19.71±14.76 | 12.08±13.31 | 0 |
| Mean ± SD | 14.78±11.41 | 15.8±28.39 | 15.63±9.30 | 11.38±10.4 |
Table 5: Spatial variation in population density (ind./l) of Rotifera species in Anchar Lake
| Species | A1 | A2 | A3 | A4 |
| Brachionus angularis | 7.58±10.66 | 5.83±9.56 | 5.33±9.11 | 5.583±9.09 |
| Brachionus quadridentata | 14.04±11.82 | 7.83±11.33 | 13.25±14.62 | 11.92±16.38 |
| Brachionus bidentate | 0 | 0 | 5.75±9.57 | 0 |
| Keratella cochlearis | 9.21±10.65 | 12.04±13.05 | 12.5±14.54 | 4.79±9.60 |
| Keratella hiemalis | 0 | 7.25±10.91 | 0 | 12.33±13.78 |
| Keratella quadrata | 16.08±14.89 | 11.08±13.14 | 10.5±15.49 | 16.83±17.58 |
| Notholca acuminate | 0 | 5.58±9.956 | 0 | 7.292±11.14 |
| Mytilina ventralis | 11.75±13.92 | 11.67±13.0 | 13.08±17.76 | 10±13.09 |
| Mytilina mucronata | 0 | 0 | 13.5±18.3 | 7.5±11.69 |
| Platiyas quadricornis | 13.54±14.22 | 0 | 0 | 12.33±14.37 |
| Platiyas patulus | 0 | 12.79±13.0 | 0 | 13.04±13.35 |
| Trichocerca cylindrical | 0 | 0 | 13.37±12.66 | 0 |
| Trichocerca longiseta | 0 | 0 | 17±17.34 | 14.83±15.23 |
| Lepadella ovalis | 8.5±12.62 | 6.37±9.13 | 7.25±13.3 | 5.83±9.76 |
| Lepadella patella | 0 | 0 | 6.21±10.08 | 6.83±9.47 |
| Monostyla quadridentata | 0 | 0 | 13.33±17.12 | 6.42±12.88 |
| Monostyla bulla | 7.0±8.0 | 5.25±8.32 | 6.42±9.51 | 0 |
| Monostyla lunaris | 0 | 14.17±16.50 | 0 | 0 |
| Cephalodella auriculata | 14.62±16.92 | 0 | 0 | 14.04±17.08 |
| Cephalodella gibba | 7.08±8.55 | 0 | 0 | 10.41±10.63 |
| Polyarthra vulgaris | 12.08±14.58 | 0 | 3.75±7.16 | 11.08±13.13 |
| Gastropus stylifer | 13.12±17.26 | 0 | 0 | 7.92±13.74 |
| Filinia longiseta | 11.5±16.68 | 12.75±16.53 | 0 | 9.583±15.41 |
| Filinia terminalis | 0 | 0 | 15.08±13.78 | 0 |
| Philodina roseola | 0 | 7.83±12.54 | 10±12.58 | 0 |
| Testudinella sp | 10.75±15.25 | 9.25±15.72 | 0 | 8.42±15.36 |
| Asplanchna priodonta | 0 | 6.58±9.48 | 0 | 0 |
| Mean ±SD | 5.81±6.07 | 5.04±5.11 | 6.15±6.04 | 7.29±5.26 |
On a seasonal scale, the maximum values of densities in the summer season for Cladocera were recorded as 18.9±11.36 ind./l, while for Rotifera as 7.6±5.15 ind./l (Tables 6 & 7) which may be due to favorable climatic conditions 75. The maximum temperature during the summer season indicates a higher rate of degradation of organic matter 76, an upsurge in phytoplankton productivity, and growth of macrophytes which in turn increases the obtainability of food material and shelter for zooplankton in the lake 19,77,78. Winter's low zooplankton concentration can be related to a lack of sustenance and low temperatures, which inhibit zooplankton growth 77. Rotifers in eutrophic lakes have been documented with high density 80 and are considered bioindicators of water quality 81, 82. The number of zooplankton species in Anchar Lake showed clear seasonal fluctuations with a rise during the summer and a decrease in the winter and monsoon seasons. Different environmental elements such as water temperature, nutrient content, and other factors appeared to have a significant impact on varied zooplankton distribution during different seasons 83.
In the present investigation, most of the rotifer species like Brachionus quadridentata, Mytilina mucronata, Platiyas quadricornis, Platiyas patulus, Cephalodella auriculata, Monostylla quadridentata, Monostylla bulla, Monostylla lunaris, Filinia longiseta, Filinia terminalis and Philodina roseola attained peak population density in summer while Polyarthra vulgaris and Notholca acuminata attained peak value in the winter season (Table 6). This could be explained by the fact that most of the rotifers depend upon phytoplankton for their food, which flourishes mostly in summer. Therefore, they could maintain their stable population in summer. Also, the population density of some rotifer species did not decline drastically in winter which means being eurythermal, they can survive in the cold waters of winter easily. Similarly, the Cladoceran species like Alona affinis, Alona monocanthus, Camptocercus rectrirostris, Chydorus sphaericus, Daphnia magna, Moina micrura, Diaphanosoma brachyurum, Daphnia magna, Ceriodaphnia quadricangula and Acropus harpae attained peak population density in summer while Bosmina longirostris, Simocephalus vetulus and Macrothrix rosea showed peak population in winter (Table 7). Temperature and nutrition are the key elements that determine the distribution and density of zooplankton populations.
Table 6: Seasonal variation in population density (ind./l) of Cladocera species in Anchar Lake
| Species | Winter | Spring | Summer | Autumn |
| Alona affinis | 0 | 8.58±11.18 | 21.08±14.25 | 13.29±19.30 |
| Alona costata | 6.71±12.19 | 8.5±15.48 | 7.71±14.12 | 4.71±8.57 |
| Alona monocanthus | 2.16±3.94 | 15.66±8.49 | 19.79±14.67 | 5.62±6.46 |
| Acropus harpae | 17.58±10.48 | 25.71±7.91 | 32.25±11.33 | 17.79±16.15 |
| Camptocercus rectirostris | 0±0 | 11.29±9.55 | 23.16±14.58 | 15.4±14.69 |
| Chydorus sphaericus | 18.6±16.64 | 26.16±18.38 | 26.79±17.83 | 23.9±16.73 |
| Pleuroxus denticulatus | 8.04±8.77 | 16.62±18.38 | 13.46±15.86 | 1.42±4.94 |
| Ceriodaphnia quadrangula | 0 | 15.87±11.88 | 29.46±18.20 | 8.37±9.15 |
| Daphnia pulex | 6.66±8.78 | 37.46±7.454 | 28.04±7.63 | 17.92±9.18 |
| Daphnia rosea | 4.17±8.67 | 7±14.10 | 4.291±8.75 | 1.92±4.64 |
| Daphnia magna | 8.37±6.51 | 35.21±10.49 | 38.66±7.91 | 19.92±10.68 |
| Simocephalus vetulus | 8.21±10.68 | 5.92±10.55 | 7.21±10.59 | 2.42±8.19 |
| Bosmina coregoni | 19.87±6.52 | 27.46±6.92 | 10.0±9.64 | 22.29±8.98 |
| Bosmina longirostris | 29.37±10.69 | 25.33±9.98 | 1.75±4.09 | 22±13.01 |
| Moina micrura | 4.62±4.28 | 10.62±9.64 | 17±7.61 | 0 |
| Diaphanosoma brachyurum | 1.71±3.51 | 22.75±12.11 | 33.33±9.96 | 20.71±10.8 |
| Macrothrix rosea | 10.08±18.03 | 7.958±9.88 | 7.67±13.03 | 6.08±9.37 |
| Mean ± SD | 8.6±8.28 | 18.12±10.07 | 18.9±11.36 | 11.9±8.51 |
Table 7: Seasonal variation in population density (ind./l) of Rotifera species in Anchar Lake
| Species | Winter | Spring | Summer | Autumn |
| Brachionus angularis | 0 | 14.25±10.10 | 0 | 10.08±10.42 |
| Brachionus quadridentata | 10.2±10.27 | 7.5±12.65 | 15.66±15.89 | 13.6±14.65 |
| Brachionus bidentate | 0 | 1.83±5.104 | 1.83±6.21 | 2.08±7.06 |
| Keratella cochlearis | 8.33±10.82 | 6.54±10.18 | 11.21±14.12 | 12.45±13.55 |
| Keratella hiemalis | 2.33±5.49 | 6.16±11.58 | 0.25±1.22 | 10.8±13.75 |
| Keratella quadrata | 6.25±10.01 | 11±14.34 | 17±18.05 | 20.25±14.97 |
| Notholca acuminate | 7.33±11.8 | 2.66±7.358 | 0 | 2.875±6.71 |
| Mytilina ventralis | 11.92±12.44 | 15±16.22 | 13.33±16.50 | 6.25±10.89 |
| Mytilina mucronata | 1.66±3.94 | 3.25±9.04 | 12.92±17.36 | 3.16±11.12 |
| Platiyas quadricornis | 7.66±12.57 | 4.66±12.63 | 10.54±12.71 | 3.0±8.382 |
| Platiyas patulus | 4.12±7.92 | 4.58±9.07 | 10.71±15.49 | 6.42±13.02 |
| Trichocerca cylindrical | 0 | 5.5±11.30 | 4.96±10.406 | 2.92±6.70 |
| Trichocerca longiseta | 1.92±6.55 | 5.58±11.46 | 9.33±16.104 | 15±16.37 |
| Lepadella ovalis | 0 | 10.75±12.7 | 7.33±13.91 | 9.87±9.47 |
| Lepadella patella | 2.79±7.56 | 2.5±6.93 | 3.04±7.58 | 4.71±8.37 |
| Monostyla quadridentata | 2.5±8.79 | 4.33±9.18 | 8.58±15.98 | 4.33±12.15 |
| Monostyla bulla | 3.16±6.18 | 6.16±10.09 | 8.92±8.298 | 0.41±2.041 |
| Monostyla lunaris | 2.5±8.49 | 3.16±9.00 | 5.25±13.09 | 3.25±10.02 |
| Cephalodella auriculata | 3±8.145 | 8±14.16 | 10.5±15.02 | 7.17±16.41 |
| Cephalodella gibba | 2.83±7.34 | 7.16±11.25 | 5.08±6.56 | 2.42±5.74 |
| Polyarthra vulgaris | 9.08±13.23 | 2.08±5.82 | 7.66±11.09 | 8.08±13.39 |
| Gastropus stylifer | 2.25±4.76 | 9.33±16.69 | 6.0±14.60 | 3.46±8.438 |
| Filinia longiseta | 3.0±6.80 | 8±16.14 | 18.5±17.55 | 4.33±11.16 |
| Filinia terminalis | 2.92±6.56 | 2.25±7.628 | 7.08±13.09 | 2.83±8.92 |
| Philodina roseola | 4.58±9.24 | 3.83±11.15 | 5.25±10.53 | 4.17±8.88 |
| Testudinella sp | 3.25±9.19 | 14.33±19.30 | 6.08±12.86 | 4.75±9.46 |
| Asplanchna priodonta | 1.25±4.33 | 2.33±6.69 | 0 | 3.0±7.413 |
Mean± SD | 3.88±3.24 | 6.39±3.90 | 7.6±5.15 | 6.36±4.73 |
Zooplankton diversity
Anchar Lake's zooplankton community structure was estimated using Shannon-Wiener diversity (H), Simpson's index (1-D), Margalef's richness (MD), and Pielou's evenness index (J), among others. The Shannon-Weiner index is most widely used in ecology and is expected to measure species abundance and evenness 84-86. In the present study, the results revealed some variations in the diversity indices between the different sites and seasons (Figs. 6 & 7). The Simpson index values of Cladocera were found highest at site-A2 (0.884±0.027) and for Rotifera, the highest value was observed at site-A4 (0.84±0.04). The higher value of the Shannon-Wiener index for Cladocera was recorded at site-A2 (2.3±0.21) and for Rotifera, it was recorded at site-A4 (1.99±0.03). The Pielou’s evenness index values of Cladocera were found highest at site-A1 (0.93±0.03) and for Rotifera, the highest value was observed at site-A2 (0.93±0.05). The higher value of the Margalef’s index for Cladocera was recorded at site-A3 (1.74±0.26) and for Rotifera, it was recorded at site-A4 (1.37±0.37). There was no significant difference in diversity between the sites in Anchar Lake. However, the distribution of zooplankton species was unequal in different sites due to the effect of dominating species. The seasonal distribution and diversity of the zooplankton community are presented in Figs. 8 & 9, wherein, the higher value of the Shannon diversity index for Cladocera was recorded in spring as 2.63±0.2 and the highest value for Rotifera was recorded in summer (2.54±0.28), whereas the lowest for Cladocera and Rotifera was recorded in winter 1.55±0.45 and 1.47±0.54 respectively. A higher diversity value in spring and summer indicates the power of resilience and ecosystem stability in the lake due to the behavior of zooplankton living in adjacent colonies. In the winter season, the zooplankton community was more uneven as compared to other seasons which means that the community is not stable. Additionally, changes in physicochemical characteristics, especially in water temperature may have an impact on the population structure of these organisms by altering biological processes including survival, growth, and reproduction rates. Imoobe and Adeyinka (2009) 87 have found higher richness and abundance of zooplankton at vegetative sites and related it to greater availability of detritus as well as protection from predation. In water quality research, diversity indices are employed to know the effect of pollution on species abundance, and diversity 88.
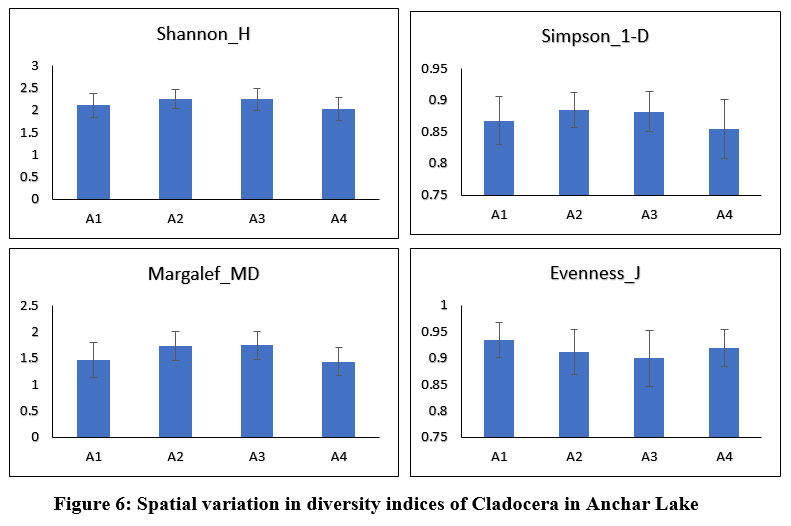 | Figure 6: Spatial variation in diversity indices of Cladocera in Anchar Lake
|
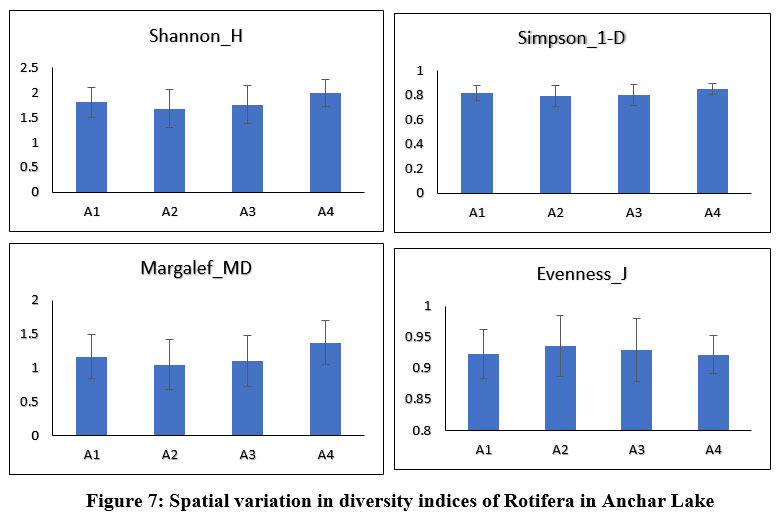 | Figure 7: Spatial variation in diversity indices of Rotifera in Anchar Lake
|
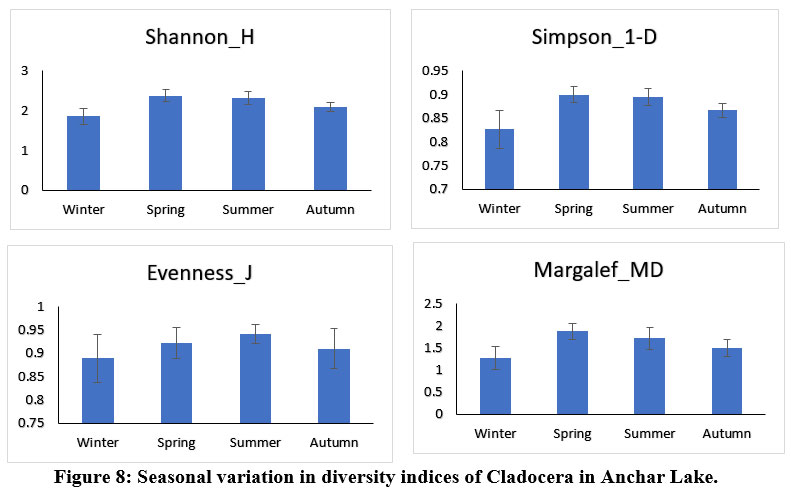 | Figure 8: Seasonal variation in diversity indices of Cladocera in Anchar Lake.
|
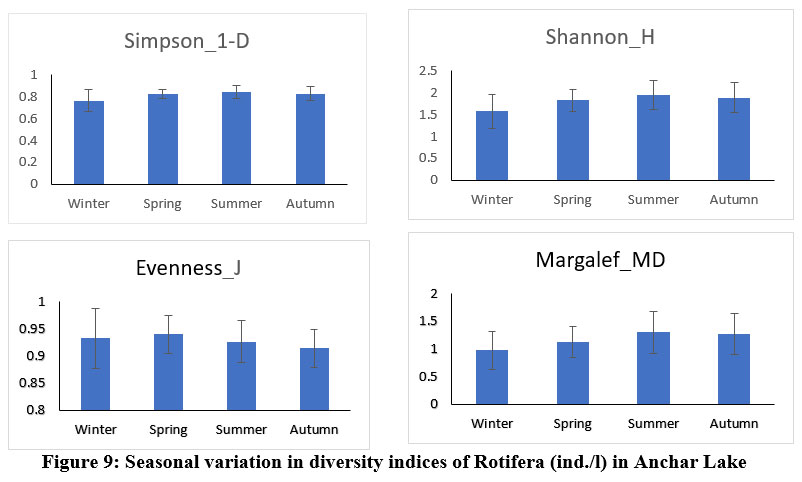 | Figure 9: Seasonal variation in diversity indices of Rotifera (ind./l) in Anchar Lake
|
Correlation between physicochemical parameters and zooplankton
Zooplanktons are an essential component, and their study in conjunction with other biotic components is an essential method for determining the lake's trophic status. The overall descriptive analysis of the correlation between the zooplankton and physicochemical parameters is presented in Table 8, wherein, both Cladocera and Rotifera showed a significant positive correlation (p < 0.01; r > 0.5) with AT, WT whereas they revealed a significant negative correlation (p < 0.01; r > 0.5) with Cl-, NO2-N and TP. Individually, Cladocera showed a significant negative correlation (p < 0.01; r > 0.5) with EC, TA, Cl-, D.O, FCO2, NO2-N, and TP while the Rotifera showed a significant negative correlation (p < 0.01; r > 0.5) with Cl-, NO2-N and TP. Temperature appears to be the single most critical physicochemical parameter that affects zooplankton populations 89,90. Many researchers also found a positive correlation between temperature and rotifers 91-93. Wheel animalcules and water fleas had a negative connection with dissolved oxygen in the current research. According to Rutner-Kolisko (1974) 94, the majority of rotifers are detritus feeders and can survive in low-oxygen environments. Chittapun et al. (2007) 95 observed that rotifers had a negative connection with dissolved oxygen and total hardness, which is in line with the present results. The present study supports the claims made by Saler and Sen (2002) 96, which suggest that water fleas can tolerate low dissolved oxygen concentrations. Additionally, the zooplankton population continued to exhibit a negative connection between total alkalinity and free carbon dioxide 97,98. The above statements are in concordance with our findings regarding the correlation between zooplankton and physicochemical parameters.
Table 8: Correlation coefficient (r) between the zooplankton groups and physicochemical parameters in Anchar Lake
Parameters | Zooplankton taxonomic groups | |
Cladocera | Rotifera | |
Air Temperature (oC) | .826** | .573** |
Water Temperature (oC) | .802** | .591** |
Transparency (m) | .385** | 0.007 |
Conductivity (µs/cm) | -.267** | -0.1 |
Total Alkalinity (mg/l) | -.401** | -0.162 |
pH value (units) | .312** | 0.178 |
Chloride (mg/l) | -.689** | -.541** |
Total Hardness (mg/l) | 0.014 | 0.043 |
Dissolved Oxygen (mg/l) | -.491** | -.252* |
Free CO2 (mg/l) | -.524** | -.254* |
Nitrite–Nitrogen (µg/l) | -.542** | -.369** |
Nitrate–Nitrogen (µg/l) | -0.184 | -0.177 |
Total Phosphorus (µg/l) | -.358** | -.525** |
*Correlation is significant at the 0.05 level (2-tailed)- reflects the confidence level is 95%
**Correlation is significant at the 0.01 level (2-tailed)-reflects the confidence level is 99%
Conclusion
The current investigation revealed that Anchar Lake has deteriorated significantly over time, resulting in a deterioration of its water quality.
In addition to the distribution and diversity of zooplankton species, physicochemical parameters show a significant influence on the water quality of Anchar Lake. Temperature, nutrients, chloride, and free carbon dioxide have a major impact on the composition, distribution, abundance, and richness of zooplankton species. Furthermore, the maximum abundance of Rotifera at all sites is suggestive of a eutrophic state of the Anchar Lake. The maximum Shannon-Wiener diversity index was observed for Cladocera at site-A2 & for Rotifera at site-A4 throughout the spring and summer seasons respectively indicating the existence of abundant food material such as algae and macrophytes in the lake. Moreover, the presence of high content of nutrients in the lake has adversely prompted the process of eutrophication through excessive growth of macrophytes and unchecked disposal of garbage and medical wastes have degraded the ecology of the lake. Despite many treatment plans made to limit pollution by the concerned authorities (J and K Lake Conservation and Management Authority (LCMA), no efforts have been taken to safeguard the lake. The current study provides information about the detrimental threats to the water quality and the productivity of Anchar Lake. The current status of the lake focuses on the requirement of management aspects and the need of national importance for protection under strict guidelines from concerned government agencies.
Acknowledgment
The authors are grateful to the Head of, the Department of Zoology, University of Kashmir, for providing necessary laboratory facilities, Science and Engineering Research Board, Department of Science and Technology, Government of India (File No. EMR/2017/003669) for funding that made possible to set up the laboratory where this work was carried out. The authors would also like to thank Dr. Bikram Singh, Professor and Head of the Department of Earth Sciences at the University of Kashmir, who has supported the authors by providing resources for the creation of the map.
Conflict of Interest
The authors have no conflict of interest.
Funding Sources
The authors are grateful to the Head of, the Department of Zoology, University of Kashmir, for providing necessary laboratory facilities, Science and Engineering Research Board, Department of Science and Technology, Government of India (File No. EMR/2017/003669) for funding that made possible to set up the laboratory where this work was carried out.
References
- Khanna D, Sarkar P, Gautam A, Bhutiani R. Fish scales as bio-indicator of water quality of River Ganga. Environmental Monitoring and Assessment. 2007;134(1):153-160.
- Mir R A, Jeelani G, Dar FA. Spatio-temporal patterns and factors controlling the hydrogeochemistry of the river Jhelum basin, Kashmir Himalaya. Environmental Monitoring and Assessment. 2016; 188: 1-24.
- Mahananda H, Mahananda M, Mohanty B. Studies on the physico-chemical and biological parameters of a freshwater pond ecosystem as an indicator of water pollution. Ecology Environment and Conservation. 2005;11(3/4):537.
- Ghosh B, Basu A. Observations on estuarine pollution of the Hooghly by the effluents from a chemical factory complex at Rishra, West Bengal (India). Envir Hlth India. 1968;10:204-218.
- Gupta S, Shukla D. Physico-chemical analysis of sewage water and its effect on seed germination and seedling growth of Sesamum indicum. J Res Natl Dev. 2006;1:15-19.
- Patil DB, Tijare RV. Studies on water quality of Gadchiroli lake. Pollution Research. 2001;20(2):257-259.
- Singh R, Mathur P. Investigation of variations in physico-chemical characteristics of a fresh water reservoir of Ajmer city, Rajasthan. Indian Journal of Environmental Sciences. 2005;9(1):57-61.
- Jeelani M, Kaur H, Kumar R. Impact of Climate Warming on the Biodiversity of Freshwater Ecosystem of Kashmir, India. 2008:1109.
- Kumar A, Mandal K, Kumar A. Water pollution scenario in some lentic and lotic freshwater ecosystems of Jharkhand, India. Water Pollution, APH Publishing Corporation, New Delhi. 2004:1-34.
- Lampert W, Sommer U. Limnoecology: the ecology of lakes and streams. Oxford university press; 2007.
- Anas MM, Meegahage BJ, Evans MS, Jeffries DS, Wissel B. Scale-dependent effects of natural environmental gradients, industrial emissions and dispersal processes on zooplankton metacommunity structure: implications for the bioassessment of boreal lakes. Ecological Indicators. 2017;82:484-494.
- Valois AE, Keller WB, Ramcharan CW. Recovery in a multiple stressor environment: using the reference condition approach to examine zooplankton community change along opposing gradients. Journal of Plankton Research. 2011;33(9):1417-1429.
- Pinel-Alloul B, Patoine A, Marty J. Multi-scale and multi-system perspectives of zooplankton structure and function in Canadian freshwaters. Canadian Journal of Fisheries and Aquatic Sciences. 2021;78(10):1543-1562.
- Ferrara O, Vagaggini D, Margaritora FG. Zooplankton abundance and diversity in lake Bracciano, Latium, Italy. Journal of Limnology. 2002;61(2):169-175.
- Jeppesen, E., P. Noges, T. A. Davidson, J. Haberman, T. Noges, K. Blank, T. L. Lauridsen, M. Søndergaard, C. Sayer & R. Laugaste, 2011. Zooplankton as indicators in lakes: a scientific-based plea for including zooplankton in the ecological quality assessment of lakes according to the European Water Framework Directive (WFD). Hydrobiologia 676(1):279-297.
- Kehayias G, Chalkia E, Doulka E. Zooplankton variation in five Greek lakes. Zooplankton. 2014:85-119.
- Preston ND, Rusak JA. Homage to Hutchinson: does inter-annual climate variability affect zooplankton density and diversity? Fifty years after the ‘‘Homage to Santa Rosalia’’: Old and new paradigms on biodiversity in aquatic ecosystems. Springer; 2010:165-177.
- Manickam N, Bhavan PS, Santhanam P, Bhuvaneswari R, Muralisankar T, Srinivasan V, Asaikkutti A, Rajkumar G, Udayasuriyan R, Karthik M. Impact of seasonal changes in zooplankton biodiversity in Ukkadam Lake, Coimbatore, Tamil Nadu, India, and potential future implications of climate change. The Journal of Basic and Applied Zoology. 2018;79:1-10.
- Caroni R, Irvine K. The potential of zooplankton communities for ecological assessment of lakes: redundant concept or political oversight? Royal Irish Academy; 2010:35-53.
- Jose EC, Furio EF, Borja VM, Gatdula NC, Santos MD. Zooplankton composition and abundance and its relationship with physico-chemical parameters in Manila Bay. Oceanography: Open Access. 2015;2015
- Shivashankar P, Venkataramana G. Zooplankton diversity and their seasonal variations of Bhadra reservoir, Karnataka, India. International Research Journal of Environment Sciences. 2013;2(5):87-91.
- Abubakr A, Balkhi M. Trophic status assessment of Anchar Lake, Kashmir. Journal of Pharmacognosy and Phytochemistry. 2018;7(4):1154-1156.
- Showqi I, Lone FA, Naikoo M. Preliminary assessment of heavy metals in water, sediment and macrophyte (Lemna minor) collected from Anchar Lake, Kashmir, India. Applied Water Science. 2018;8(3):1-11.
- Environment Services and Research Organization. Database of Kashmir Environment (2007).
- APHA S. Methods for the Examination of Water and Wastewater 23rd Ed., 2017 American Public Health Association Washington. DC, USA. 2017;
- Edmondson W, Ward HB, Whipple GC. Fresh-water biology. John Wiley & Sons; 1959.
- Pennak R. Fresh-water invertebrates of the United States. Keys to genera of Turbellaria. Wiley, Nueva York; 1978.
- Welch PS. Limnological methods. McGraw Hill Books Co. Inc. New York; 1948.
- Shannon C, Weaver W. The Mathematical Theory of Communication. Urbana (Illinois): Univ. of Illinois Press. 1963;
- Simpson EH. Measurement of diversity. nature. 1949;163(4148):688-688.
- Clifford H, Stephenson W. An introduction to numerical classification. Academic Press; 1975.
- Pielou EC. The measurement of diversity in different types of biological collections. Journal of theoretical biology. 1966;13:131-144.
- Chowdhury SH, Mazumder A. Limnology of lake Kaptai. I. Physicochemical features. Bangladesh Journal of Zoology. 1981; 9(1): 52-59.
- Zutshi D, Vass K. High altitude lakes of Kashmir. Ichthiologica. 1970;10:12-15.
- Zutshi D, Vass K. Limnological studies on Dal lake-chemical features [India]. Indian Journal of Ecology (India). 1978; 5(1): 90-97.
- Zutshi D, Subla B, Khan M, Wanganeo A. Comparative limnology of nine lakes of Jammu and Kashmir Himalayas. Hydrobiologia. 1980;72(1):101-112.
- Yousuf A, Balkhi MH, Qadri M. Limnological features of a forest lake of Kashmir. J Zool Soc India. 1986;38(1&2):29-42.
- Yeole S, Patil G. Physico-chemical status of Yedshi Lake in relation to water pollution. J Aqua Biol. 2005;20(1):41-44.
- Cole GA. Contrasts among calanoid copepods from permanent and temporary ponds in Arizona. American Midland Naturalist. 1966:351-368.
- Kinnear A, Garnett P. Yellagonga Regional Park, Western Australia. Journal of the royal society of Western Australia. 1999;82:79-85.
- Nasar S, Datta-Munshi J. Studies on primary production in a freshwater pond. Japanese Journal of Ecology. 1975;25(1):21-23.
- Otsuki A, Wetzel RG. Calcium and total alkalinity budgets and calcium carbonate precipitation of a small hard-water lake. Archiv für Hydrobiologie. 1974:14-30.
- Goldman CR, Horne AJ. Limnology. McGraw-Hill; 1983.
- Wani I, Subla B. Physico-chemical features of two shallow Himalayan lakes. Bull Environ Sci. 1990;8:33-49.
- Trisal C. Ecology and conservation of Dal Lake, Kashmir. International journal of water resources development. 1987;3(1):44-54.
- Anitha G, Chandrashekhar S, Kodarkar M. Seasonal variations of macrozoobenthos in Mir Alam Lake, Hyderabad (AP). J Aqua Biol. 2004;19(1):61-68.
- Freimuth P. Physicochemical conditions and larval Chironomidae (Diptera) of an urban pond. 1994:11-16.
- Thomas E. Empirische und experimentelle Untersuchungen zur Kenntnis der Minimumstoffe in 46 Seen der Schweiz und angrenzender Gebiete. Schweiz Ver Gas-& Wasserfachmänner, Monatsbull. 1953;9(10):1-11.
- Singh S, Pathak D, Singh R. Hydrobiology of two water bodies ie Jagatdev and Narayan ponds of Satna (MP). Ecol Environ Conserv. 2002;8:289-292.
- Hynes H. The biology of polluted waters. Liverpool. Univ Press. 1960;
- Morrissette DG, Mavinic DS. BOD test variables. Journal of the Environmental Engineering Division. 1978;104(6):1213-1222.
- Moss B. Studies on Gull Lake, Michigan. Freshwater Biology. 1972;2(4):289-307.
- Dokulil MT, Jagsch A, George GD, et al. Twenty years of spatially coherent deepwater warming in lakes across Europe related to the North Atlantic Oscillation. Limnology and Oceanography. 2006;51(6):2787-2793.
- Qadri M, Naqash SA, Shah GM, Yousuf A. Limnology of two trout streams of Kashmir. Journal of the Indian Institute of Science. 1981;63(8):137.
- Qadri M, Yousuf A. Seasonal variation in the physico-chemical factors of a subtropical lake in Kashmir. J Inland Fish Soc India. 1978;10:89-96.
- Kushlan JA, Hunt BP. Limnology of an alligator pond in South Florida. Florida Scientist. 1979:65-84.
- Jai Prakash N. Studies on ground water quality of Magadi taluk Bangalore rural district Karnataka. 2004;
- Saleem M, Iqbal J, Akhter G, Shah MH. Spatial/temporal characterization and risk assessment of trace metals in Mangla Reservoir, Pakistan. Journal of Chemistry. 2015;2015
- Sawyer, C., 1960. Chemistry for Sanitary Engineers McGraw-Hill Book Company. Inc, New York.
- Pandey J. Microbial biomass flatland water interface and its role in regulating ecosystem properties of a freshwater dry tropical woodland lake. J Environ Biol. 2008;29:333-337.
- Paul E, Clark F. Soil microbiology and biochemistry. Academic Press, San Diego. Soil microbiology and biochemistry 2nd ed Academic Press, San Diego. 1996:-.
- Stanley DW, Hobble JE. Nitrogen recycling in a North Carolina coastal river 1. Limnology and Oceanography. 1981;26(1):30-42.
- Kumar R, Pandit A K. Physico-chemical characteristics of water in Hokerser wetland in Kashmir Himalaya. Pollut Res 2007; 26(4):73-79.
- Kaul S, Trisal C. L. Chemical and physical characteristics of some wetland waters of Kashmir. Acta hydrochimica et Hydrobiologica 1984; 12(2):137-144.
- Catalan J, Ballesteros E, Gacia E, Palau A, Camarero L. Chemical composition of disturbed and undisturbed high-mountain lakes in the Pyrenees: a reference for acidified sites. Water research. 1993;27(1):133-141.
- Rabalais NN, Nixon SW. Nutrient over-enrichment in coastal waters: Global patterns of cause and effect. Lawrence KS; 2002.
- Hutchinson GE. A Treatise on Limnology. 1957;1:243.
- Kaul V, Fotedar D, Pandit A, Trisal C. A comparative study of plankton populations in some typical fresh waterbodies of Jammu and Kashmir State. Environmental Physiology and Ecology of Plants. 1978:249-269.
- Bhat S, Rather S, Pandit A. Impact of effluent from Sheri-Kashmir Institute of Medical Sciences (SKIMS), Soura on Anchar Lake. J Res Dev. 2001;1:30-37.
- Dadhich N, Saxena M. Zooplankton as indicators of trophic status of some desert waters near Bikaner (NW Rajasthan). Journal of Environment and Pollution. 1999;6(4):251-254.
- Murugan N, Murugavel P, Kodarkar M. Cladocera. Indian Association of Aquatic Biologist. Hyderabad. 1998;5:1-55.
- Sinha B, Islam M. Seasonal variation in zooplankton population of two lentic bodies at Assam State Zoo cum Botanical Garden, Guwahati, Assam. Ecology Environment and Conservation. 2002;8:273-278.
- Contreras JJ, Sarma S, Merino-Ibarra M, Nandini S. Seasonal changes in the rotifer (Rotifera) diversity from a tropical high altitude reservoir (Valle de Bravo, Mexico). Journal of Environmental Biology. 2009;30(2):191-195.
- Zutshi D, Vass K. Limnological studies on dal lake, Srinagar. III: Biological features. Proceedings of the Indian National Science Academy, (B) 1982;48
- Dede A, Deshmukh A. Study on zooplankton composition and seasonal variation in Bhima river near Ramwadi village, Solapur District (Maharashtra), India. Int J Curr Microbiol App Sci. 2015;4(3):297-306.
- Mishra A, Mukherjee A, Tripathi B. Seasonal and temporal variations in physico-chemical and bacteriological characteristics of River Ganga in Varanasi. 2009;
- Bozkurt A, Guven SE. Zooplankton composition and distribution in vegetated and unvegetated area of three reservoirs in Hatay, Turkey. Journal of Animal and Veterinary Advances. 2009;8(5):984-994.
- Breitburg DL. Are three-dimensional structure and healthy oyster populations the keys to an ecologically interesting and important fish community. Oyster reef habitat restoration: a synopsis and synthesis of approaches Virginia Institute of Marine Science Press, Gloucester Point, Virginia. 1999:239-250.
- Saunders PA, Porter KG, Taylor BE. Population dynamics of Daphnia spp. and implications for trophic interactions in small, monomictic lake. Journal of Plankton Research. 1999;21(10)
- Sendacz S. A study of the zooplankton community of Billings Reservoir—São Paulo. Hydrobiologia. 1984;113(1):121-127.
- Saksena D. Rotifers as indicators of water quality. Acta hydrochimica et hydrobiologica. 1987;15(5):481-485.
- Sládecek V. Rotifers as indicators of water quality. Hydrobiologia. 1983;100(1):169-201.
- Ahmad U, Parveen S, Khan A, Kabir H, Mola H, Ganai A. Zooplankton population in relation to physico-chemical factors of a sewage fed pond of Aligarh (UP), India. Biology and Medicine. 2011;3(2):336-341.
- Buzas MA, Hayek L-AC. Biodiversity resolution: an integrated approach. Biodiversity Letters. 1996:40-43.
- Javaid AS, Ashok K. Application of diversity indices to crustacean community of Wular Lake, Kashmir Himalaya. International Journal of Biodiversity and Conservation. 2013;5(6):311-316.
- Melo AS. What do we win'confounding'species richness and evenness in a diversity index? Biota Neotropica. 2008;8(3)
- Imoobe T, Adeyinka M. Zooplankton-based assessment of the trophic state of a tropical forest river in Nigeria. Archives of Biological Sciences. 2009;61(4):733-740.
- Archibald R. Diversity in some South African diatom associations and its relation to water quality. Water Research. 1972;6(10):1229-1238.
- Edmondson W. Reproductive rate of planktonic rotifers as related to food and temperature in nature. Ecological Monographs. 1965;35(1):61-111.
- Gulati R, Ooms-Wilms A, Van Tongeren O, Postema G, Siewertsen K. The dynamics and role of limnetic zooplankton in Loosdrecht lakes (The Netherlands). Hydrobiologia. 1992;233(1):69-86.
- Schöll KN, Kiss A. Spatial and temporal distribution patterns of zooplankton (Rotifera, Cladocera, Copepoda) in the water bodies of the Floodplain Gemenc (Duna-Dráva National Park, Hungary). Oposcula Zoologica (BUDAPEST). 2008;39:65-76.
- Sulehria AQK, Qamar MF, Anjum R, Ejaz M, Hussain A. Seasonal fluctuations of Rotifers in a fish pond at District Bahawalnagar, Pakistan. Biologia (Pakistan). 2009;55(1&2):21-28.
- Sulehria AQK, Qamar MF, Haider S, Ejaz M, Hussain A. Water quality and Rotifer diversity in the fish pond at District Mianwali Pakistan. Biologia (Pakistan). 2009;55(1&2):79-85.
- Rutner-Kolisko A. Planktonic rotifers: Biology and taxonomy, Biological Station Lunz of the Austrian Academy of Science. E. E SchweizerbartscheVerlagsbuchhandlung. 1974;
- Chittapun S, Pholpunthin P, Segers H. Diversity of rotifer fauna from five coastal peat swamps on Phuket Island, Southern Thailand. ScienceAsia. 2007;33:383-387.
- Saler S, Sen D. Seasonal Variation of Rotifera Fauna of Cip Dam Lake (Elazig-Turkey). Pakistan Journal of Biological Sciences. 2002;5(11):1274-1276.
- Kumar Dutta T, Patra BC. Biodiversity and seasonal abundance of Zooplankton and its relation to physico–chemical parameters of Jamunabundh, Bishnupur, India. International Journal of Scientific and Research Publications. 2013;76
- Mustapha MK. Seasonal influence of limnological variables on plankton dynamics of a small, shallow, tropical African reservoir. Asian Journal of Experimental Biological Sciences. 2010;1(1):60-79.


