Ambient air quality status of Nizam Deccan Sugar Factory at Bodhan, Andhra Pradesh
D. Dasharath1 *
1
Department of Chemistry,
Giriraj Government College,
Nizamabad,
503 002
India
http://dx.doi.org/10.12944/CWE.1.1.04
The air pollution causes serious problem all over the world. It deteriorates the quality of environment due to the presence of impurities or pollutants. Air pollution not only affects the mankind, but also affects the natural habits and environments of the plants and animals. The present study was taken up to measure, SPM / RPM and to estimate the concentration of NOx, and SO2 in ambient air at Nizam Deccan Sugar Factory, Bodhan, Andhra Pradesh. it was observed that the concentration of SPM / RPM above the standards (I.S. 5182) during crushing season of the factory and the concentration of NOx and SO2 was found below the maximum limits of the standards.
Copy the following to cite this article:
Dashrath D. Ambient air quality status of Nizam Deccan Sugar Factory at Bodhan, Andhra Pradesh. Curr World Environ 2006;1(1):23-26 DOI:http://dx.doi.org/10.12944/CWE.1.1.04
Copy the following to cite this URL:
Dashrath D. Ambient air quality status of Nizam Deccan Sugar Factory at Bodhan, Andhra Pradesh. Curr World Environ 2006;1(1):23-26. Available from: http://www.cwejournal.org/?p=507
Download article (pdf)
Citation Manager
Publish History
Introduction
Pollution of air is due to increase in industrialization, insufficient implementation of preventive measures, emission of waste gases into the air without taking adequate technical problems. Air pollution becomes one of the main problems facing by man today, which literally means spoiling the environments of living beings, climate and plant kingdom.
Nizam Deccan Sugar Factory (NDSF) is one of the major sugar factories of India. It is situated in the heart of the Bodhan town of the Nizamabad District in Andhra Pradesh. It is about 30 KM away from Nizamabad City. NDSF is a well known sugar factory established in 1938 under the then Nizam Nawab. Earlier the area under the purview of the factory for cultivation was spread over 16,000 Acres.
The main product of NDSF is sugar and alcohol from molasses.The factory uses large quantity of bagasee to generate steam, by which sufficient quantity of suspended particulates and NOx, SO2 are added in the air during the functioning of factory. This is due to adequate technical precautions.
Material and Methods
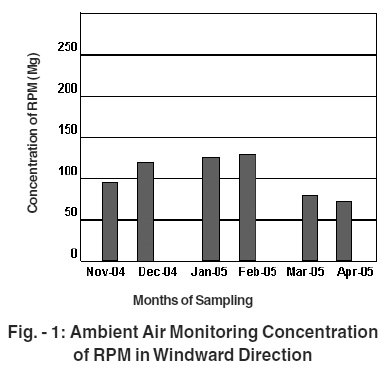 |
Figure - 1: Ambient Air Monitoring Concentration of RPM in Windward Direction Click kere to view figure |
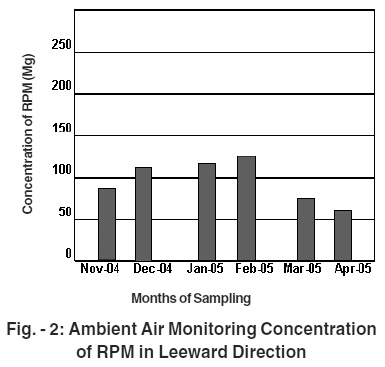 |
Figure - 2: Ambient Air Monitoring Concentration of RPM in Leeward Direction Click kere to view figure |
Air sampling carried out in windward and Leeward direction at two permanent places in NDSF campus, at about 100-150 M away from the chimney. Sampling was carried out during day time. Period of sampling was nearly eight hours. The sampling was done during crushing season (November-February) and non crushing season (March-April)of the factory. The quality standard of ambient air measured with the help of respirable dust high volume sampler Envirotech (APM 460) and Gas Sampler (APM 411).
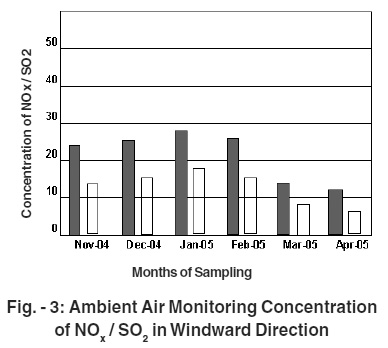 |
Figure - 3: Ambient Air Monitoring Concentration of NOx / SO2 in Windward Direction Click kere to view figure |
The respirable dust concentration(RPM) was determined by a gravimetric analysis, which required an accurate estimation of the change in weight of the filter on account of the dust deposited on it. Filter paper (Whatmann) used in high volume sampler was made of binder free glass fiber and non-hygroscopic. It was dried prior to weighment. Spectrophotometer and digital balance was used for other chemical analysis. The rate of air flow was maintained 1.1 m3 / min to 1.30 m3 / min.for SPM / RPM and for gaseous pollutants rate of air flow was maintained 1.01 lpm. The concentration of SPM/RPM in Ambient air is expressed in microgram per cubic meter of air sampled
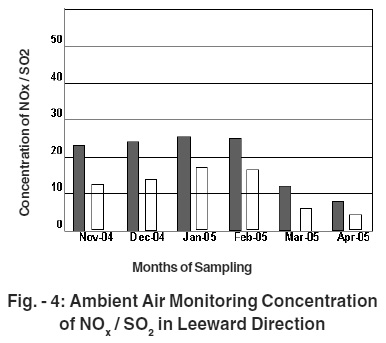 |
Figure - 4: Ambient Air Monitoring Concentration of NOx / SO2 in Leeward Direction Click kere to view figure |
The measurement of SPM / RPM is done as per the standard procedure laid down by manufacturer of high volume sampler, and IS-5182 Part – IV 1973 1 . For monitoring of NOx, Standard procedure IS-5182 Part V 1975 2 and Jacob and Hochheiser 1958 3 was followed. For monitoring SO2, standard procedure IS-5182 Part II 1969 4 and west and Grake 1956 5 method was followed.
 |
Table - 1: Ambient air monitoring concentration of rpm in windward direction Click kere to view table |
Results and Discussion
During burning of Bagasse and coal smoke is emitted through the chimney. The emission of smoke from chimney leads to change the natural air quality surrounding the factory area. The factory is surrounded by lowly populated area. The air pollution broadly due to SPM / RPM and gaseous pollutants such as NOx, SO2 and CO etc, dispersed in air. The health effects are primarily caused by respirable particulates in the size range of 0.5 to 10 Microns. As such when the main objective in Ambient air quality monitoring is to protect the local community, the measurement of Total Suspended Particulates (TSP) alone may be often, misleading. Respirable dust is a better index then TSP. Hence the investigation was carried out to estimate the Respirable Particulate matter (RPM) collected over the filter paper (Whatmann) installed in APM 460 along with other parameters such as NOx, and SO2 with gas sampler APM 411.
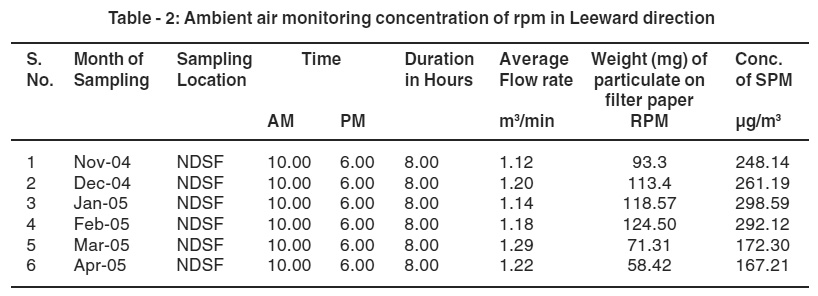 |
Table - 2: Ambient air monitoring concentration of rpm in Leeward direction Click kere to view table |
The results reveals that from Table 1, 2 and Fig 1,2 the RPM / SPM Values are found above the NAAQ Standards, EPA 1971,6 during crushing season (November – February) in Windward and Leeward directions. But with in the permissible limits in Non-crushing season (March-April). It has been estimated that over 50 % of particulates are in the range of 0.01 and 0.1mm. These particulates resulting in various respiratory problems D’ Amato 1999,7 polasa 2001,8 Takafuji and Nakagama 2000,9 D’ Amato et al 2000,10 Peden 2001,11 V.Kumar and Jain 1991.12
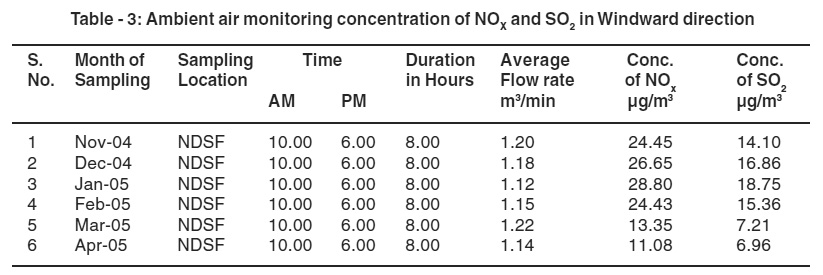 |
Table - 3: Ambient air monitoring concentration of NOX and SO2 in Windward direction Click kere to view table |
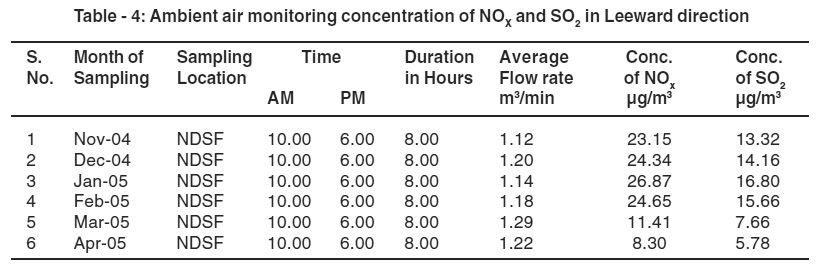 |
Table - 4: Ambient air monitoring concentration of NOX and SO2 in Leeward direction Click kere to view table |
Among the oxides of Nitrogen (NOx), Nitrogen dioxide (NO2) is considered to be most toxic. It causes various respiratory diseases because of its solubility , Patty 1963,13 Calabrese 1978.14 It is clear from Table III,and IV that the amount of NOx emitted from the chimney is below the maximum limits, Mukerjee, Biswarup1996,15 Tripathi and Panigrahi 200016. It was observed that NOx released only during the crushing season along with smoke and it is not harmful for living beings around the factory.
Sulphur dioxide is a colourless, non-explosive gas. It has a pungent smell at high concentration(at 3 ppm ) SO2 Causes effects on health, visibility and on Vegetation. It is clear from Table III,and IV that the amount of SO2 emitted from the chimney is well below standards. SO2 released only during crushing season and is under detectable limit.
Conclusions
The present study shows that the concentration of RPM / SPM is found above the standards during crushing season and within the permissible limits during non-crushing season. The concentration of NOx and SO2 is well below the standards. According to a study many people of these areas are affected by the air pollution caused due to bagasse emanating from the factory during the crushing season. The boilers belch out clouds of black smoke that engulf the areas. The houses are covered with soot and vessels lose their original colour.
The nostril becomes sooty and respiratory diseases like asthma and cough and other ailments are rampant. Children and the elderly are the worst sufferers. Hence the proper steps should be taken to reduce concentration of RPM / SPM in the exhaust coming out from the chimney of the factory in the interest of the public health.
References
- IS-5182; methods of measurement of Air Pollution, Suspended Matter. Part-IV (1973).
- IS-5182; methods of measurement of Air Pollution, Nitrogen Oxides. Part-V (1975).
- Jocob, MB and Hochheiser, Anal. Chem. (1958) 30: 426.
- IS-5182; methods of measurement of Air Pollution, Sulpher Dioxide. Part-II (1969).
- West, P.W. and Grake, G.C, ISC, Method No.42401-01-69T, Anal Chem., (1956) 28: 1816.
- Environmental Protection Agency, EPA National Primary and Secondary Ambient air quality standards Federal Register (1971) 36(84): 31-32, April.30.
- D’ Amato. G, Outdoor Air Pollution in Urban areas and allergic respiratory diseases, Monaldi Arch Chest Dis, (1999) 54(6): 470-474.
- Polasa. R, The interaction between particulate Air Pollution and allergens in enhancing allergic and airway responses, Curr Allergy Asthma (2001) 1(2): 102-107.
- Takafuji. S and Nakagama. T, Air Pollutions and allergy, J. Investig. Allergol Clin Immunol, (2000) 10(3), 123 -128.
- D’ Amato. G et al , Environmental risk factors (Outdoor Air Pollution and Climate changes) and increased trend to respiratory allergy, J. Investig, Allergol Clin. Immunol, (2000) 10(3): 123-8.
- Peden D.B., Air Pollution in Asthma; Effect of pollutants on Airway inflammation: Ann Allergy (2001).
- Vinod Kumar. A and Jain R.K., Ambient Air Quality and Health Survey of Steam Loco shed, Jabalpur. J. IPHE, INDIA, (1991) 1991(4).
- Patty F.A. and Patty G.M, J.Ind.Hug. Toxicol. (1963) 25: 361.
- Calabrese.E.J., Pollutants and high-risk groups, wiley Inter Sciences, New york (1978).
- Mukerjee;Biswarup,pollution an the Indian Scenaro, In Environmental Biology, Tata Mc.Graw Hill Publishing Company Limited, New Delhi; (1996) 487-501.
- Tripathi A.K and Panigrahi, G.P. Assessment of air pollution due to SPM, NOx ,SO2 at IRE Ltd. Oscom Environment , IJEP, (2000) 20(12): 901-905.


