A Study on Urban Heat Island (UHI): Challenges and Opportunities for Mitigation
Anita Yadav
*
 and Jaswant Singh
1
Department of Environmental Sciences,
Dr. Ram Manohar Lohia Avadh University,
Ayodhya,
Uttar Pradesh
Copy the following to cite this article:
Yadav A, Singh J. A Study on Urban Heat Island (UHI): Challenges and Opportunities for Mitigation. Curr World Environ 2024;19(1).
Copy the following to cite this URL:
Yadav A, Singh J. A Study on Urban Heat Island (UHI): Challenges and Opportunities for Mitigation. Curr World Environ 2024;19(1).
Citation Manager Publish History

Introduction
Urban heat island (UHI) occurs when urban areas are warmer than their rural surroundings. Air pollution and smog levels rise, thermal comfort drops, and building energy consumption rises because of this effect. Urbanization, characterized by the expansion of buildings, impervious surfaces, and the introduction of human-generated heat, constitutes the principal factor of Urban Heat Island (UHI)1. When the urban thermal environment changes, it affects the urban energy balance and causes phenomena like UHIs and midsummer heatwaves2. The emergence of the UHI phenomenon is influenced by several factors. These factors encompass diminished availability of natural sunlight, utilization of highly efficient insulating materials, surplus heat generated by human activities, insufficient evaporation, and restricted convection. The growing number of economic activities that rely significantly on fossil fuels and the subsequent rise in global population has contributed to the phenomenon of urbanization, which has recently grown more common on a worldwide scale. The environmental impacts of this trend toward urbanization are evident in problems such as the depletion of freshwater resources and the release of greenhouse gases (GHGs)3. When UHI first appears, it is influenced by several factors. These factors encompass diminished availability of natural sunlight, utilization of highly efficient insulating materials, surplus heat generated by human activities, insufficient evaporation, and restricted convection. When determining the temperature in specific areas, various factors including sky view factor, land surface type, building ventilation, and urban canopy are considered to have an impact on UHI4. The UHI phenomenon has extended its influence on various cities in India, resulting in alterations in weather conditions within the surrounding rural regions because of the growing urban population5. Understanding and addressing the causes of UHI is essential for mitigating its detrimental impacts in urban environments. Implementing various strategies such as urban planning and design interventions, green infrastructure, cool roofs, and pavement technologies, as well as policies that encourage sustainable urban development can be instrumental in mitigating UHI. Furthermore, adopting renewable energy sources and incorporating low-carbon urban practices to decrease greenhouse gas (GHG) emissions can also significantly minimize UHI effects and foster sustainable urban environments. To mitigate the effects of UHI across Indian cities and elsewhere, ongoing study, monitoring, and the implementation of appropriate interventions are crucial. Figure 1 depicts the UHI detection.
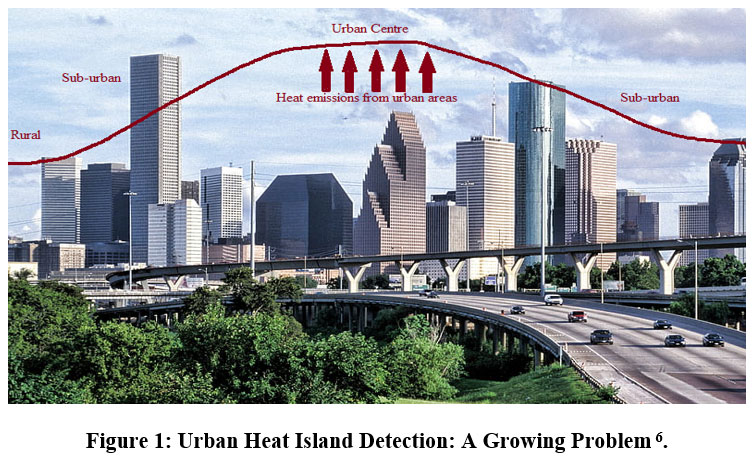 | Figure 1. Urban Heat Island Detection: A Growing Problem 6.
|
Many people are directly and indirectly impacted by the UHI phenomenon in urban areas. With the growth of cities around the world, the UHI has emerged as a human-caused component of global warming7. Numerous investigations have been carried out to examine UHI, employing temperature data collected from both ground-based measurements and satellites. The article summarizes the theory behind UHI and highlights how different studies have used processing techniques and data from satellites to obtain LST as proof of UHI. Data shows that there are a lot of moving parts when it comes to using remote sensing for UHI studies. Remote sensing, however, can provide reliable LST readings, allowing for the regional characterization of UHI. Africa has received scant attention from the field of UHI remote sensing, in contrast to Asia, Europe, and the Americas. One possible way to better understand UHI is to use remote sensing more often. With the help of accurate and current UHI assessments derived from remote sensing, urban managers and planners can tackle the difficulties linked to this phenomenon8. When it comes to managing and planning cities, remote sensing data is essential. These insights are instrumental in formulating effective approaches to combat the adverse effects of UHI phenomena. Examples of such strategies include the incorporation of green spaces, cool roofs, and other urban design interventions.
Additional exploration of remote sensing in areas that have been poorly studied can enhance the comprehension of UHI patterns and consequences. This, in turn, can facilitate informed decision-making in urban planning and policy formulation. By incorporating remote sensing data into UHI investigations, it can develop more efficient approaches and actions to alleviate the negative effects of UHI in cities. This will ultimately have positive impacts on both the environment and the overall welfare of urban residents.
UHI Definition and Classification
The Development of urban heat islands in India.
When urban temperatures persistently rise above those of surrounding rural areas, this phenomenon is known as the UHI effect. The presence of UHI is commonly gauged through the UHI Intensity (UHII) indicator, which quantifies the temperature contrast between urban and rural areas. Researchers have employed diverse time frames, spanning from a few days to several decades, to examine and evaluate the UHI phenomenon.
There are two primary varieties of UHI AHIs (located in the atmosphere) and SHIs (found on the ground). The study of SHI primarily relies on thermal satellite imaging, Geographic Information System (GIS), and remote sensing technologies, which aid in detecting changes in the environment and formulating appropriate strategies. By utilizing GIS data and climate maps, it is possible to predict future weather patterns. By providing a novel modeling option, the GIS development has helped decision-makers explore and design new approaches to a wide variety of waste management problems. Among the most likely methods to streamline the organizing and handling of solid waste is using GIS data. Unlike AHI, which is more prevalent during nighttime, SHI is consistently present throughout the day. AHI levels are measured using fixed weather stations and mobile platforms, and both computational and experimental investigations are increasingly focused on understanding AHI. It can be further divided into two subtypes: both BLHIs and CLHIs or boundary- and canopy-layer heat islands. These hot spots develop between surfaces of varying roughness and spread downwards to a level below the roof.
Roughly 30% of published works concentrate exclusively on AHI (Artificial Heat Island), whereas the remaining 70% examine LST (Land Surface Temperature) and ST (Surface Temperature), specifically exploring Surface Heat Island phenomena. A summary of the duration of UHI (Urban Heat Island) studies and the temperature variables employed to define UHI can be found in Table 1, while Table 2 provides an overview of UHI intensity levels, and the research approach utilized to measure UHI.
Table 1: Comparative Analysis of Study Durations for Urban Heat Island Phenomenon
Ref [] | Study Period | Duration | Variable |
Mohan, M. et al. (2011) 9 | 1968-2005 | 37 years | AT |
Swain, D. et al. (2016)10 | 2000-2014 | 15 years | LST |
Babazadeh, M., and Kumar, P. (2015)11 | 2000-2014 | 14 years | LST |
Kikon, N. et al. (2016)12 | 2000-2013 | 13 years | LST |
Kumar, R. et al. (2017)13 | 2003-2014 | 12 years | LST |
Amirtham, L. R. (2016)14 | May 2008 to Jan 2009 | 9 months | AT |
Pandey, P. et al. (2012)15 | Nov and Dec of 2007-2010 | 8 months | ST |
Borbora, J., and Das, A. K. (2014)16 | May-Oct 2009 | 6 months | AT |
Shastri, H. et al. (2017)17 | Mar-May and Dec-Feb | 6 months | LST |
Chakraborty, T. et al. (2017)18 | Apr-Sept 2014 | 6 months | LST, AT |
Sharma, N., and Pandey, P. (2015)19 | Feb-Apr 2015 | 3 months | ST |
Aslam, M. Y. et al. (2017)20 | May and Dec 2013 | 2 months | AT |
Baby, M. M., and Arya, G. (2016)21 | Oct 2015 | 1 month | AT |
Deosthali, V. (2000)22 | Apr 1970 | 1 month | AT |
Kumar, K. S. et al. (2017)23 | May 2016 | 1 month | LST |
Kannamma, D., and Meenatchi Sundaram, A. (2015)24 | May 2014 | 1 day | PET |
Mehrotra, S. et al. (2018)25 | 26 Oct 2016 | 1 day | ST |
The abbreviations LST, AT, ST, and PET stand for the respective Land, Air, Surface, and Physiological Equivalent temperatures, respectively.
Table 2: UHI: Exploring the Components and Definition of an Environmental Phenomenon
Location | Year of UHI study | UHI (oC) | The Formula for Determining UHI |
Delhi26 | 2006 | 9 | The mean values were calculated for the highest and lowest LST recorded across four distinct profiles encompassing both the urban city center and the surrounding rural areas. |
Delhi16 | 2007-2010 | 4-7 | Delhi's monthly surface temperature is compared to that of the surrounding rural areas throughout several years. |
Delhi27 | 2008 | 8.3 | The temperature range observed at any of the micrometeorological stations within the research area during a specific period (day) is the disparity between the highest and lowest recorded temperatures. |
Delhi21 | 2013 | 2.2 | The difference in average monthly temperatures between cities and the corresponding rural areas throughout the given months. |
Kochi28 | 2011-2013 | 4.6 | A comparison was made between the surface air temperatures in urban and rural areas that are situated next to each other. |
Ernakulam22 | 2015 | 6 | Urban and semi-urban areas exhibit disparities in the maximum temperature experienced throughout the day.
|
Chennai15 | 2008-2009 | 4.1 | Distinct daily and seasonal temperature differences between urban and rural areas. |
Bangalore29 | 2000-2003 | 1-7 | The average temperatures vary significantly between the downtown area and the newly developed region. |
Visakhapatnam30 | 2006 | 2-4 | The surface temperature of the city was measured and used to generate isotherms, which were then employed to compare the hot central area of the city with the rest of the city. |
Ahmedabad31 | 2003-2014 | 1.93 | The temperature variation within a 10-kilometer radius around the city's specific location. |
The Development of urban heat islands in India
Urbanization in India has led to a significant issue of elevated ground-level air temperatures in numerous cities. The expansion of cities plays a pivotal role in this problem. The size of cities directly influences the local climate and its subsequent development. The detrimental effects are caused by various factors, including air pollution and the heat generated by human activities such as industrial operations and vehicular emissions. Furthermore, alterations in the city's structure and the resulting impact on air quality also contribute to the instability of urban climates 32.
This paper incorporates 37 publications that have conducted studies on UHI. Most of these publications concentrate on the capital city, which is unsurprising given its significance. Nearly 30% of the compiled publications delve into the emergence, causes, and effects of heat islands in the Delhi region. Following Delhi, Bangalore stands out as India's second most prominent location for UHI research.
The urban heat island effect, or UHI, is characterized by the fact that city temperatures are almost always higher than those in the surrounding rural areas. This issue has emerged as a significant concern in numerous Indian cities due to their rapid urbanization. The extent of urban areas plays a direct role in shaping the local climate and its evolution 33. Several factors contribute to the climatic instability experienced in urban regions, including air pollution, the heat generated from human activities like industrial operations and vehicular emissions, alterations in urban infrastructure, and the overall air quality. Studies carried out in major Indian cities such as Chennai, Bangalore, Delhi, and Pune have revealed notable rises in temperature. As an example, the maximum intensity of the heat island was 2.48 degrees Celsius higher in the summer than in the winter in Chennai. Similarly, Bangalore has witnessed a temperature increase of approximately 2.5°C over the last ten years, coinciding with a staggering 632% population growth in the metropolitan area between 1973 and 2009. In Delhi, the heat island effect reached its peak with a temperature increase of 8.3°C, while the minimum temperature rise was recorded at 4.7°C. Meanwhile, Pune observed a significant rise in LST of 16 degrees Celsius during the period from 1999 to 2006. The most extreme UHI intensity ever documented worldwide was 12, whereas, in India, it reached an unprecedented temperature of 89°C.
The consequences that arise over the long term because of UHI formation encompass heightened consumption of energy and water, air pollution that contributes to the greenhouse effect, health issues stemming from excessive heat, and the deterioration of surface water sources like rivers and streams. To alleviate UHI, several measures can be undertaken. Tree canopies can be made larger, green walls and roofs installed, materials used in construction can have more reflectivity (albedo) and lower emissivity, passive cooling methods can be used indoors, and the amount of heat produced by humans can be reduced. It is essential to formulate and successfully explain policies to the public to produce an appropriate microclimate within cities, and public outreach and education play a critical part in this process34.
The majority of UHI research conducted in India has primarily concentrated on the capital city, Delhi, accounting for nearly 30% of the published studies. Bangalore emerges as the second most extensively studied city in India regarding UHI investigations. To effectively tackle UHI in Indian urban areas, it is crucial to adopt a comprehensive strategy that engages multiple stakeholders and implements measures aimed at mitigating the negative consequences of this phenomenon on urban environments and human well-being.
Methodology
The Study on UHI makes use of a wide range of techniques, from computational models to experimental studies and careful observation. Critical meteorological variables including temperature, wind speed, and humidity are continuously monitored using observational methods, which include remote sensing, field measurements, and weather stations. To better comprehend UHI patterns, satellite-based thermal imaging is useful. To explore how urbanization affects temperature variations, controlled experiments are conducted in both rural and urban locations. In these studies, variables such as building materials and vegetation density are manipulated. Taking into account aspects like land use patterns and urban planning, computational approaches examine the complex relationships between temperature and urban environments through the use of simulations and mathematical models. Incorporating these techniques into sustainable urban planning and design helps lessen the negative impact of UHI on cities by making it easier to anticipate and lessen the impact of UHI.
Satellites-based LST (Land Surface Temperature)
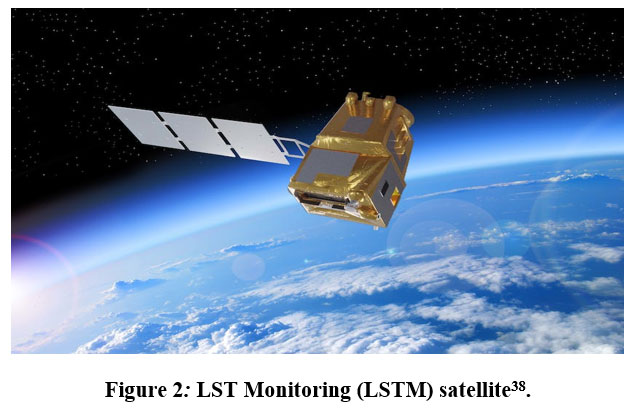
The development and deployment of methods to extract satellite Land Surface Temperature (LST) are greatly aided by validation, which serves to identify uncertainties and to guarantee broad adoption. To estimate LST from geostationary orbit data, several methods are used, such as Radiative Transfer Models, Split-Window Techniques, Single Channel Techniques, Temperature-Emissivity Separation Techniques, and Machine Learning 35. Since LST affects surface air temperature, heat distribution, and environmental processes—with consequences for ecosystems, hydrological cycles, and climate dynamics—an accurate estimate of LST is crucial 36. Weather prediction models benefit from LST data, which provides useful limits and improves forecast accuracy 37 despite issues such as bias from polar-orbiting satellites. Figure 2 shows how the land temperature is being monitored using the LST satellite.
In addition to their use in weather forecasting, LSTs have various practical applications such as estimating evapotranspiration, detecting frost, monitoring crop water stress, and studying thermal inertia. This highlights the practicalities of using satellite data to understand and manage environmental phenomena related to LST fluctuations 37. The use of satellite derived LST observation for LST calculation is depicted in Figure 2.
 | Figure 2. LST Monitoring (LSTM) satellite38.
|
Satellite Data or Remote Sensing
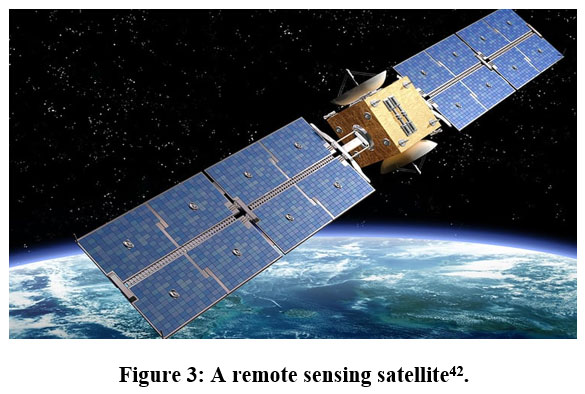
The assessment of Land Surface Temperature (LST) is one area where satellite-based remote sensing is extremely useful for keeping tabs on and comprehending environmental changes. Imaging using thermal infrared (TIR) light uses the radiative transfer equation (RTE) to correlate data collected from TIR sensors in space, which is crucial for determining LST. The goal of numerous algorithms that have been developed since the 1970s is to extract LST from TIR data. These algorithms use methods such as temperature separation, emissivity correction, split-window strategy, single-channel approach, and day-night algorithms for this purpose 39. In addition, PMW remote sensing allows data gathering in a variety of weather situations, which makes up for the absence of TIR data. To extract LST from PMW satellite data, four main approaches have been used: empirical, semi-empirical, physically based, and neural network. Scientists may learn more about how microwave radiative transfer works thanks to this method of synthesis and comparison, which is useful for studying how ecosystems are changing as a result of climate change 40. To address concerns like global sea-level rise, which may not be effectively accounted for by present models, the utilization of fourteen NASA satellites in geosynchronous and sun-synchronous orbits, each equipped with a variety of sensors, improves the capacity to discover large-scale patterns and insights 41. A satellite built for remote sensing, with a focus on radiation detection and monitoring, is shown in Figure 3.
 | Figure 3: A remote sensing satellite42.
|
Information on the Earth's atmosphere, surface, and oceans is derived from data collected by artificial satellites in orbit, which is an essential component of Earth observation. Researchers have typically zeroed in on specific cities in the temperate zone when examining urban heat island (UHI) phenomena 43. This study makes a unique contribution, though, by comparing surface UHIs in eight large Asian cities: Ho Chi Minh City, Beijing, Shanghai, Seoul, Bangkok, Tokyo, Pyongyang, Manila, and both tropical and temperate zones of Asia. Urban heat island (UHI) variations are better understood, and the results are useful for decisions about city planning and climate change adaptation Top of Form44.
Thermal Sensors
Thermal sensors are used in a variety of industries, including agriculture, medicine, transportation, and others, to monitor object temperatures using the ideal 8-14 micrometer wavelength range 45. These sensors, which operate within the atmospheric window, record the digital quantity of radiation and convert it into temperature data, assisting applications such as anticipating heat transfer in high-risk fire scenarios 46.
Notably, they assess the performance of protective equipment, particularly for firemen, by measuring heat flow and calibrating heat sources. In thermoelectric sensors, several materials such as silicon and platinum are employed, with platinum being preferred due to its properties such as a high positive temperature coefficient of resistance 47. Despite their value, semiconductor sensors are expensive due to manufacturing costs, specialized equipment, and environmental issues. New thermal detecting materials research is critical for developing these sensors in terms of cost and application in difficult settings 48.
Passive Microwave Sensors
Passive microwave sensors, such as radiometers aboard satellites and aircraft, catch natural microwave radiation generated by surfaces, providing significant temperature and humidity data. These sensors can measure a variety of meteorological characteristics such as sea ice, salinity, water vapor, and sea surface temperature. The brightness temperature, calculated from recorded surface radiance, represents surface physical qualities. Clouds and precipitation provide little difficulty, as the approach works both day and night 49. Despite its extensive applicability, passive microwave remote sensing is limited by its comparatively modest energy output, as demonstrated by the Earth's meager microwave emissions. While space-based radiometers excel at recovering air and ocean surface temperatures, acquiring ground temperature remains difficult, affecting agricultural, weather modeling, and hydrological applications. Surface temperature retrieval is being improved for more broad applications 50. Figure 4 illustrates the process of utilizing passive microwave technology for remote sensing.
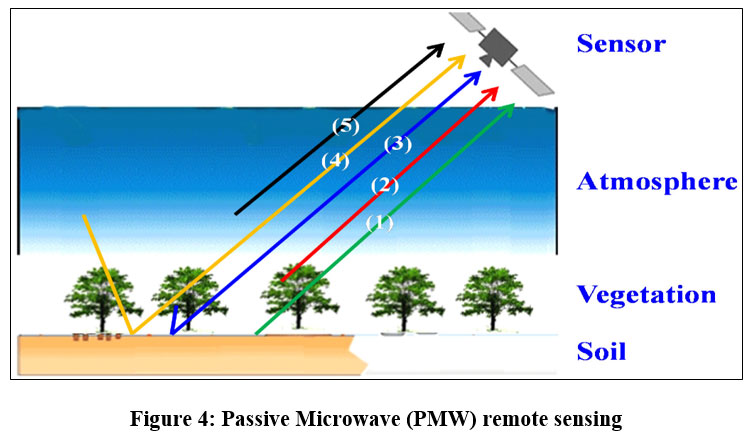 | Figure 4: Passive Microwave (PMW) remote sensing
|
Passive Microwave (PMW) remote sensing provides a weather-resistant method of gathering surface information, overcoming the restrictions imposed by weather circumstances such as clouds and vegetation on Thermal Infrared (TIR) data. PMW satellite observations have been continuous since the launch of Nimbus-7 in 1978, allowing the construction of a comprehensive long-term worldwide record of Land Surface Temperature (LST). Several techniques for LST recovery from PMW data have emerged, broadly classified as empirical, semi-empirical, physically based, and neural network methods. Depending on the unique requirements and climatic conditions, each approach has advantages and disadvantages, adding to a comprehensive toolkit for extracting LST information from PMW satellite photos 51.
Mobile Observations Approach
Mobile surveys provide a unique chance to collect comprehensive temperature data in urban locations such as city blocks, delivering information that standard weather stations do not provide. A study was done between two rivers in the Nakashima neighborhood of Osaka City, Japan, focusing on studying air temperature and humidity changes driven by sea winds. The examination of these mobile measurements provides information about the local climate. While different institutions, including universities and municipal governments, have used mobile devices to map air temperature trends in urban areas, accuracy concerns developed when employing automobiles due to heat released by vehicle components. To solve this, switching from autos to bicycles was proposed to avoid potential effects from radiant heat sources; however, this may limit the research area to a straight route or a small zone, necessitating consideration in comprehensive studies 52.
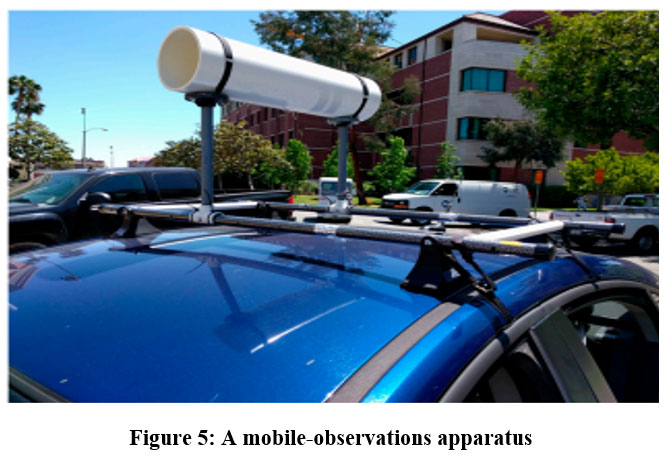 | Figure 5: A mobile-observations apparatus.
|
In this work, researchers created portable observation equipment (shown in Figure 5) to collect extensive temperature data, including characteristics such as location, elevation, speed, and time. The apparatus, designed to measure atmospheric temperature at 2 meters, included a thermometer sensor strategically sheltered from direct sunlight to ensure reliable readings. The sensor's quick response time reduced the blurring effect generated by the vehicle's speed on the air temperature map. However, difficulties emerged because of the observation station's heat output and interactions with other platforms, potentially generating mistakes in mobile temperature data 53. Recognizing the complexities of mobile observations, the study underlines the need to understand and correct error sources, even if complete eradication is not always possible. The paragraph emphasizes the importance of users critically evaluating data restrictions imposed by the observation platform, as well as the construction of a radiation barrier to address issues provided by specific conditions such as direct sunlight. However, employing the shield outside of its intended context should be avoided because it may result in measurement mistakes despite the look of authentic data 54.
UHI-Based Numerical Modelling
Numerical modeling technology is critical for simulating heating and cooling processes in a variety of industries, particularly in the food industry, where engineers use techniques such as finite element analysis and finite volume analysis. More data on surface heat transfer, mass transfer parameters, and food qualities are needed to improve the precision of these models. Integrating numerical heat and mass transfer models with other models allows for real-time food safety assessment 55. Numerical modeling is critical for understanding the origins and intricacies of the Urban Heat Island (UHI) phenomena, with a focus on the interaction between pollutants and heat islands 56.
Furthermore, numerical simulation of thermal conditions around buildings provides insights into design decisions that affect occupant comfort but face difficulty in accounting for three-dimensional surface temperature distribution. These issues are addressed by advanced computational fluid dynamics (CFD) modeling, which allows for precise investigation of burner combustion, temperature profiles, and flue gas circulation in heating systems. It is proposed to use CFD calculations to investigate the dynamic interplay between flow and temperature fields in urban settings 57.
SUHI and LST Studies Applying Different Techniques
The study of climate change, encompassing both natural and human-induced factors, along with its evaluation and the forecasting of climatic patterns using statistical models and time series, can all gain significant advantages from the collection of surface temperature data at specific locations. The capability to anticipate land surface temperatures (LSTs) holds considerable potential in mitigating societal issues and enhancing individuals' well-being58. This parameter has a wide range of applications and has been utilized to validate research findings in various fields. For instance, it has been used to analyze environmental factors such as aquifers and water bodies, study biomes and forest dynamics, assess natural hazards like volcanic activity, measure air pollution and determine the particulate concentration in urban areas, evaluate architectural designs by using the Surface Urban Heat Island (SUHI) effect to assess building area and layout, among others. The use of remote sensing data for the early detection of SUHIs aids in the discovery of environmental imbalance, the identification of problems, and the development of solutions 59. When studying the UHI phenomenon, researchers often rely on LST as it serves as a useful indicator of local climatic zones (LCZ). Further applications of LST include studying heat wave-related mortality and public health, locating regions with comparable topography, built environment, and human activities across different distances, and characterizing the climate at a specific location by integrating data from both stationary and mobile sensors. Researchers also look at how cultural and socioeconomic factors play a role60.
Urban Heat Island mitigation in terms of urban design.
The extent to which a city encounters the repercussions of climate change is contingent upon its capacity to adapt and mitigate these impacts. It is widely known that cities possess their distinct climate, which typically exhibits higher temperatures compared to the surrounding rural areas. The Urban Heat Island (UHI) phenomenon has diverse effects on air quality, water usage, and energy consumption. To improve outdoor thermal comfort and counteract the heat island effect, several mitigation strategies have been suggested, including shading, highly reflective materials, ventilation, and green infrastructure61. Therefore, incorporating these tactics into current urban planning processes and future developments is crucial. Researchers and city planners will need to assess the city's features and planning resources, with a special focus on the connections among land cover, land use, and mean surface temperatures, to reach this goal. By thoroughly analyzing these relationships, it becomes possible to formulate initial urban design plans that prioritize climate change adaptation62.
One successful strategy for prevention involves the augmentation of urban vegetation. Apart from serving as a natural shield, trees can regulate the ambient air temperature of a city by blocking sunlight and impeding its penetration into impermeable surfaces. This natural process, referred to as evapotranspiration, can effectively decrease the air temperature by approximately 1.6 to 3.3 degrees Celsius. Furthermore, the presence of green spaces such as gardens and plant-filled areas assists in curbing the localized temperature increase by promoting evaporation and subsequent surface cooling63.
Urban Geometry
The growth of UHI during nighttime is also influenced by the arrangement of buildings and structures in a city, known as urban geometry. Wind direction, energy absorption, and the capacity of surfaces to emit heat outside in the form of long-wave radiation are all influenced by urban geometry. Due to the presence of neighboring structures, many urban surfaces and buildings are partially or completely obstructed, creating large thermal masses that retain heat and make it difficult for it to dissipate. Consequently, temperatures in urban areas, particularly at night, tend to be higher than in rural regions. This persistent heat during the night can pose a risk to urban populations during heat waves, as the phenomenon of atmospheric heat islands continues to exist. Within the realm of urban geometry, a particular focus is placed on studying urban canyons, which are narrow roads flanked by tall buildings. Throughout the day, urban canyons can have negative effects. The height of buildings allows them to cast shadows and provide shade. However, the presence of these magnificent structures in the canyon also decreases the overall albedo of the city. Albedo refers to the net reflectivity of a surface or urban design, and a lower albedo can contribute to higher temperatures in the area. Moreover, buildings and other structures hinder the cooling process of urban canyons at night by impeding the flow of heat from the urban infrastructure64. The impacts of UHI are the most visible and extensively documented manifestation of human-induced climate change. The characteristics and extent of this phenomenon vary across different locations and periods due to variations in climate and urban design. The complexity of the heat island phenomenon is such that research exploring it can only begin to delve into its complexities. Several factors contribute to the formation of a heat island, including artificial sources of heat, the layout of urban areas, and the types of materials used in constructing surrounding buildings. Furthermore, UHI significantly influences human perception of warmth and energy consumption, highlighting the significance of this topic65.
Pavements
Traditional paving materials, such as concrete and asphalt, tend to rapidly heat up under the sun's rays. However, during the cooler night hours, they release the accumulated heat as longwave radiation, significantly impacting the perceived warmth experienced by individuals on the ground. The restricted water permeability of typical pavement materials also prevents soil from absorbing water, nullifying evaporation's cooling impact. The best way to reduce the negative impacts of traditional pavements on urban conditions is to make them less heat-absorbing, either by changing their composition or by making water evaporation from their surface easier.
Cool pavements
One potential way to decrease the amount of heat absorbed from external structures, particularly pavements, is by employing paving materials that possess higher albedo values. Although the use of cool materials for pavements is comparable to employing them for building exteriors, the available choices for pavements are more constrained and typically rely on asphalt or concrete. The efficiency of cool pavement substances in reflecting radiation from the sun is diminished when glare from pavements must be reduced for pedestrian safety and comfort. Though they are still in the research and development phase, some possible solutions to this problem already exist, such as the creation of novel materials with low reflectivity in the visible range of the electromagnetic spectrum and high reflection in the near-infrared range. A common term for strategies that reduce urban heat island effects (UHI) in pavements is cool pavements, which refer to pavements that are reflective or permeable66 and typically have a lower surface temperature than more traditional paving materials like solid pavement67.
Water-retentive pavements
Engineers have come up with various pavement designs to address the issue of excessive heat caused by direct sunlight. These designs employ evaporation to reduce the temperature. The main strategy involves using porous paving materials that sit atop a sub-layer capable of retaining water. This setup enables water to pass through the pavement and be absorbed by the underlying ground. As the water evaporates, it releases water vapor, leading to a cooling effect on the pavement and the surrounding atmosphere, countering the heat generated by the top layer of pavement68.
Landscaping
Various approaches to mitigating urban heat involve modifying the urban landscape. There is no need to make changes to individual private properties such as buildings or the existing paving infrastructure. Instead, the urban landscape can make use of extra landscaping forms.
Shade trees
Trees can diminish the amount of heat absorbed by surfaces such as pavements, roads, and building walls due to the shade they provide with their canopies. This results in a reduced heat intake for these horizontal and vertical structures. When trees are exposed to direct sunshine, they release vaporized water into the atmosphere through a process called evapotranspiration, adding to the feeling of warmth in the surrounding environment.
Ground vegetation
The presence of low-level plantings such as grass lawns can have a local cooling effect. When temperate grasslands are abundant, they absorb a significant amount of solar radiation, but a substantial portion of that heat is released as vapor through evapotranspiration if the land is adequately watered. This process helps maintain cooler temperatures in the surrounding ground and immediate vicinity. However, if the soil is dehydrated owing to a lack of irrigation, the area's daytime cooling potential will be reduced because evapotranspiration will be lower, causing a rise in near-surface temperature.
Extensive usage of ground plants in hot and humid areas, at night, might ease pain by elevating relative humidity levels. Keep in mind that the degree to which this has an effect is restricted and varies according to the unique climatic features of the vegetated area.
Water bodies
There are two primary ways in which water might help reduce the UHI effect: first, through evaporation which cools the air, typically achieved using ponds and fountains; second, by transporting heat away from urban areas via rivers and canals. The size of water bodies is important, as larger surfaces have a greater ability to absorb heat, thereby aiding in maintaining cooler temperatures in cities. It is commonly believed that water bodies create a localized "urban cool island" effect, but the ability to harness and regulate these effects is usually limited to minor interventions 68.
Research trends in UHI studies in India
UHI is a phenomenon observed in cities worldwide, and its potential to contribute to global climate change necessitates thorough research. Therefore, understanding the variation in UHI severity and trends over time with macro urbanization features has become increasingly crucial. The study specifically examined Asian megacities and explored the relationship between the size of the metropolitan area and the intensity of the urban heat island (UHI) effect during various seasons between 1992 and 2012. Time series analysis was utilized to detect any ascending patterns in UHI intensity, while comparisons and examinations of different characteristics were performed.
The results revealed that the relationship between the size of urban areas and the severity of the urban heat island (UHI) differs depending on the season. Significant correlations were observed during the summer season, whereas less pronounced correlations were noted during the winter season for most cities. Moreover, the association between the size of urban areas and the intensity of the urban heat island (UHI) seems to be affected by various factors, including geography, growth direction, and economic conditions that are unique to each city. The magnitude of UHI was found to be influenced by the city's size, economy, and population. This study represents a significant endeavor in examining the impact of urban area size on the evolution of UHI intensity, offering valuable insights for future research directions. Generally, studies on UHI can be classified into two categories. Detailed case studies focus on examining UHI in one or a few cities, while ensemble or cross-sectional studies analyze multiple cities to identify underlying similarities or differences. The availability of remote sensing has facilitated a growing body of systematic empirical investigations, enabling researchers to explore these types of studies. Numerous studies have demonstrated that urbanization contributes to increased UHI intensity over time, suggesting that urban impact can affect current warming trends69. Table 3 displays the research investigations carried out on the generation of heat islands in India between 2010 and 2018. These articles suggest that the study of India's UHI phenomenon was initiated during the early 1900s. Figure 6 highlights the specific locations where UHI research has been focused on India. It can be inferred that the exploration of UHI in India started around the beginning of the 20th century.
Table 3: Research on urban heat islands in India.
Sr. No. | Years | Study Location |
1. | 2010 | Bangalore, Karnataka |
2. | 2011 | Delhi |
3. | 2011 | Bangalore, Karnataka |
4. | 2012 | Delhi |
5. | 2012 | Pune, Maharashtra |
6. | 2012 | Delhi |
7. | 2012 | Jaipur, Rajasthan |
8. | 2013 | Delhi |
9. | 2014 | Kochi, Kerala |
10. | 2014 | Guwahati, Assam |
11. | 2015 | Bathinda, Punjab |
12. | 2015 | Tiruchirappalli, Tamilnadu |
13. | 2015 | Delhi and Mumbai, Maharashtra |
14. | 2015 | Ahmedabad, Gujarat |
15. | 2016 | Ernakulam, Kerala |
16. | 2016 | Chennai, Tamil Nadu |
17. | 2016 | Uttarakhand |
18. | 2016 | Ahmedabad, Gujarat |
19. | 2016 | Bhubaneshwar, Odisha |
20. | 2016 | Noida, Uttar Pradesh |
21. | 2016 | Kanpur, Uttar Pradesh |
22. | 2017 | Lucknow, Uttar Pradesh |
23. | 2017 | Delhi |
24. | 2018 | Mumbai, Maharashtra |
25. | 2018 | Kolkata, West Bengal |
The geographical locations in India where research on UHI has been carried out are depicted on the map in Figure 6.
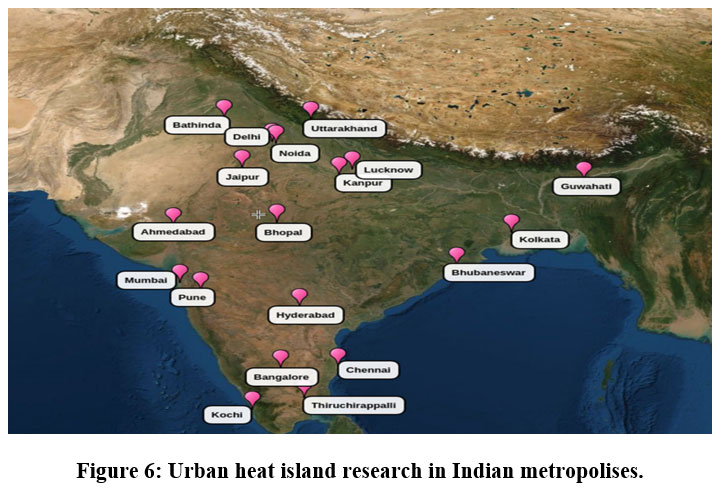 | Figure 6: Urban heat island research in Indian metropolises.
|
Comparative Analysis of Data Presented in Previous Year's Literature Surveys
According to Halder et al. (2021)70, Both global warming and increased urbanization contribute to UHI. UHI causes temperature variations between urban and rural areas, and it is influenced by factors such as population growth, urbanization, lack of vegetation, industrialization, and transportation. To investigate UHI, thermal remote sensing was used in a study done in Kolkata, India. The study looked at how different variables, including LST, Land Use/Land Cover (LULC), NDVI, and NDBI, are related to one another and the changes in land use/land cover change. The study found that the built-up areas increased from 22.01% in 1990 to 55.768% in 2011, and the annual temperature rose by 0.157 °C. Urban expansion negatively impacted vegetation, resulting in a negative correlation between LST and NDVI. On the other hand, anthropogenic activities positively correlated with LST and NDBI. The study projected further urbanization and environmental damage by 2030 and 2050. Therefore, effective planning is necessary in these areas to safeguard the environment and enhance livelihoods.
According to Mohammad et al. (2022)71, Indian cities are facing environmental and ecological threats due to unplanned urbanization. As a result, the metropolitan area has substantially greater LST than the surrounding rural areas, creating a serious ecological concern known as the metropolitan Heat Island effect. The research looks at the IS, GS, and LST of four emerging cities in India. Using Landsat OLI/TIRS data, they estimate surface UHI and examine the urban-rural gradient. In Jodhpur, Nagpur, and Ahmedabad there is a negative correlation between LST and IS, while in Guwahati, it is positively correlated. Urban areas with more greenery (GS) in Guwahati naturally lower LST and enhance the Urban Cool Island (UCI) effect. However, the presence of GS in rural areas has a negligible impact on the other three cities.
Veena et al. (2020)72, emphasized the negative consequences of urbanization, such as increased pollution, unpredictable weather patterns, and the UHI effect. Urban areas are expanding rapidly, leading to a significant loss of land. The UHI effect causes cities to experience a rapid rise in temperatures, impacting major cities in India. The article evaluates the progress of UHI research in Indian cities until 2018, discussing different types of heat islands, research methodologies, and their limitations. A comparison with global UHI research highlights the need for more numerical modeling studies specific to India. Table 4 presents various authors who employed this technique and shared their findings.
Table 4: Comparison between suggested studies and previous studies.
S.no. | Authors Name [ref no.] | Technique or Terminology | Approximate Outcome |
1 | Halder et al., (2021)70 | land cover change dynamics, LST increment approx. using LST, LULC, NDVI, and NDBI correlations. | In 1990, 22.01% of the area was developed, which increased to 31.44% in 2000, 44.21% in 2010, and 55.768% in 2011. The annual temperature experienced a rise of 0.157 °C. |
2 | Mohammad et al., [69]71 | UHI are major ecological risks where urban areas have a greater LST than rural areas. LST, SUHI, and IS are compared (GS). | The degree to which urban and rural areas differ in temperature is affected by the ratio of green areas to impervious surfaces (IS). The effects of LST, SUHII, and GS can be seen in a very small temperature range shift of 2%-3% throughout India's four climatic cities. |
3 | Veena et.al. (2020) [67[72 | Urban hotspots (UHI). Cities are expanding as the temperature expands concerning population expansion. | Numerical modeling is an effective method for analyzing heat islands and predicting future climate in cities. While India is just beginning to embrace CFD (Computational Fluid Dynamics) in studying urban microclimates, it is a growing trend in the 21st century. The spread of pollutants in cities is studied using mesoscale and CFD models, with the assumption that temperatures will rise by less than 1% by the middle of the 21st century. |
Conclusion
Satellite data is increasingly used in climate research in India to study the UHI effect on urban and rural areas. Various methods, such as objective measurements from mobile surveys and weather station data, as well as numerical modeling, are employed to accurately measure UHI and predict climate changes in cities. Remote sensing evaluations can help city planners and administrators mitigate the issues caused by UHI. Research on UHI in India primarily focuses on Delhi and Bangalore, with studies examining the sources and impacts of heat islands. By analyzing parameters such as LST, Land Use/Land Cover (LULC), Normalized Difference Vegetation Index (NDVI), and Normalized Difference Built-Up Index (NDBI), the anticipated future influence of UHI can be estimated. Strategies to reduce UHI effects include increasing tree canopies, constructing green walls and roofs, improving building material reflectivity and emissivity, implementing passive cooling techniques indoors, and reducing human-made heat sources. One challenge is the lack of public education and awareness about rising temperatures, so clear policies need to be formulated and communicated to strike a balance in the urban microclimate.
Acknowledgment
The author would like to express her sincere gratitude to “Prof. Jaswant Singh” from the “Department of Environmental Sciences” for their invaluable contributions to this research paper. Their expertise and insights have been instrumental in shaping the direction of this study. The author is also grateful for the support and resources provided by the “Department of Environmental Sciences” of “Ram Manohar Lohia Avadh University”. The author extends heartfelt thanks to all those who have contributed to the successful completion of this research.
Conflict of Interest
The author(s) declared no potential conflicts of interest concerning this article's research,
Funding Source
There is no funding or financial support for this research work. authorship, and publication.
Data Availability Statement
The manuscript incorporates all datasets produced or examined throughout this research study.
Ethics Approval Statement
Study do not involve any experiment on humans and animals.
Authors’ Contribution
The author confirms sole responsibility for the study conception and design, data collection, analysis and interpretation of results, and manuscript preparation.
References
- Tetali S, Surekha N, Baird N, Klima K. A multicity analysis of daytime Surface Urban Heat Islands in India and the US. Sustainable Cities and Society. 2022; 77:103568.
CrossRef - ARAbI, RoozbeH, Mohd FAIRUz SHAHIdAn, MS Mustafa Kamal, M. F. Z. B. Jaafar, and Mehdi Rakhshandehroo. "Mitigating urban heat island through green roofs." Current World Environment 10, no. 1 (2015): 918-927.
CrossRef - Blocken B. Computational Fluid Dynamics for urban physics: Importance scales possibilities limitations and ten tips and tricks towards accurate and reliable simulations. Build Environ. 2015;1-27.
CrossRef - Nakata-Osaki CM, Lucas de Souza LC, Rodrigues DS. A GIS extension model to calculate Urban Heat Island intensity based on urban geometry. Computers, Environment, and Urban Systems. 2015;1-16.
- Sharma D, Bharat A. Urban Heat Island effect – causes impacts methods of measurement and mitigation options. Institute of Town Planners, India. 2009;6(2):69-77.
- Santra A. Land surface temperature estimation and urban heat island detection: A remote sensing perspective. In: Environmental Information Systems: Concepts, Methodologies, Tools, and Applications. IGI Global; 2019:1538-1560.
CrossRef - Abokhashabah T, Jamoussi B, Summan AS, Abdelfattah E, Ijaz A. Effects of heat stress exposure and climate change on health and safety of outdoor workers. Current World Environment 2021;16(3):836.
CrossRef - Ngie A, Abutaleb K, Ahmed F, Darwish A, Ahmed M. Assessment of urban heat island using satellite remotely sensed imagery: a review. S Afr Geogr J. 2014;96(2):198-214.
CrossRef - Mohan M, Kandya A, Battiprolu A. Urban heat island effect over the national capital region of India: a study using the temperature trends. Journal of Environmental Protection. 2011;2(4):465.
CrossRef - Swain D, Roberts GJ, Dash J, Vinoj V, Lakshmi K, Tripathy S. Impact of rapid urbanization on the microclimate of Indian cities: a case study for the city of Bhubaneswar. In: Land surface and cryosphere remote sensing III. SPIE; 2016:366-372.
CrossRef - Babazadeh M, Kumar P. Estimation of the urban heat island in local climate change and vulnerability assessment for air quality in Delhi. European Scientific Journal. 2015.
- Kikon N, Singh P, Singh SK, Vyas A. Assessment of urban heat islands (UHI) of Noida City, India using multi-temporal satellite data. Sustainable Cities and Society. 2016; 22:19-28.
CrossRef - Kumar R, Mishra V, Buzan J, Kumar R, Shindell D, Huber M. Dominant control of agriculture and irrigation on urban heat island in India. Scientific Reports. 2017;7(1):14054.
CrossRef - Amirtham LR. Urbanization and its impact on urban heat Island intensity in Chennai Metropolitan Area, India. Indian Journal of Science and Technology. 2016;9(5):1-8.
CrossRef - Pandey P, Kumar D, Prakash A, et al. A study of urban heat island and its association with particulate matter during winter months over Delhi. Science of the Total Environment. 2012; 414:494-507.
CrossRef - Borbora J, Das AK. Summertime urban heat island study for Guwahati city, India. Sustainable Cities and Society. 2014; 11:61-66.
CrossRef - Shastri H, Barik B, Ghosh S, Venkataraman C, Sadavarte P. Flip Cop of Day-night, and Summer-winter Surface Urban Heat Island intensity in India. Scientific Reports. 2017;1-8.
CrossRef - Chakraborty T, Sarangi C, Tripathi SN. Understanding diurnality and inter-seasonality of a sub-tropical urban heat island. Boundary-Layer Meteorology. 2017; 163:287-309.
CrossRef - Sharma N, Pandey P. Study of urban heat island in Bathinda city, Punjab. In: 16th ESRI India User Conference. 2015:1-14.
- Aslam MY, Rama Krishna K, Beig G, Tinmaker MIR, Chate DM. Seasonal variation of urban heat island and its impact on air-quality using SAFAR observations at Delhi, India. American Journal of Climate Change. 2017;6(2):294-305.
CrossRef - Baby MM, Arya G. A Study of Urban Heat Island and its mapping. International Journal of Scientific and Engineering Research. 2016;4(3):45-47.
- Deosthali V. Impact of rapid urban growth on heat and moisture islands in Pune City, India. Atmos Environ. 2000;34(17):2745-2754.
CrossRef - Kumar KS, Bhaskar PU, Kumari KP. Assessment and mapping of urban heat island using field data in the new capital region of Andhra Pradesh, India. Indian J Sci Technol. 2017;10(11):1-8.
CrossRef - Kannamma D, Meenatchi Sundaram A. Significance of microclimatic study in urban canyons towards ambient urban space design. J Today's Ideas- Tomorrow's Technol. 2015;3(1):95-109.
CrossRef - Mehrotra S, Bardhan R, Ramamritham K. Urban informal housing, and surface urban heat island intensity: exploring spatial association in the City of Mumbai. Environ Urbanization Asia. 2018;9(2):158-177.
CrossRef - Ahmad S, Matloob H, Warsi TR, Khan A. The evaluation of heat island effect in various cities in Ganga-Yamuna Doab region using MODIS land surface temperature product. Asian J Environ Sci. 2011;6(2):185-190.
- Mohan, Manju, Yukihiro Kikegawa, B. R. Gurjar, Shweta Bhati, Anurag Kandya, and Koichi Ogawa. "Urban heat island assessment for a tropical urban airshed in India." (2012).
CrossRef - Thomas G, Sherin AP, Ansar S, Zachariah EJ. Analysis of urban heat island in Kochi, India, using a modified local climate zone classification. Procedia Environ Sci. 2014; 21:3-13.
CrossRef - Ambinakudige S. Remote sensing of land cover's effect on surface temperatures: a case study of the urban heat island in Bangalore, India. Appl GIS. 2011;7(1).
- Devi SS. Urban heat islands and environmental impact. In: 86th American Meteorological Society annual meeting. Atlanta, Georgia; 2006.
- Goswami A, Mohammad P, Sattar A. A temporal study of Urban Heat Island (UHI): Evaluation of Ahmedabad city, Gujarat. In: International Conference on Climate Change Mitigation and Technologies for Adaptation. 2016:1-5.
- BhARDwAj, PuRNImA, Alok Kumar Pandey, Krishan Kumar, and V. K. Jain. "Spatial variation of Aerosol Optical Depth and Solar Irradiance over Delhi-NCR during Summer season." Current World Environment 12, no. 2 (2017): 389.
CrossRef - Ramachandra TV, Kumar U. Greater Bangalore: Emerging Urban Heat Island. GIS Dev. 2010;14(1):1–16.
- Jain G, Sarkar S. Urban Heat Island: Causes, effects, and mitigating strategies. Imp J Interdiscip Res. 2017;3(5):2098-2103.
- Yu Y, Yunyue D, Tarpley JL, Privette JL, Flynn LE, Xu H, Chen M, Vinnikov KY, Sun D, Tian Y. Validation of GOES-R satellite land surface temperature algorithm using SURFRAD ground measurements and statistical estimates of error properties. IEEE Trans Geosci Remote Sens. 2012;50(3):704-713.
CrossRef - https://land.copernicus.eu/global/products/lst.
- Prata AJ, Caselles V, Coll C, Sobrino JA, Ottle C. Thermal remote sensing of land surface temperature from satellites: Status and prospects. Remote Sens Rev. 1995;12(3-4):175-224.
CrossRef - https://www.eoportal.org/satellite-missions/lstm#eop-quick-facts-section
- Wan Z, Li Z-L. A physics-based algorithm for retrieving land-surface emissivity and temperature from EOS/MODIS data. IEEE Trans Geosci Remote Sens. 1997;35(4):980-996.
CrossRef - Holmes TRH, de Jeu RAM, Owe M, Dolman AJ. Land surface temperature from Ka-band (37 GHz) passive microwave observations. J Geophys Res Atmos. 2009;114(D04113).
CrossRef - Venevsky S. Emergence of climate change ecology. 2017.
CrossRef - https://dragonflyaerospace.com/how-remote-sensing-satellites-works/
- https://www.iceye.com/satellite-data#:~:text=Satellite%20data%20or%20satellite%20imagery,changes%20on%20the%20planet%20Earth
- Tran H, Uchihama D, Ochi S, Yasuoka Y. Assessment with satellite data of the urban heat island effects in Asian mega cities. Int J Appl Earth Obs Geoinf. 2006;8(1):34-48.
CrossRef - https://www.sciencedirect.com/topics/materials-science/thermal-sensor#:~:text=Thermal%20sensors%20are%20construction% 20elements,Polymer%20 Nanocomposites% 20Containing%20 Graphene%2C%202022
- Almeida CR, Teodoro AC, Gonçalves A. Study of the urban heat island (UHI) using remote sensing data/techniques: A systematic review. Environments. 2021;8(10):105.
CrossRef - Mandal S, Song G. Thermal sensors for performance evaluation of protective clothing against heat and fire: a review. Textile Res J. 2015;85(1):101-112.
CrossRef - Dinh T, Phan H-P, Qamar A, Woodfield P, Nguyen N-T, Dao DV. Thermoresistive effect for advanced thermal sensors: Fundamentals, design considerations, and applications. J Microelectromech Syst. 2017;26(5):966-986.
CrossRef - http://gsp.humboldt.edu/olm/Courses/GSP_216/lessons/microwave/passive.html
- McFarland MJ, Miller RL, Neale CMU. Land surface temperature derived from the SSM/I passive microwave brightness temperatures. IEEE Trans Geosci Remote Sens. 1990;28(5):839-845.
CrossRef - Duan SB, Xiao-Jing Han C, Huang C, et al. Land surface temperature retrieval from passive microwave satellite observations: State-of-the-art and future directions. Remote Sens. 2020;12(16):2573.
CrossRef - Yoshida A, Yasuda R, Kinoshita S. Mobile Observation of Air Temperature and Humidity Distributions under Summer Sea Breezes in the Central Area of Osaka City. Atmosphere. 2020;11(11):1234.
CrossRef - Taha H, Levinson R, Mohegh A, et al. Air-temperature response to neighborhood-scale variations in albedo and canopy cover in the real world: Fine-resolution meteorological modeling and mobile temperature observations in the Los Angeles climate archipelago. Climate. 2018;6(2):53.
CrossRef - Waugh SM. The "U-tube": An improved aspirated temperature system for mobile meteorological observations, especially in severe weather. J Atmos Oceanic Technol. 2021;38(9):1477-1489.
CrossRef - Wang L, Lijun, Sun D. Recent developments in numerical modeling of heating and cooling processes in the food industry—a review. Trends Food Sci Technol. 2003;14(10):408-423.
CrossRef - Atkinson BW. Numerical modeling of urban heat-island intensity. Boundary-Layer Meteorology. 2003;109:285-310.
CrossRef - Nazarian N, Fan J, Sin T, Norford L, Kleissl J. Predicting outdoor thermal comfort in urban environments: A 3D numerical model for standard effective temperature. Urban Climate. 2017;20:251-267.
CrossRef - Hongyu D, Xuejun S, Hong J, Zenghui K, Zhibao W, Yongli C. Research on the cooling island effects of water body: A case study of Shanghai, China. Ecological Indicators. 2016;67:31–38.
CrossRef - Kadaverugu, Ashok, Kasi Viswanadh Gorthi, and Nageshwar Rao Chintala. "Impacts of urban floods on road connectivity-a review and systematic bibliometric analysis." Current World Environment 16, no. 2 (2021): 575.
CrossRef - Rajasekar U, Weng Q. Application of association rule mining for exploring the relationship between urban land surface temperature and biophysical/social parameters. Photogrammetric Engineering and Remote Sensing. 2009;75(4):385-396.
CrossRef - Abokhashabah, Tarek, Bassem Jamoussi, Ahmed Saleh Summan, Ezz Abdelfattah, and Ahmad Ijaz. "Effects of Heat Stress Exposure and Climate Change on Health and Safety of Outdoor Workers." Current World Environment 16, no. 3 (2021): 836.
CrossRef - Villanueva-Solis J. Urban heat island mitigation and urban planning: the case of Mexicali, BC Mexico. Am J Climate Change. 2017;6(1):22.
CrossRef - Villanueva J, Venegas FR, García OR. Urban Heat Island: Urban Analysis, Assessment and Measuring Mitigation in Cities of Extreme Dry Weather. In: The 3rd International C.E.U. Congress: Climate Change and Urban Design; September 14-16, 2008; Oslo. p. 180-190.
- U.S. Environmental Protection Agency. Reducing Urban Heat Islands: Compendium of Strategies. Available from: http://www.epa.gov/heatisland/resources/compendium.htm. Accessed January 14, 2011.
- Nakata CM, de Souza LCL. Verification of the influence of urban geometry on the nocturnal heat island intensity. J Urban Environ Eng. 2013;7(2):286-292.
CrossRef - ARAbI, RoozbeH, Mohd FAIRUz SHAHIdAn, MS Mustafa Kamal, M. F. Z. B. Jaafar, and Mehdi Rakhshandehroo. "Mitigating urban heat island through green roofs." Current World Environment 10, no. 1 (2015): 918-927.
CrossRef - ARAbI, RoozbeH, Mohd FAIRUz SHAHIdAn, MS Mustafa Kamal, M. F. Z. B. Jaafar, and Mehdi Rakhshandehroo. "Mitigating urban heat island through green roofs." Current World Environment 10, no. 1 (2015): 918-927
CrossRef - Aleksandrowicz G, Or D, Vuckovic M, Kiesel K, Mahdavi A. Current trends in urban heat island mitigation research: Observations based on a comprehensive research repository. Urban Climate. 2017;21:1-26.
CrossRef - Lee K, Kim Y, Sung HC, Ryu J, Jeon SW. Trend analysis of urban heat island intensity according to urban area change in Asian megacities. Sustainability. 2019;12(1):112.
CrossRef - Halder B, Bijay J, Bandyopadhyay J, Banik P. Monitoring the effect of urban development on urban heat island based on remote sensing and geospatial approach in Kolkata and adjacent areas, India. Sustainable Cities and Society. 2021;74:103186.
CrossRef - Mohammad M, Pir S, Goswami A. Spatial variation of surface urban heat island magnitude along the urban-rural gradient of four rapidly growing Indian cities. Geocarto Int. 2022;37(15):4269-4291.
CrossRef - Veena K, Parammasivam KM, Venkatesh TN. Urban Heat Island studies: Status in India and a comparison with the international studies. J Earth Syst Sci. 2020;129:1-15.
CrossRef


