An Experimental Study for Air Temperature Distribution in a Conditioned Room Using Various Vertical Locations of Conditioned Air Ducts
Sunil M Mahajan12
*
 and Vishvendranath N Bartaria1
1
Department of Mechanical Engineering,
LNCT University,
Bhopal,
Madhya Pradesh
India
2
Department of Mechanical Engineering,
Sandip Institute of Engineering and Management Nashik,
SPPU,
Maharashtra
India
Copy the following to cite this article:
Mahajan S. M, Bartaria V. N. An Experimental Study for Air Temperature Distribution in a Conditioned Room Using Various Vertical Locations of Conditioned Air Ducts. Curr World Environ 2024;19(1).
Copy the following to cite this URL:
Mahajan S. M, Bartaria V. N. An Experimental Study for Air Temperature Distribution in a Conditioned Room Using Various Vertical Locations of Conditioned Air Ducts. Curr World Environ 2024;19(1).
Citation Manager Publish History

Introduction
The air temperature distribution and air velocity distribution in conditioned space are not uniform. Therefore, the airflow and temperature distribution patterns are important parameters in the performance study of conditioned systems, occupant comfort, and well-being. The design and configuration of air distribution systems play a pivotal role in achieving uniform thermal conditions throughout the room 1. The demand for a comfortable indoor environment is increasing in the current decade as user spend 80% of their time within side areas 2. It has been established through prior research that certified workplace environments not only boost productivity but also safeguard the well-being of employees. Numerous green building technologies focusing on enhanced thermal insulation and airtightness have been integrated with buildings heated by low temperatures. Regrettably, such advancements could interfere with the natural flow of fresh air, giving rise to suboptimal indoor air quality and an increased prevalence of health issues. Inside the test room conditioned air duct positions have been moved vertically in order to perform a variety of measurements in order to determine the best conditioning system for the least amount of building heat reduction. In this paper, the study explores the air distribution in a closed room at various locations of duct position. The various test points were considered in the test space and actual temperature, humidity, and air velocity were noted 3. By analyzing and comparing the performance of various configurations, we seek to identify optimal design parameters that contribute to enhanced thermal comfort, reduced energy consumption and improved the overall indoor environmental quality. The investigations were carried out on sunny days in summer and winter seasons respectively. The principal object behind this investigation is to study the temperature distribution and airflow velocity in a closed room by shifting the location of the duct position 3,4. The findings of this study are expected to provide valuable insights for HVAC (Heating Ventilation and Air Conditioning) system designers, building engineers, and researchers in their efforts to create more efficient and sustainable indoor environments 5.
Jahar Sarkar 6, investigated the airflow and temperature distribution in conditioned space with experimental study and CFD simulation. The experimental study was carried out with single inlet and outlet conditions for airflow and the experimental data was used to validate the CFD simulation results. The findings of the experiment demonstrated that the airflow in conditioned room space was turbulent, and near the inlet variation of velocity was obtained maximum. Very narrow results were obtained with the inline flow inlet, and the deviated results were obtained with the line of flow outlet.
Ting Ya Tsai 7, investigated the indoor environment experimentally using the UFAD system. The results from the experimental work demonstrate that the vertical temperature variation was significantly influenced by the supply air flow rate. Moreover, the temperature profile variation depends on the distance of the discharge air duct and it evidently influenced when the test position was in close proximity to the supply vent.
Wu Xiaozhou 8, study the ventilation effectiveness and stated that the combination of MV (mixing ventilation) system and FC (floor/ceiling) system was equivalent. Additionally, it was noted that the ventilation effectiveness of the combination for DV (displacement ventilation) and FC falls slightly below the recommended value according to ASHRAE standards.
Rahul Khatri 9, examined the variation of temperature within a conditioning room equipped with an integrated system of Earth Air Tunnel Heat Exchanger (EATHE) and air conditioning (AC). The CFD simulation was conducted under three different cases, and the results indicated that placing both systems on the same side provides an improved thermal environment for the end user. Implementation of this recommended configuration resulted in the maximum temperature drop within the shortest possible time.
Xiaofang SHAN 10, conducted the CFD simulation using suitable boundary conditions for airflow temperature to analyse the variations in indoor air temperature during both active and suspended states of the air conditioner. The simulation findings were validated against experimental data, indicating that the optimal operational mode involves an 18minute activation followed by an 8minute deactivation cycle for the air conditioning system, effectively sustaining the air temperature within the inside area. The temperature control mechanism maintains a range between 23.50C and 250C, leading to an additional 11% reduction in cooling power consumption.
Gabriel Guevara 11, the research provides valuable insights into the interplay between real thermal sensation and predicted models. Furthermore, the study's focus on extreme ecological factors, such as excessive humidity, elevated temperature and radiation, underscores its relevance in addressing the challenges posed by varying climatic elements. The inclusion of air-conditioned and free-running classrooms in coastal, highlands, and rainforest regions enhances the applicability of the findings. Overall, this research not only advances our comprehension of thermal comfort but also lays the groundwork for the development of improved standards and strategies for creating more comfortable and sustainable indoor environments across diverse climatic zones.
Dorit Aviv 12, studied the importance of comprehending variables derived from empirical and deterministic methods in indoor air science, thermal comfort, and health. Evaluating the applicability of these variables for predicting thermal comfort and Indoor Air Quality (IAQ) effects, lays the foundation for developing solutions that mitigate negative impacts. In essence, a judicious selection of variables, informed by traditional analytical models, holds the key to enhancing prediction precision, thereby advancing research and fostering the development of targeted solutions for optimizing indoor environments and promoting human well-being.
Ahmet Yüksel 13, reviewed the challenges in thermal comfort, IAQ, and energy use in mosques and churches. It advocates for passive measures in severe climates, explores adaptive models, and emphasizes simultaneous consideration of thermal comfort, IAQ, and energy consumption. Recommendations include localized HVAC, IAQ attention, and energy-saving strategies. The conclusion highlights the lack of long-term measurements, emphasizing the need for specific criteria and procedures for this unique structure.
A healthy and comfortable environment is mostly accepted by the occupants for their office area or residential area. In the present scenario, it observed that a lot of research is going on airflow, air velocity, and temperature distribution in conditioned space for the improvement of the indoor thermal environment. Still, problems related to impure air or indoor air quality, high energy consumption, and secondary pollution generation due to by-products arise frequently.
The present study focused on the dispersion of air temperature in a closed space i.e., test room with different conditions of duct position. The purpose of this study was to look into the allocation of temperature and airflow in the test room at considered test points by experimentally varying the position of the inlet duct vertically without changing the air outlet position. The experimental investigation was performed in the summer and winter seasons respectively and noted the actual temperature, velocity, and humidity at test points considered in the test room. The objective of this paper was to present the comparative study of various parameters with various duct positions in the test room and analyze it with respect to thermal comfort.
Experimental Setup and Methodology
Climatic Conditions
The present investigation was carried out on sunny days inside of the summer and winter seasons in the subtropical climate region of Bhopal, India. The climate of Bhopal is hot in summer, dry and cool in winter, and humid in monsoon. The outside temperature oscillates between 220 C to 400 C in summer while it oscillates 80 C to 260 C in winter season and relative humidity varies from 40 % to 60% 8.
Experimental Test Room Setup
The experimental setup is produced and investigations are carried out on the first floor of the building at the Research Facility Centre of Government Women Polytechnic College, Bhopal, INDIA. It is a college regular room that has been rearranged and developed as a test room for the experiment in this paper. Figure 1 shows the architectural view of the conditioned test room. The test room used for the experimental work has a dimension of 6m x 2m x 3.5m. The test room includes one external solid wall constructed in brick and concrete material along with two internal windows and the other three internal walls were fitted with robust acrylic materials. The total area of the outside wall is 21m2 including the two windows of size 1.2m x 2m each. The window air conditioner is installed in the window which has a position of 2.2m from the left-side wall, 3.8m from the right-side wall, and 1.2m above the ground surface. The circular pipe duct of diameter 0.2m is settled vertically at 2.2m from the left side and 3.8m from the right side with arrangements in such a way that the conditioned air from the conditioner is supplied through it. The circular pipe duct has produced three opening positions a 1.5m distance from each other for the discharge of air as shown in Fig. 1.
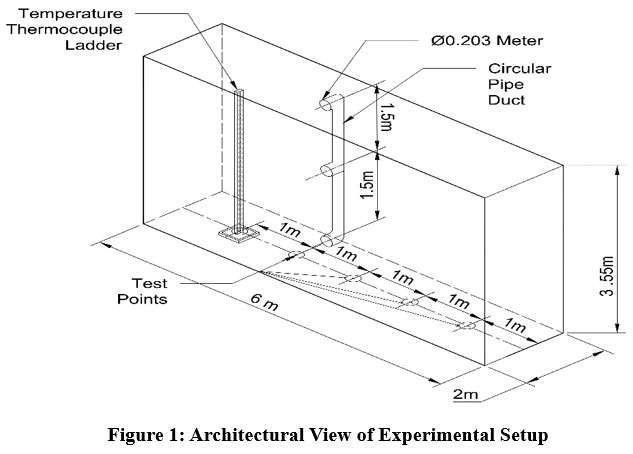 | Figure 1: Architectural View of Experimental Setup
|
Conditioned air supplied through the duct has a facility to flow the air in the test room through one position while the other two positions at closed condition. The 30 thermocouples at a 10cm distance each are fitted on a straight vertical tree structure of 3m height known as a thermocouple ladder as shown in Fig. 1. The test room has a facility to measure the temperature (0C) of air at various test points located in the test room using the thermocouple ladder. The thermocouple sensor ladder is connected to the temperature logger and the temperature logger is connected to the computer as shown in Fig. 2(a). The logger has provision to note the temperature as per the set time of interval and keep a record of it. The temperature logger and its connected computer system are arranged at the outside of the test room to operate and change the time interval.
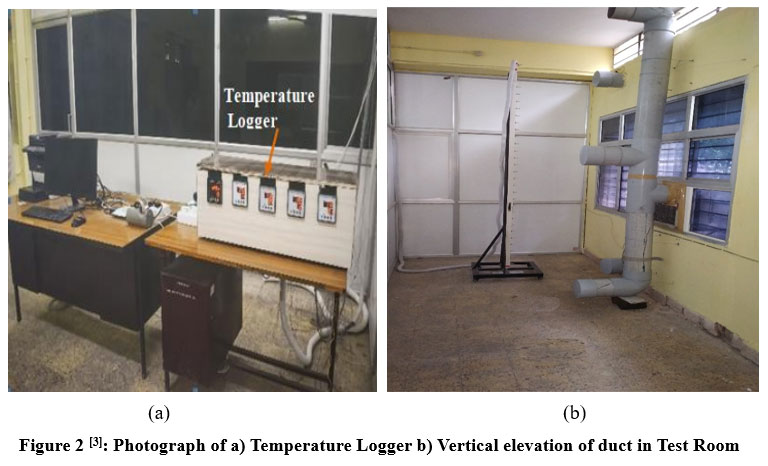 | Figure 2 3: Photograph of a) Temperature Logger b) Vertical elevation of duct in Test Room
|
Measurements Parameter
The air temperature and air velocity were the measuring parameters considered in the test room. These parameters were measured on three different heights lower zone i.e., 0.1m above the ground floor, middle zone i.e., 1.5m above the ground floor and upper zone i.e., 3m from the ground floor. The thermocouple sensor ladder was used to measure the temperature at the test point considered in the test room. The 30 thermocouples 10cm distance each were fitted on a 3m height ladder which was connected with a temperature logger as shown in Fig. 2(a). The accuracy of temperature measurement is about ± 0.20C. The hot wire anemometers were used to measure velocity at the outlet of the duct which has the accuracy of measurement 0.02 m/s. The minimal velocity recorded at the outlet of the duct is 4.5m/s.
Test Conditions
The investigation was conducted in the conditioned room where the conditioned air discharge through the circular pipe duct considering three test conditions of duct position:
The Top Position Duct is open for air Discharge
The Middle Position Duct is open for air Discharge
The Bottom Position Duct is open for air Discharge
The three test points' location conditions were selected in the test room as TP0, TP1, and TP2 to keep the thermocouple ladder to investigate the temperature vertical profile. The test point TP0 location is very close to the discharge air duct which is known as the discharge area, location TP1 is at 1m distance from the discharge duct, and location TP2 is at 2m distance from the discharge duct.
Results and Discussion
This research holds significance for HVAC system designers and building engineers by providing a detailed comparative analysis of various parameters related to different vertical positions of conditioned air ducts. The study systematically explores the impact of these positions on the indoor thermal environment, focusing on three distinct test positions (TP0, TP1, and TP2) at varying distances from the discharge air duct within a controlled room. The test points TP0, TP1, and TP2 show the thermocouple ladder position at very near, 1m distance, and 2m distance from the discharge duct respectively. Through a 30-minute experiment, the research evaluates the vertical temperature profile under different conditions. By shedding light on how duct placement influences temperature distribution, the study contributes valuable insights to the ongoing efforts aimed at creating healthier and more comfortable indoor environments. This includes addressing persistent challenges such as inadequate quality of air and increased energy consumption, ultimately benefiting to the design of engineering HVAC systems.
Top location duct open for air discharge:
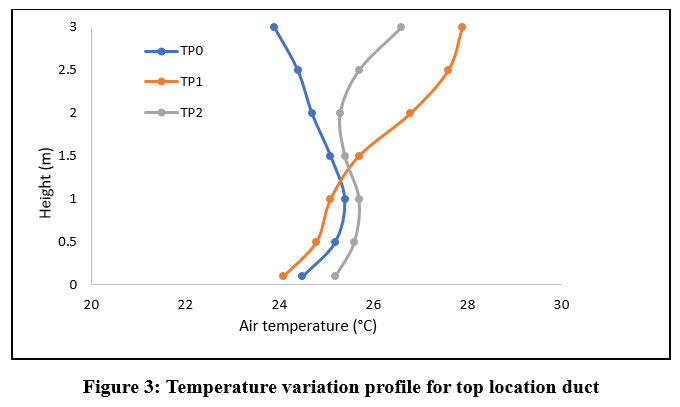 | Figure 3: Temperature variation profile for top location duct
|
A noticeable temperature reduction was observed within the room when conditioned air was discharged from the top location of the duct as shown in Figure 2(b).
As the thermocouple ladder was positioned at TP0 position resulted in a 4.0% more reduction in the upper zone (area above the height of 1.5m) compared to the lower zone (area above the height of 1.5m).
While the ladder was positioned at TP1 the notable temperature reduction of 13.28% occurred more in the lower zone compared to the upper zone and it continuously decreased with an increase in distance.
Middle location duct open for air discharge
The conditioned air was discharged through the middle location of the duct, resulting in temperature reductions of 18.46%, 17.30%, and 17.08% at TP0, TP1, and TP2, respectively.
Interestingly, there was minimal temperature difference between TP1 and TP2 when the middle duct was used to discharge the conditioned air.
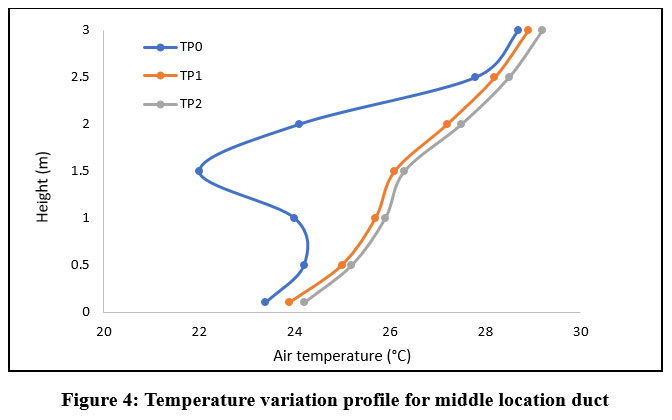 | Figure 4: Temperature variation profile for middle location duct.
|
Bottom location duct open for air discharge
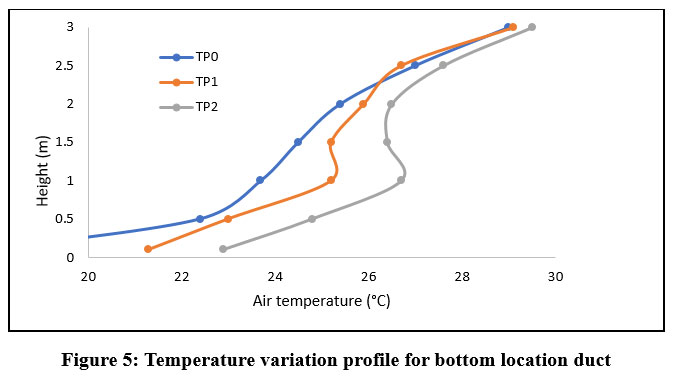 | Figure 5: Temperature variation profile for bottom location duct
|
The bottom location duct served as the outlet for releasing conditioned air into the room, leading to a significant temperature reduction.
At TP0, a remarkable 37.93% decrease in temperature was observed, followed by substantial reductions of 26.80% at TP1 and 22.37% at TP2.
Comparative Analysis
It was noticed that the outside temperature of the test room was approximately 32 degrees Celsius. Once an air conditioner was switched on and began discharging conditioned air into the test room through various ducts, the temperature started to decrease. Notably, the rate of temperature reduction exhibited a gradual decline from the lower zone to the upper zone across all three duct position configurations, as outlined in Table 1.
Table 1: Temperature Variation Comparative for Various Ducts at 30 minutes
Thermal Environmental Investigation Zone (Vertically) | Temperature (0C) according to Discharge air Duct Position | ||
Bottom Location Duct | Middle Location Duct | Top Location Duct | |
Lower Zone (at 0.1 m) | 20.73 | 23.8 | 24.6 |
Middle Zone (at 1.5m) | 25.3 | 24.8 | 25.4 |
Upper Zone (at 3.0m) | 29.2 | 28.9 | 26.13 |
The percentage of temperature reduction when the bottom location duct was open was observed to be 35.21%, 20.93%, and 8.75% for the lower zone, middle zone, and upper zone, respectively. In the case of the middle location duct being open, the recorded percentages were 25.62%, 22.5%, and 9.68% for the same zones. Similarly, with the top location duct open, the temperature reduction percentages were noted as 23.12%, 20.62%, and 18.34% for the lower, middle, and upper zones, respectively.
According to the comparative statistic, the temperature reduction in the bottom and intermediate regions was greater than in the uppermost region. The frequency of temperature reduction showed a gradual decline from the bottom region area to the uppermost area across all three duct positions. It summarized that the thermal zone and the duct position both have an impact on energy consumption, as indicated by the temperature drop.
Conclusion
The test room was equipped with three air conditioning ducts at the bottom, middle, and top positions with adjusting flow passages and instrumentation. The conclusions were made through the investigation as:
The percentage of temperature reduction exhibited a declining trend from the lower zone to the upper zone across all three duct positions. Notably, the temperature reduction was most pronounced when the bottom duct was used, reaching 35.21%, which was significantly higher compared to the other duct locations.
It was observed that the reduction in temperature was consistently 2-3 degrees Celsius higher when the temperature sensor ladder was placed near the conditioning duct. This effect diminished as the sensor was positioned farther away from the duct.
The use of the bottom location duct proved to be particularly effective in achieving temperature reduction in the middle zone, extending up to a height of 1.5 meters from the ground. This outcome suggests the potential for energy consumption reduction within the room.
Acknowledgment
The authors are thankful to LNCT University Bhopal and Government Polytechnic, Bhopal for providing guidance and facilities for experimentation.
Conflict of Interest
The author(s) declares no conflict of interest.
Funding Sources
The author(s) received no financial support for the research, authorship, and publication of this article.
Authors’ Contribution
The corresponding author experimented and analyzed the data, and the second author guided the experiment and provided the inputs to the experiment.
Data Availability Statement
Not applicable
Ethics Approval Statement
In this study experiment was not conducted on humans or animals.
References
- Mahajan Sunil, Bartaria Vishvendranath, “A Review of Research on Air Distribution in Conditioned Spaces and Indoor Air Quality for Human Health”, Journal of Emerging Technologies and Innovative Research (JETIR), February 2019, Volume 6, Issue 2, Pp:320-325, (ISSN-2349-5162).
CrossRef - Mahajan Sunil, Bartaria Vishvendranath, “Indoor Thermal Comfort and Air Distribution: A Literature Review”, Journal of Emerging Technologies and Innovative Research (JETIR), May 2019, Volume 6, Issue 5, Pp: 722-726, (ISSN-2349-5162).
CrossRef - Mahajan Sunil, Bartaria Vishvendranath, “Experimental Study on Impact of Inlet Duct Elevation on the Indoor Thermal Environment”, 2nd International Conference on Innovations in Clean Energy Technologies (ICET- 2023) at MANIT, Bhopal, April 2023.
CrossRef - Mahajan Sunil, Bartaria Vishvendranath, “A review on air distribution and Indoor Thermal Environment”, Voice of Research Journal, March 2021, Vol.9, Issue 4.
CrossRef - Peihao Wu, Zhaosong Fang, “Comparative analysis of indoor air quality in green office buildings of varying star levels based on the grey method”, Building Environment 2021, 195.
CrossRef - Sarkar, Jahar and Mandal, Soumen, “CFD Modelling and Validation of Temperature and Flow Distribution in Air-Conditioned Space”, International Refrigeration and Air Conditioning Conference, July 14-17 (2008), Paper 972.
- Lin, Y.J.P., and T.Y. Tsai “An experimental Study on Indoor Environment using Under Floor Air Distribution System”, Energy and Buildings, 2014 Pp. 263-266.
CrossRef - Wu Xiaozhou, Fang, Lei Olesen, Bjarne Zhao, “Air Distribution and Ventilation Effectiveness in a room with Floor/Ceiling Heating and Mixing/Displacement Ventilation”, Proceedings of the 8th International Symposium on Heating, Ventilation and Air Conditioning, Publication date: 2014. DOI: 10.1007/978-3-642-39584-0_7.
CrossRef - Khatri Rahul, Singh Abhay Pratap, Khare Vaibhav Rai, “Identification of Ideal Air Temperature Distribution using different location for Air Conditioner in a room integrated with EATHE- A CFD approach”, Energy Procedia, 2017
CrossRef - Xiaofang SHAN, Wei-Zhen, Shichang HUI, “Dynamic Performance of Indoor Environment and Energy Consumption of Air Conditioning System under Intermittent Mode”, 10th International Conference on Applied Energy, Energy Procedia, 22-25 August 2018.
- Gabriel Guevara, Guillermo Soriano, “Thermal comfort in university classrooms: An experimental study in the tropics”, Building and Environment, 2021 (187) 107430.
CrossRef - Dorit Aviv, William Braham, “Measuring the right factors: A review of variables and models for thermal comfort and indoor air quality”, Renewable and Sustainable Energy Reviews, 2021 (135) 110436.
CrossRef - Ahmet Yuksel, Michal Krajcik, “A review on thermal comfort, indoor air quality and energy consumption in temples”, Journal of Building Engineering, 2020,102013.
CrossRef - Lucas Franck, Ortega Pascal, David Mathieu, “A Method to evaluate energy performance of building cooled by room air conditioners”, Energy Procedia, 2015, Pp: 1275-1283.
CrossRef - Aghniacy, “Thermal comfort evaluation in campus classroom during room temperature adjustment corresponding to demand response”, Building Environment, 2019 (148) 488-497.
CrossRef - Olesen, Simone, Krajcik, “Experimental study of air distribution and ventilation effectiveness in a room with a combination of different mechanical ventilation and heating/cooling systems”, International Journal of Ventilation 9(4), 2011 Pp: 371-384.
CrossRef - Jindal, “Thermal comfort study in naturally ventilated school classroom in composite climate of India”, Build Environment, 2018, Vol:142,34-46.
CrossRef - Maryam Sarkhosh, Ali Asghar Najafpoor, “Indoor Air Quality associations with sick building syndrome: An application of decision tree technology”, Building Environment, 2021 (188) 107446.
CrossRef - Qiantao Zhao, Zhiwei Lian, “Thermal comfort models and their developments: A review”, Energy and Building Environment 2, 2021, Pp:21-23.
CrossRef


