Comparative Study of Groundwater Quality for Drinking and Irrigation Purposes in Selected Villages of Manipur, India
Ngangbam Premala Devi1
*
 and Laishram Nandababu Singh2
1
Department of Chemistry,
Manipur University,
Canchipur,
Manipur
India
2
Department of Chemistry,
D.M. College of Science, Dhanamanjuri University,
Imphal,
Manipur
India
Copy the following to cite this article:
Singh L. N, Devi N. P. Comparative Study of Groundwater Quality for Drinking and Irrigation Purposes in Selected Villages of Manipur, India. Curr World Environ 2024;19(1).
Copy the following to cite this URL:
Singh L. N, Devi N. P. Comparative Study of Groundwater Quality for Drinking and Irrigation Purposes in Selected Villages of Manipur, India. Curr World Environ 2024;19(1).
Citation Manager Publish History

Introduction
Life on the earth will not be possible without water. Water (H2O) is available in various forms like groundwater and surface water. However, many surface water bodies are diminishing continuously because of the increasing rate of urbanization and expansion of urban areas1. Not only this, the pollution load of many ground water bodies and surface water increases due to anthropogenic activities of the increasing population growth all over the world. Because of the diminishing of many surface waters in many areas of the world, it is needed to explore more groundwater. From the global water resources, groundwater is around 0.6% and out of these resources, around 0.3% is extracted economically2. Unmethodical, quick and unexpected urbanization damage the sustainability of many development processes by changing different environmental factors such as temperature, levels of groundwater and rainfall adversely3. By the consumption of contaminated drinking water continuously, many serious health problems and issues occur to human4. It is highly necessary to comprehend the qualities of groundwater for the effective planning and administration of groundwater resources to determine its use for drinking along with irrigation purposes5. For drinking as well as irrigation (agricultural) purposes, several researchers or scientists reported about quality of groundwaters whether they can be usable or not, in many countries of the world6-9. Similarly in India also, many researchers or scientists had reported about groundwater qualities for drinking as well as irrigation/agricultural purposes10-13. Many researchers have also computed WQI for examining the suitability of different groundwaters for drinking purposes14-17.
In Imphal East district, Manipur, India, many of the villagers are very much dependent on the groundwaters for their livelihood as they do not have the facilities of treated water supply, tap-water system etc. for drinking purposes mainly. Therefore, this work attempts to execute a comparative study of groundwaters in some villages of Imphal East district, Manipur, India for drinking as well as irrigation/agricultural purposes during pre-monsoon and monsoon (2021).
Study areas
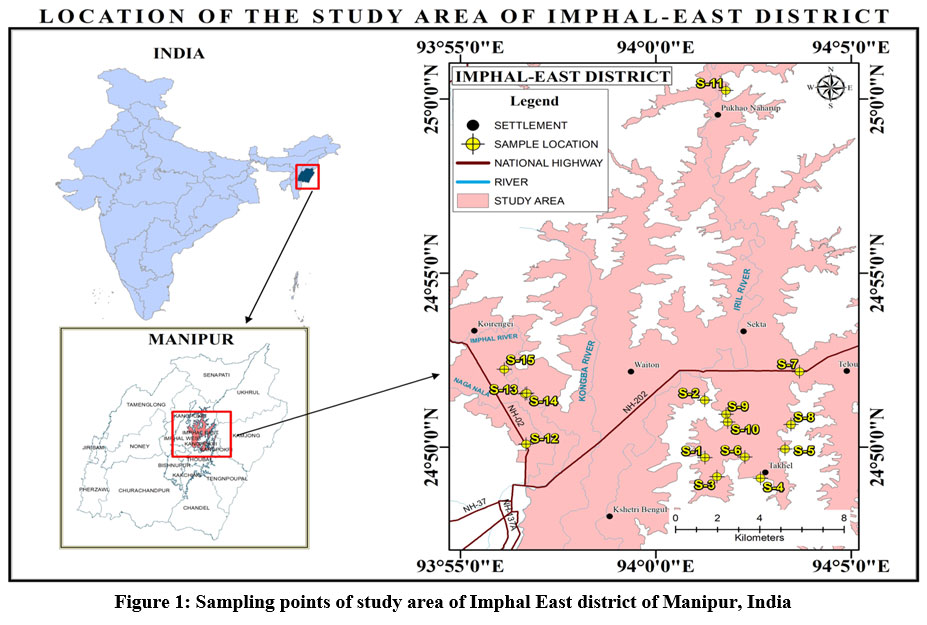
Imphal East district is located at Manipur, India. As per 2011 census18, the total area of this district is nearly 709 Km2 and it has a population of 4,56,113 including both males and females and also the district lies between latitudes 24°39'49.09''N and 25°4'5.45''N and longitudes 93°55'30''E and 94°8'42''E approximately. The location of study areas (longitudes and latitudes) along with depth of the tube wells (meter) are listed in table-1. The geographical positions of different sampling sites were measured by GPS instrument. The location map (sampling points) of the study areas of Imphal East District, Manipur, India is shown in fig.1.
Table-1: Locations of study areas with geographical positions
Sample no. | Sampling Sites | Longitudes | Latitudes | Depth of the tube wells (m) |
S-1 | Sangshabi mayai leikai (1) (near waiting shed and main road) | 94°1'15.9''E | 24°49'41.6''N | 47 |
S-2
| Sangshabi mayai leikai (2) (near foothill) | 94°1'15.4''E | 24°51'20.6''N | 56 |
S-3 | Sanjembam khullen awang leikai | 94°1'34''E | 24°49'9.1''N | 50 |
S-4 | Takhel youngdong (near foothill and paddy field) | 94°2'41.2''E | 24°49'6.2''N | 56 |
S-5
| Kangba chingjil khunou (1) (near club and house gate) | 94°3'18.9''E | 24°49'56.4''N | 51 |
S-6
| Kangba chingjil khunou (2) (near foothill) | 94°2'17.1''E | 24°49'42.9''N | 55 |
S-7
| Kangba chingjil khullen (near community hall and anganwadi centre) | 94°3'41''E | 24°52'9.9''N | 53 |
S-8
| Kangba chingjil (near foothill and temple) | 94°3'27.9''E | 24°50'38.8''N | 49 |
S-9
| Kharason awang leikai (near banyan tree) | 94°1'48.''E | 24°50'56.3''N | 52 |
S-10
| Kharason makha leikai (near foothill) | 94°1'50.7''E | 24°50'43.2''N | 55 |
S-11
| Pukhao Terapur (near foothill) | 94°1'47.7''E | 25°0'14.6''N | 56 |
S-12
| Poumai colony (near church) | 93°56'40.73''E | 24°50'5.15''N | 59 |
S-13
| Heingang mayai leikai (1) (near footpath) | 93°56'39.59''E | 24°51'31.83''N | 60 |
S-14
| Heingang mayai leikai (2) (near rice mill of N. Mangoljao) | 93°56'41.88''E | 24°51'32.71''N | 52 |
S-15
| Heingang awang leikai (3) (near community hall and foothill) | 93°56'7.47''E | 24°52'14.00''N | 58 |
 | Figure 1: Sampling points of study area of Imphal East district of Manipur, India.
|
Material and Methods
Altogether fifteen (15) groundwaters were selected from different hand pumps (tube wells) of some villages of Imphal East district, Manipur, located mainly near the foothills and agricultural areas during the time of pre-monsoon and monsoon seasons of 2021. The selected groundwater samples are extensively used by the local inhabitants for drinking, other domestic and irrigation purposes. Each sample was collected in a well sterilized polythene bottle in the morning session starting from around 8.00 a.m. Before sampling, all the sterilized bottles were rinsed with the groundwater, which is to be collected. Sampling and preservation of groundwater samples were done as per guidelines of APHA19. Temperature (°C), pH and TDS were examined at the sampling locations whereas TH, Na+, TA, Mg2+, K+, CO32-, Cl-, SO42-, HCO3-, Ca2+ and NO3- were analysed at research lab by following the protocols and standard methods, as given by APHA19. The chemical reagents such as HCl, NH4OH, methyl orange indicator, disodium salt of EDTA, N/50 AgNO3 solution, NaOH, NH4OH, NH4Cl, MgSO4.2H2O, NaCl, KCl, phenolphthalein indicator, HNO3, H2SO4, conditioning reagent, BaCl2, arsenite solution and brucine-sulphanilic acid were used. Detailed methods and instruments which are utilized for determining the different parameters are listed as follows (table-2).
Table-2: Detailed methods and instruments for determining the different parameters
| Sl. No. | Studied parameters | Instruments and detailed method |
| 1 | Temp. (°C) and TDS | TDS Meter - (TDS/Temp.) from (HIMEDIA by India) was utilized for measuring temp. (°C) along with TDS. |
| 2 | pH | pH Meter – (HI98107) was used for determining pH values. |
| 3 | TH | TH was obtained by EDTA titrimetric, in which EBT indicator was used. |
| 4 | TA | TA was determined by titration with standard HCI solution. Here, methyl orange indicators as well as phenolphthalein were used. |
| 5 | Ca2+ | ‘EDTA - titrimetric method’ in which murexide indicator was utilized. |
| 6 |
| ‘calculation method’
|
| 7 | Na+ and K+ | ‘Flame Photometer-128’ of Systronics, India was utilized. |
| 8 | Cl- | Argentometric titration was used. |
| 9 | SO42- and NO3- | UV/ Visible spectrophotometer was used. |
Computing of “Water Quality Index”
WAWQI/Weighted Arithmetic Water Quality Index is utilized. 5 (five) types of WQI values/ranges are divided in which WQI value of less than 25 is entitled as ‘excellent’, (26 upto 50) is termed as ‘good’, (51 upto 75) is treated as ‘poor’, (76 upto 100) is called as ‘very poor’ and greater than 100 is termed as ‘unfit’ for drinking purposes20.
Mathematically, WQI is calculated from eq.-(1).
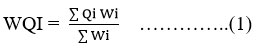
Here, Qi is quality rating scale and Wi is called as Unit weight of an ith parameter.
Again, Qi is expressed using eq.-(2).
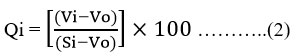
Here, Vi is experimental value of an ith parameter, Vo is Zero (0) except for the pH value of 7.0 and lastly, Si is known as recommended values of an ith parameter.
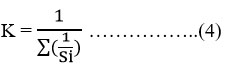
Also, Wi is derived using eq.-(3).
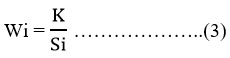
Here, K is termed as proportionality constant, obtained from eq.-(4).
“Irrigation water quality assessment”
The following parameters were evaluated for determining the suitability of irrigation water qualities for the present research work. The ionic concentration, which were required for computing RSC, SAR, %Na, PI and KI are taken as ‘meq/L’.
RSC/Residual Sodium Carbonate
RSC values are calculated from eq.-(5) and its value/range is divided into 3 (three) classes21:
(a) RSC value which is less than 1.25 falls under good water quality,
(b) RSC ranges (1.25 - 2.50) falls under marginal or doubtful water quality and
(c) RSC value which is greater than 2.50 falls under unsuitable for irrigation purposes.

Sodium adsorption ratio or SAR
By using eq.-(6), SAR value is obtained and also its value is classified into 4 (four) classes22:
(a) SAR < 10 - excellent water quality,
(b) SAR of 10 upto 18 - termed as good water quality,
(c) SAR of 18 upto 26 - doubtful,
(d) SAR > 26 - named as unfit for irrigation purposes.
Percent sodium/%Na
The %Na is evaluated from eq.-(7) and also %Na value is divided into 5 (five) classes22:
(a) %Na < 20% - excellent water quality,
(b) %Na ranges (20 – 40)% as good water quality,
(c) %Na ranges (40 – 60)% fall under permissible,
(d) %Na values (60 – 80)% fall under doubtful,
(e) %Na values > 80% is named as unfit/unsuitable for irrigation purposes.
Permeability index or PI
The formula of PI is given in eq.-(4) and PI value range is classified into 3 (three) types23:
(a) PI values > 75% - suitable,
(b) PI ranges (25 – 75)% - good water quality
(c) PI values < 25% is termed as unfit/unsuitable for irrigation purposes.
.jpg)
Kelly’s ratio or KR
KR is obtained from eq.-(5) for which KR (suitable) and KR (unsuitable) for irrigation24:
Results and Discussion
Table-3a (pre-monsoon) and table-3b (monsoon) showed the values or concentrations of different physico-chemical parameters for fifteen (15) groundwater samples. Table-3c showed the descriptive summary along with BIS25 and WHO26 standards value. All the studied groundwaters were observed to be colourless as well as odourless.
Temperature (°C)
During pre-monsoon, the temperatures of the groundwaters are in the range (21.50°C - 24.6°C) and (mean value = 23.21°C) whereas in monsoon, they are in the ranges (23.6°C - 27.4°C) and (mean value = 25.19°C) (table-3c). Temperature affects the groundwater qualities in various ways, both in biological as well as physical process. The increase in temperature during the monsoon season is due to the prevailing of the summer season which gets more heating effect during this period and more disposals of organic waste products as compared to that of pre-monsoon.
pH
During pre-monsoon, 7.1 (each of S-1, S-2 and S-13) and 7.9 (each of the S-7, S-11, S-9) are the smallest and greatest pH values respectively in which (mean value = 7.51) whereas in monsoon, 7.4 (S-12) and 8.3 (each of S-9, S-11) are the smallest and maximal pH values respectively and (mean value = 7.79) (table-3c). Due to more leaching of alkaline substances by heavy rainfall into groundwaters during the time of monsoon, pH value of groundwaters becomes higher as compared to that of pre-monsoon. pH values for S-1 to S-15 in both seasons are found within its acceptable limit, as given by BIS and WHO for drinking water25-26.
Table-3a: Values of physico-chemical parameters (mg/L), except pH and temp. (°C) for pre-monsoon
Sam-ple no. | Temp.
| pH | TDS
| TH-CaCO3 | TA-CaCO3 | Ca2+
| Mg2+
| Na+
| K+
| Cl- | SO42-
| NO3-
| HCO3- |
S-1 | 23.8 | 7.1 | 187 | 128 | 212 | 17.6 | 20.4 | 24.7 | 0.9 | 5.7 | 11.8 | 0.3 | 258.6 |
S-2 | 22.8 | 7.1 | 170 | 152 | 185.5 | 20.8 | 24.3 | 18.4 | 0.7 | 7.1 | 12.4 | 0.3 | 226.3 |
S-3 | 23.4 | 7.3 | 480 | 86 | 477 | 13.6 | 12.6 | 194.0 | 1.5 | 32.6 | 14.5 | 2.2 | 581.9 |
S-4 | 22.5 | 7.6 | 288 | 210 | 323.3 | 32.1 | 31.6 | 52.9 | 1.3 | 5.7 | 11.1 | 0.1 | 394.4 |
S-5 | 23.4 | 7.8 | 323 | 94 | 328.6 | 14.4 | 14.1 | 106.2 | 1.4 | 8.5 | 16.8 | 0.6 | 400.9 |
S-6 | 24.2 | 7.7 | 310 | 180 | 307.4 | 32.9 | 23.8 | 59.9 | 1.7 | 17.0 | 27.7 | 1.4 | 375.0 |
S-7 | 24.6 | 7.9 | 381 | 116 | 275.6 | 23.2 | 14.1 | 104.2 | 1.7 | 82.2 | 13.7 | 0.6 | 336.2 |
S-8 | 23.6 | 7.6 | 289 | 104 | 302.1 | 16.8 | 15.1 | 85.0 | 1.3 | 8.5 | 13.4 | 0.4 | 368.6 |
S-9 | 21.5 | 7.9 | 281 | 90 | 275.6 | 23.2 | 7.8 | 79.1 | 1.3 | 19.9 | 13.1 | 0.7 | 336.2 |
S-10 | 21.7 | 7.6 | 309 | 122 | 302.1 | 24.0 | 15.1 | 81.3 | 1.0 | 26.9 | 12.0 | 1.7 | 368.6 |
S-11 | 24.3 | 7.9 | 193 | 158 | 201.4 | 26.5 | 22.4 | 16.0 | 0.9 | 4.3 | 11.8 | 0.5 | 245.7 |
S-12 | 22.9 | 7.2 | 397 | 128 | 413.4 | 29.7 | 13.1 | 105.6 | 1.2 | 9.9 | 12.4 | 6.3 | 504.3 |
S-13 | 22.9 | 7.1 | 277 | 100 | 275.6 | 17.6 | 13.6 | 60.6 | 1.5 | 15.6 | 11.0 | 6.6 | 336.2 |
S-14 | 23.3 | 7.2 | 291 | 112 | 296.8 | 18.4 | 16.0 | 76.7 | 1.6 | 19.9 | 11.1 | 4.1 | 362.1 |
S-15 | 23.2 | 7.6 | 215 | 150 | 227.9 | 26.5 | 20.4 | 30.2 | 0.9 | 5.7 | 11.0 | 0.3 | 278.0 |
TDS/Total dissolved solids (mg/L):
In pre-monsoon, TDS values for all the fifteen (15) groundwaters varies from 170.0 mg/L of S-2 to 480.0 mg/L of S-3 with (mean value = 292.73 mg/L) whereas during monsoon, its value are in the ranges (141.0 – 489.0) mg/L with (mean value = 287.33 mg/L) (table-3c). S-11 and S-3 are the smallest and maximal TDS values respectively in monsoon (table-3b). All the values of TDS are found within its acceptable limit, as given by BIS and WHO standard25-26 in both the seasons (table-3c). S-3 (monsoon) has the highest TDS value (489 mg/L). All the studied samples belong to the category of ‘fresh water’ since the TDS values is less than 1000 mg/L22. Because of the dissolution of more soluble substance from earth’s crust by the heavy rain, TDS values during the time of monsoon becomes higher as compared to that of pre-monsoon. Consumption of water having high TDS value may cause kidney stones and heart diseases to the person.
Total hardness/TH (mg/L):
In pre-monsoon, values of TH are in the range (86 – 210) mg/L and (mean = 128.67 mg/L) while in monsoon, its values are in the range (84 – 200) mg/L and (mean = 136.93 mg/L) (table-3c). S-3 and S-4 are the minimal and greatest TH values in pre-monsoon whereas S-3 and S-6 are the lowest and maximal in monsoon respectively. In S-4 (pre-monsoon), TH value is found below its permissible limit (600 mg/L) but above its acceptable limit of BIS25. But, the TH values of other groundwater samples have found within its acceptable limit, as given by BIS25. According to Sawyer and McCarty27 (groundwaters classification by TH values), it is found that in pre-monsoon, 73.33% of groundwaters falls under ‘moderately hard water’ and 26.67% belongs to ‘hard water category’ (table-3a) whereas in monsoon, 60% of samples fall under moderately hard water and remaining 40% belongs to hard water category (table-3b). Hard water is not suggested for home usages as it may cause metal dissolution and also leads to abrasive coatings under pipelines, heaters and drums28.
Table-3b: Values of physico-chemical parameters (mg/L), except pH and temp. (°C) for monsoon
Sam-ple no. | Temp.
| pH | TDS
| TH-CaCO3 | TA-CaCO3 | Ca2+
| Mg2+
| Na+
| K+ | Cl- | SO42-
| NO3- | HCO3- |
S-1 | 25.3 | 7.6 | 191 | 158 | 212 | 19.2 | 26.7 | 25.7 | 0.7 | 4.3 | 12.2 | 4.0 | 258.6 |
S-2 | 25.7 | 8.0 | 185 | 162 | 201.4 | 20.0 | 27.2 | 20.4 | 0.7 | 5.7 | 17.3 | 3.9 | 245.7 |
S-3 | 25.5 | 7.5 | 489 | 84 | 503.5 | 10.4 | 14.1 | 190.8 | 1.5 | 29.8 | 13.3 | 6.4 | 614.3 |
S-4 | 25.6 | 7.8 | 279 | 180 | 312.7 | 24.8 | 28.7 | 59.9 | 1.2 | 7.1 | 13.6 | 0.1 | 381.5 |
S-5 | 27.4 | 7.8 | 321 | 108 | 344.5 | 16.0 | 16.5 | 102.2 | 1.3 | 7.1 | 16.3 | 8.2 | 420.3 |
S-6 | 26.7 | 7.9 | 313 | 200 | 318 | 32.1 | 29.2 | 66.2 | 1.5 | 4.3 | 30.9 | 6.2 | 388.0 |
S-7 | 24.4 | 7.8 | 362 | 136 | 291.5 | 24.8 | 18.0 | 102.9 | 1.4 | 65.2 | 15.8 | 5.8 | 355.6 |
S-8 | 24.6 | 7.8 | 287 | 110 | 318 | 16.0 | 17.0 | 89.1 | 1.2 | 7.1 | 15.3 | 4.7 | 388.0 |
S-9 | 23.6 | 8.3 | 283 | 112 | 318 | 20.8 | 14.6 | 90.8 | 2.0 | 18.4 | 15.9 | 6.7 | 388.0 |
S-10 | 25.1 | 8.0 | 284 | 130 | 307.4 | 20.0 | 19.4 | 92.5 | 0.8 | 24.1 | 12.1 | 6.7 | 375.0 |
S-11 | 25.2 | 8.3 | 141 | 126 | 159 | 15.2 | 21.4 | 16.8 | 1.0 | 4.3 | 13.1 | 10.7 | 194.0 |
S-12 | 25.4 | 7.4 | 396 | 170 | 429.3 | 26.5 | 25.3 | 104.8 | 1.1 | 8.5 | 14.7 | 9.9 | 523.7 |
S-13 | 23.7 | 7.7 | 278 | 106 | 286.2 | 16.8 | 15.6 | 75.0 | 1.4 | 9.9 | 13.2 | 12.7 | 349.2 |
S-14 | 23.8 | 7.5 | 289 | 112 | 302.1 | 15.2 | 18.0 | 77.5 | 1.4 | 11.3 | 16.6 | 13.0 | 368.6 |
S-15 | 25.8 | 7.5 | 212 | 160 | 243.8 | 21.6 | 25.8 | 33.4 | 0.8 | 5.7 | 27.9 | 3.7 | 297.4 |
Total alkalinity/TA (mg/L):
In pre-monsoon, total alkalinity values are in the range (185.50 – 477.0) mg/L in which (mean = 293.620 mg/L) whereas for monsoon, they are in the range (159.0 - 503.5) mg/L in which (mean value = 303.16 mg/L) (table-3c). For pre-monsoon, S-2 and S-3 have the smallest and maximal TA values respectively whereas in monsoon, S-11 and S-3 possess the minimal and greatest TA values respectively. Except S-2 (pre-monsoon) and S-11 (monsoon), all other remaining samples have their total alkalinity values greater than its desirable limit of BIS25, however, they are observed below 600 mg/L (permissible limit) of BIS25. For both seasons, most of the groundwaters of Imphal East district have high values of TA which is mainly due to the leaching of certain minerals and salts in the soil. In water (H2O), alkalinity occurs because of the presence of CO32-, HCO3- and OH- (hydroxide) components in a raw or treated water supply and among these, HCO3- is the major one which is due to the CO2 action on basic materials of soil29.
Ca2+/Calcium (mg/L):
In pre-monsoon, concentrations of Ca2+ for the fifteen groundwaters varies from 13.60 mg/L (S-3) to 32.90 mg/L (S-6) and (mean = 22.49 mg/L) whereas in monsoon, its concentration ranges from 10.40 mg/L (S-3) to 32.10 mg/L (S-6) with (mean value = 19.96 mg/L) (table-3c). For both the seasons, concentrations of Ca2+ are observed within its desirable limit as suggested by BIS25. In groundwaters, Ca2+ is found to be very common due to its abundance in most of the rocks and higher solubility and also it is one of the important elements for developing proper bone growth30.
Table-3c: Descriptive summary along with BIS (acceptable limit) and WHO (standard)
Para- meters |
Pre-monsoon |
Monsoon |
BIS
|
WHO
| ||||||
Ranges/ values |
Mean values |
S.D values |
Standard Error values |
Ranges/ values |
Mean values |
S.D values |
Standard Error values | |||
Temp. (oC) | 21.5 - 24.6 | 23.21 | 0.88 | 0.23 | 23.6 - 27.4 | 25.19 | 1.06 | 0.27 | - | - |
pH | 7.1 - 7.9 | 7.51 | 0.31 | 0.08 | 7.4 - 8.3 | 7.79 | 0.28 | 0.07 | 6.5 - 8.5 | 6.5 - 8.5 |
TDS (mg/L) | 170 - 480 | 292.73 | 83.61 | 21.59 | 141 - 489 | 287.33 | 87.37 | 22.56 | 500 | 600 |
TH (mg/L) | 86 - 210 | 128.67 | 35.40 | 9.14 | 84 - 200 | 136.93 | 33.02 | 8.53 | 200 | - |
TA (mg/L) | 185.5 - 477 | 293.62 | 76.80 | 19.83 | 159 - 503.5 | 303.16 | 85.32 | 22.03 | 200 | - |
Ca2+ (mg/L) | 13.6 - 32.9 | 22.49 | 6.17 | 1.59 | 10.4 - 32.1 | 19.96 | 5.47 | 1.41 | 75 | - |
Mg2+ (mg/L | 7.8 - 31.6 | 17.63 | 6.06 | 1.57 | 14.1 - 29.2 | 21.17 | 5.43 | 1.40 | 30 | - |
Na+ (mg/L) | 16 - 194 | 72.99 | 45.64 | 11.79 | 16.8 - 190.8 | 76.53 | 44.22 | 11.42 | - | 200 |
K+ (mg/L) | 0.70 - 1.70 | 1.26 | 0.32 | 0.08 | 0.7 – 2.0 | 1.2 | 0.36 | 0.09 | - | - |
Cl- (mg/L) | 4.3 - 82.2 | 17.97 | 19.70 | 5.09 | 4.3 - 65.2 | 14.19 | 16.06 | 4.15 | 250 | 250 |
SO42- (mg/L) | 11 - 27.7 | 13.59 | 4.21 | 1.09 | 12.1 -30.9 | 16.55 | 5.49 | 1.42 | 200 | 250 |
NO3- (mg/L) | 0.1 - 6.6 | 1.74 | 2.18 | 0.56 | 0.1 - 13.0 | 6.847 | 3.55 | 0.92 | 45 | 50 |
HCO3- (mg/L) | 226.3 - 581.9 | 358.2 | 93.69 | 24.19 | 194 - 614.3 | 369.86 | 104.1 | 26.88 | - | - |
Mg2+/Magnesium (mg/L)
In pre-monsoon, concentrations for Mg2+ of the studied groundwaters varies between 7.80 mg/L of S-9 and 31.60 mg/L of S-4 having (mean value = 17.63 mg/L) whereas in monsoon, its concentration are in the range (14.1 - 29.2) mg/L having (mean value = 21.17 mg/L) (table-3c). In case of S-4 (pre-monsoon) (table-3a), the concentration of Mg2+ is observed above 30 mg/L (acceptable limit) of BIS25, however, its concentration is observed within 100 mg/L (permissible limit). But, all other groundwaters have found below its acceptable limit of BIS25 in both the seasons.
Na+/Sodium (mg/L)
It is one of the alkali metals which usually found in all the groundwaters. In pre-monsoon, concentrations of Na+ in the groundwaters are in the range (16.0 - 194.0) mg/L having (mean = 72.99) (table-3c) while, in monsoon, its concentration are in the range (16.8 - 190.8) mg/L having (mean = 76.53 mg/L) (table-3c). There is no huge difference in the variation of Na+ concentration among the two seasons. Main source of Na+ present in the groundwaters of Imphal East district comes from the agricultural by-products, municipal waste waters, industrial effluents etc. Concentrations of Na+ of all the samples, for both the seasons are found below its threshold limit of WHO26. For cations group, sodium is observed as the dominant ion in both seasons, as is evident from mean abundance values (table-3c).
K+/Potassium (mg/L)
In pre-monsoon, concentrations of K+ of the groundwaters are in the range, 0.70 – 1.70 mg/L in which (mean = 1.26) whereas they are in the range (0.70 – 2.0) mg/L in which (mean = 1.20) in monsoon (table-3c). Among fifteen groundwater samples, the highest value of the concentration of K+ (2.0 mg/L) is found in case of S-9 during monsoon (table-3b). The concentrations of K+ are found very low in both the seasons as compared to other ions.
Cl-/Chloride (mg/L)
For pre-monsoon, concentrations of Cl- varies from 4.30 upto 82.20 mg/L and (mean = 17.97) whereas in monsoon, its concentrations varies from 4.30 upto 65.20 mg/L and (mean = 14.19) (table-3c). The concentrations of Cl- for all the studied samples have found below its acceptable limit as per BIS and WHO standard for drinking water25-26. In this study, the main sources of Cl- contamination in groundwater is may be due to domestic wastes products.
SO42-/Sulphate (mg/L)
In pre-monsoon, SO42- concentrations (S-1 to S-15) varies from 11.0 upto 27.70 mg/L and (mean = 13.59) while in monsoon period, its concentrations are in the range (12.1 - 30.9) mg/L in which (mean = 16.55) (table-3c). For both the two seasons, concentrations of SO42- are observed within the desirable limits of both BIS and WHO standard value25-26. There is no drastic difference in the concentrations of SO42- during pre-monsoon and monsoon season. In human and animal bodies, levels of both methaemoglobin and sulphaemoglobin are altered when SO42- is taken in larger contents through the dietary absorption31.
NO3-/Nitrate (mg/L)
For pre-monsoon, NO3- concentrations range from 0.10 upto 6.60 mg/L and (mean of 1.74) whereas its concentration varies from 0.10 upto 13.0 mg/L and mean of 6.847mg/L in monsoon (table-3c). In this study area, NO3- concentrations (S-1 to S-15) were observed within the desirable limit of BIS and WHO standard value25-26 (table-3c). There is higher concentration of NO3- in the groundwaters of monsoon than in pre-monsoon which may be caused by the contamination of more chemical fertilizers, animal wastes and industrial wastes. Consumption of drinking water which has high concentrations of NO3- can cause various diseases like methemoglobinemia (MetHb), enlargement of thyroid gland, cancer and diabetes mellitus32.
CO32-/ Carbonate and HCO3-/ Bicarbonate (mg/L)
Concentrations of CO32- for S-1 to S-15 are found as 0 (zero) in both the two seasons. But, the concentrations of HCO3- are in the range (226.30 - 581.90) mg/L and (mean = 358.20 mg/L) in pre-monsoon whereas they are in the range (194 - 614.3) mg/L and (mean value = 369.86 mg/L) in monsoon.
Values and concentrations of studied parameters are observed to be greater during the time of monsoon as compared to that of pre-monsoon (tables-3a and 3b). This shows that the groundwaters of monsoon season are more polluted than pre-monsoon. It is mainly due to the leaching out of the soluble salts/minerals from the earth’s crust by rainwater and finally mingled with the groundwater bodies in the aquifers during the monsoon season.
“Computing of WQI values”
In order to calculate the WQI values, ten (10) parameters were considered and its standards (Si), unit weight (Wi) and recommended agency are shown below in table-4a. In pre-monsoon, WQI value ranges from 19.705 (S-13) to 52.206 (S-11) while in monsoon, its value ranges from 38.636 (S-3) to 66.920 (S-11) (table-4b). Further, in pre-monsoon, 26.67% of groundwaters belongs to excellent water quality, 66.67% (good water) and other 6.66% have poor water while in monsoon, 60% (good water quality) and 40% (poor water quality) (table-4c). As compared to that of pre-monsoon, there is a significant increase in the values of WQI of all the groundwaters during monsoon except (S-7), which is due to its higher values/concentrations of the various studied parameters during monsoon. Finally, from table-4c, it can be said that all studied groundwaters are regarded as ‘appropriate’ for drinking purposes.
Table-4a: Standards (Si) and Unit Weight (Wi) for computing WQI values
| Sl. no. | Parameters (mg/L) | Standards (Si) | Unit Weight (Wi) | Approved agencies | |
| 1 | pH | 6.5-8.5 | 0.11765 | 0.55354 | BIS/WHO |
| 2 | TDS | 500 | 0.002 | 0.00941 | BIS |
| 3 | TH | 200 | 0.005 | 0.02353 | BIS |
| 4 | TA | 200 | 0.005 | 0.02353 | BIS |
| 5 | Ca2+ | 75 | 0.01333 | 0.06273 | BIS |
| 6 | Mg2+ | 30 | 0.03333 | 0.15684 | BIS |
| 7 | Na+ | 200 | 0.005 | 0.02353 | WHO |
| 8 | Cl- | 250 | 0.004 | 0.01882 | BIS |
| 9 | SO42- | 200 | 0.005 | 0.02353 | BIS |
| 10 | NO3- | 45 | 0.02222 | 0.10456 | BIS |
Total EWi = 1 | |||||
Table 4b: WQI values (S-1 to S-15) for both seasons
Sl. no. |
Sample no. |
Pre-monsoon |
Monsoon | ||||
| WQI values | rank of quality of water | grading | WQI values | rank of quality of water | grading | ||
| 1 | S-1 | 20.721 | Excellent | A | 43.825 | Good | B |
| 2 | S-2 | 22.909 | Excellent | A | 58.811 | Poor | C |
| 3 | S-3 | 29.530 | Good | B | 38.636 | Good | B |
| 4 | S-4 | 48.981 | Good | B | 53.862 | Poor | C |
| 5 | S-5 | 45.327 | Good | B | 48.766 | Good | B |
| 6 | S-6 | 48.826 | Good | B | 60.460 | Poor | C |
| 7 | S-7 | 49.993 | Good | B | 49.951 | Good | B |
| 8 | S-8 | 38.076 | Good | B | 47.696 | Good | B |
| 9 | S-9 | 45.457 | Good | B | 65.887 | Poor | C |
| 10 | S-10 | 39.308 | Good | B | 57.366 | Poor | C |
| 11 | S-11 | 52.206 | Poor | C | 66.920 | Poor | C |
| 12 | S-12 | 26.755 | Good | B | 41.769 | Good | B |
| 13 | S-13 | 19.705 | Excellent | A | 44.592 | Good | B |
| 14 | S-14 | 24.776 | Excellent | A | 38.760 | Good | B |
| 15 | S-15 | 40.470 | Good | B | 40.518 | Good | B |
Table 4c: Summary classification of WQI values for both seasons
WQI value range |
Water quality status
|
Pre-monsoon |
Monsoon | ||||
| Groundwater code no. | Total samples | %
| Groundwater code no. | Total samples | % | ||
| (0 – 25) | Excellent | S-1, S-2, S-13, S-14 | 4 | 26.67 | 0 | 0 | 0 |
| (26 – 50) | Good | S-3, S-4, S-5, S-6, S-7, S-8, S-9, S-10, S-12, S-15 | 10 | 66.67 | S-1, S-3, S-5, S-7, S-8, S-12, S-13, S-14, S-15 | 9 | 60 |
| (51 – 75) | Poor | S-11 | 1 | 6.66 | S-2, S-4, S-6, S-9, S-10, S-11 | 6 | 40 |
| (76 – 100) | Very poor | 0 | 0 | 0 | 0 | 0 | 0 |
| > 100 | Unsuitable | 0 | 0 | 0 | 0 | 0 | 0 |
“Evaluation of Irrigation water quality”
Table-5a shows the evaluated values of studied parameters for monitoring the suitability of different groundwaters for irrigation whereas table-5b shows its water quality classification.
Residual sodium carbonate or RSC
The RSC values range from 0.67 meq/L to 7.82 meq/L and (mean value = 3.298 meq/L) in pre-monsoon whereas its values are in the range (0.66 - 8.39) meq/L and (mean value = 3.325 meq/L) in monsoon (table-5a). In case of RSC values, majority of the studied groundwaters are found very high (RSC > 2.50 meq/L) in both the seasons and therefore they cannot be granted/suitable for irrigation (agricultural) purposes21 (table-5b).
Sodium adsorption ratio or SAR
In pre-monsoon, values of SAR are in the range (0.55 - 9.11) and (mean value = 3.009) whereas during monsoon, its value ranges from 0.65 to 9.06 and (mean value = 3.023) (table-5a). In both seasons, all the values of SAR falls under ‘excellent water quality’ (SAR < 10) (table-5b) for irrigation purposes and hence all of them can be used for irrigation (agricultural) purposes22.
Percent sodium/%Na
For pre-monsoon, %Na varies from 18.51% to 83.17% and (mean value = 51.375%) whereas in monsoon, %Na are in the range (21.86% - 83.24%) and (mean value = 51.208%) (table-5a). For both the seasons, the %Na value of S-3 is found greater than 80% while all other remaining samples have their values of %Na below 80% (table-5b). Thus, except S-3, all the remaining groundwaters can be used for irrigation (agricultural) purposes22.
Permeability index/PI
In pre-monsoon, the PI in the fifteen groundwaters ranges from 70.01% to 113.5% having mean value of 94.745% while during monsoon, it ranges from 70.21% to 115% having mean value of 92.701% (table-5a). The result indicates that the studied groundwaters for both seasons, can be used for irrigation purposes23.
Kelly’s ratio/KR
In case of KR for the fifteen samples, its lowest values are found to be 0.2 (S-11) and 0.3 (each of S-2 and S-11) in pre-monsoon and monsoon respectively (table-5a). However, S-3 has the highest values of KR in both the seasons (4.9 each) (table-5a). The groundwaters (S-1, S-2, S-4, S-6, S-11 and S-15) are observed to be granted for irrigation (KR ?1) while other groundwaters (S-3, S-5, S-7 to S-10, S-12, S-13 and S-14) are taken as unsuitable for irrigation/agricultural purposes (KR ?1) of both the two seasons24 (table-5b).
From table-5b, it is seen that all the groundwaters are fit/granted for irrigation/agricultural uses, based on SAR, %Na (except S-3) and PI in both the two seasons. But, some groundwater samples are found unsuitable, based on RSC and KR values in both the seasons. However, in the overall, all the groundwaters can be utilized for irrigation.
Table 5a: RSC, SAR, % Na, PI and KR values for different groundwater samples
| Sample no. | Pre-monsoon | Monsoon | ||||||||
| RSC | SAR | %Na | PI | KR | RSC | SAR | %Na | PI | KR | |
| S-1 | 1.68 | 0.95 | 30.03 | 86.31 | 0.4 | 1.08 | 0.89 | 26.47 | 74.36 | 0.4 |
| S-2 | 0.67 | 0.65 | 21.22 | 71.06 | 0.3 | 0.79 | 0.70 | 21.86 | 70.21 | 0.3 |
| S-3 | 7.82 | 9.11 | 83.17 | 113.5 | 4.9 | 8.39 | 9.06 | 83.24 | 115.0 | 4.9 |
| S-4 | 2.26 | 1.59 | 35.71 | 74.50 | 0.5 | 2.66 | 1.94 | 42.28 | 82.31 | 0.7 |
| S-5 | 4.69 | 4.76 | 71.24 | 110.6 | 2.5 | 4.73 | 4.28 | 67.50 | 107.1 | 2.1 |
| S-6 | 2.55 | 1.94 | 42.39 | 81.95 | 0.7 | 2.36 | 2.03 | 42.15 | 78.47 | 0.7 |
| S-7 | 3.19 | 4.21 | 66.37 | 100.4 | 2.0 | 3.11 | 3.84 | 62.40 | 95.78 | 1.6 |
| S-8 | 3.96 | 3.62 | 64.19 | 106.5 | 1.8 | 4.16 | 3.70 | 64.00 | 105.4 | 1.8 |
| S-9 | 3.71 | 3.63 | 65.87 | 110.5 | 1.9 | 4.12 | 3.73 | 64.11 | 104.6 | 1.8 |
| S-10 | 3.60 | 3.20 | 59.34 | 100.3 | 1.4 | 3.55 | 3.53 | 60.92 | 98.27 | 1.6 |
| S-11 | 0.86 | 0.55 | 18.51 | 70.01 | 0.2 | 0.66 | 0.65 | 23.09 | 77.37 | 0.3 |
| S-12 | 5.71 | 4.06 | 64.36 | 104.4 | 1.8 | 5.18 | 3.49 | 57.40 | 94.06 | 1.3 |
| S-13 | 3.51 | 2.64 | 57.24 | 107.6 | 1.3 | 3.60 | 3.17 | 60.85 | 105.0 | 1.5 |
| S-14 | 3.70 | 3.16 | 60.18 | 103.6 | 1.5 | 3.80 | 3.18 | 60.33 | 103.9 | 1.5 |
| S-15 | 1.56 | 1.07 | 30.81 | 79.94 | 0.4 | 1.68 | 1.15 | 31.52 | 78.68 | 0.5 |
| Mean | 3.298 | 3.009 | 51.375 | 94.745 | 1.44 | 3.325 | 3.023 | 51.208 | 92.701 | 1.4 |
| S.D. | 1.876 | 2.18 | 19.898 | 15.643 | 1.205 | 1.99 | 2.094 | 18.649 | 14.419 | 1.146 |
| Min. | 0.67 | 0.55 | 18.51 | 70.01 | 0.2 | 0.66 | 0.65 | 21.86 | 70.21 | 0.3 |
| Max. | 7.82 | 9.11 | 83.17 | 113.5 | 4.9 | 8.39 | 9.06 | 83.24 | 115 | 4.9 |
Table 5b: Water quality classification for the irrigation purposes in both seasons
| Parameters | Values/ ranges | Class | Groundwater samples | |
| Pre-monsoon | Monsoon | |||
RSC (meq/L) | < 1.25 | Good | S-2, S-11 | S-1, S-2, S-11 |
| (1.25 – 2.50) | Marginal | S-1, S-4, S-15 | S-6, S-15 | |
| > 2.50 | Unsuitable | S-3, S-5, S-6 to S-10, S-12, S-13, S-14 | S-3, S-4, S-5, S-7 to S-10, S-12, S-13, S-14 | |
SAR | < 10 | Excellent | S-1 to S-15 | S-1 to S-15 |
| 10 to 18 | Good water | 0 | 0 | |
| 18 to 26 | doubtful | 0 | 0 | |
| above 26 | Unfit/ Unsuitable | 0 | 0 | |
% Na | < 20 % | Excellent | S-11 | 0 |
| (20 – 40) % | Good | S-1, S-2, S-4, S-15 | S-1, S-2, S-11, S-15 | |
| (40 – 60) % | Permissible | S-6, S-10, S-13 | S-4, S-6, S-12 | |
| (60 – 80) % | Doubtful | S-5, S-7, S-8, S-9, S-12, S-14 | S-5, S-7 to S-10, S-13, S-14 | |
| > 80% | Unsuitable | S-3 | S-3 | |
PI | > 75% | Suitable | S-1, S-3, S-5 to S-10, S-12 to S-15 | S-3 to S-15 |
| (25 – 75) % | Good | S-2, S-4, S-11 | S-1, S-2 | |
| < 25 % | Unsuitable | 0 | 0 | |
KR | Suitable | S-1, S-2, S-4, S-6, S-11, S-15 | S-1, S-2, S-4, S-6, S-11, S-15 | |
| KR | Unsuitable | S-3, S-5, S-7 to S-10, S-12, S-13, S-14 | S-3, S-5, S-7 to S-10, S-12, S-13, S-14 | |
“Pearson’s correlation coefficient (r) value”
Correlation coefficient (r) value for different parameters for both seasons is shown below (tables-6a and 6b).
Table 6a: Correlation coefficient (r) values of studied parameters (pre-monsoon).
Parameters | Temp. | pH | TDS | TH | TA | Ca2+ | Mg2+ | Na+ | K+ | Cl- | SO42- | NO3- | HCO3- |
Temp. | 1 | ||||||||||||
pH | 0.121 | 1 | |||||||||||
TDS | 0.030 | 0.071 | 1 | ||||||||||
TH | 0.131 | 0.093 | -0.391 | 1 | |||||||||
TA | -0.111 | -0.091 | 0.925 | -0.301 | 1 | ||||||||
Ca2+ | -0.045 | 0.306 | -0.115 | 0.798 | -0.099 | 1 | |||||||
Mg2+ | 0.213 | -0.053 | -0.485 | 0.929 | -0.367 | 0.519 | 1 | ||||||
Na+ | -0.032 | 0.031 | 0.949 | -0.582 | 0.899 | -0.379 | -0.594 | 1 | |||||
K+ | 0.265 | 0.191 | 0.673 | -0.249 | 0.532 | -0.064 | -0.315 | 0.589 | 1 | ||||
Cl- | 0.262 | 0.287 | 0.540 | -0.300 | 0.194 | -0.087 | -0.373 | 0.473 | 0.539 | 1 | |||
SO42- | 0.354 | 0.294 | 0.233 | 0.185 | 0.198 | 0.261 | 0.102 | 0.154 | 0.464 | 0.082 | 1 | ||
NO3- | -0.145 | -0.548 | 0.365 | -0.301 | 0.414 | -0.053 | -0.396 | 0.269 | 0.324 | -0.001 | -0.132 | 1 | |
HCO3- | -0.111 | -0.091 | 0.925 | -0.301 | 1 | -0.099 | -0.367 | 0.899 | 0.532 | 0.194 | 0.198 | 0.413 | 1 |
Table 6b: Correlation coefficient (r) values of studied parameters (monsoon).
Parameters | Temp. | pH | TDS | TH | TA | Ca2+ | Mg2+ | Na+ | K+ | Cl- | SO42- | NO3- | HCO3- |
Temp. | 1 | ||||||||||||
pH | -0.090 | 1 | |||||||||||
TDS | 0.035 | -0.460 | 1 | ||||||||||
TH | 0.420 | -0.046 | -0.278 | 1 | |||||||||
TA | 0.087 | -0.470 | 0.956 | -0.273 | 1 | ||||||||
Ca2+ | 0.238 | 0.044 | -0.008 | 0.863 | -0.064 | 1 | |||||||
Mg2+ | 0.475 | -0.097 | -0.403 | 0.952 | -0.363 | 0.668 | 1 | ||||||
Na+ | -0.056 | -0.318 | 0.949 | -0.531 | 0.926 | -0.258 | -0.626 | 1 | |||||
K+ | -0.332 | 0.172 | 0.523 | -0.371 | 0.486 | 0.015 | -0.554 | 0.555 | 1 | ||||
Cl- | -0.309 | -0.002 | 0.499 | -0.279 | 0.265 | 0.027 | -0.430 | 0.511 | 0.300 | 1 | |||
SO42- | 0.404 | -0.087 | -0.072 | 0.515 | -0.083 | 0.545 | 0.431 | -0.219 | 0.068 | -0.200 | 1 | ||
NO3- | -0.358 | -0.061 | 0.105 | -0.466 | 0.080 | -0.322 | -0.490 | 0.156 | 0.280 | -0.026 | -0.175 | 1 | |
HCO3- | 0.087 | -0.470 | 0.956 | -0.274 | 1 | -0.064 | -0.363 | 0.926 | 0.486 | 0.265 | -0.083 | 0.080 | 1 |
For both the seasons (tables-6a and 6b), a very strong positive correlation between TA and HCO3- (r = 1.000 each) is obtained. Again, TA shows strong positive correlation with Na+ both in pre-monsoon and monsoon (r = 0.899, r = 0.926). K+ exhibits moderately +ve correlation with the bicarbonate (HCO3-) both in pre-monsoon and monsoon (r = 0.532 and 0.486 respectively). Further, for both the two seasons, TDS also exhibits strong +ve correlation with total alkalinity (TA) (r = 0.925, r = 0.956). Again, in both pre-monsoon and monsoon, total hardness (TH) exhibits strong +ve correlation with Ca2+ having (r) value of 0.798 and 0.863 respectively. Similarly, for both seasons, TH also exhibits strong +ve correlation with magnesium (Mg2+) having (r) value of 0.929 and 0.952. However, regarding the parameters between TH and SO42- in pre-monsoon, there is weak positive correlation (r = 0.185) whereas in case of monsoon, there is moderately +ve correlation of TH with SO42- with (r) = 0.515. Besides, in case of pre-monsoon, TH shows negative correlation with Cl- and HCO3- having (r) value of -0.300 and -0.301 respectively. Similarly, for monsoon also, TH shows negative correlation with both Cl- and HCO3- having (r) value of -0.279 and -0.274 respectively. Thus, in both the two seasons, by the presence of dissolved sulphates of Ca2+and Mg2+, the TH of different groundwaters leads to mildly permanent hardness of water but there is no indication of temporary hardness of water.
Conclusion
In both seasons, all groundwaters fall under the category of fresh water. Majority of the parameters for various groundwaters have found their values/ concentrations below the acceptable limits of BIS and WHO. In pre-monsoon, 73.33% of water samples belongs to moderately hard water and 26.67% (hard water) whereas in monsoon, 60% (moderately hard water) and 40% (hard water). The TH and Mg2+ values of S-4 (pre-monsoon) are found beyond their acceptable limits but below the permissible limits. Again, the TA values for all the groundwater samples except S-2 (pre-monsoon) and S-11 (monsoon) have found their values beyond its acceptable limit but below its permissible limit. Therefore, treatments are required in order to maintain the TH values and Mg2+ concentration in case of S-4 and the TA for all the samples (except S-2 and S-11) below their corresponding acceptable limits. The study data also indicate that the values or concentrations of parameters in most of the samples of monsoon season are observed to be higher than that of pre-monsoon.
With special reference to mean abundance values (table-3c), in pre-monsoon, the order of cations is given by “Na+ > Ca2+ > Mg2+ > K+” whereas for monsoon, its order is given - “Na+ > Mg2+ > Ca2+ > K+”. Again, for pre-monsoon, an anion series is given - “HCO3- > Cl- > SO42- > NO3-” whereas for monsoon, its order - “HCO3- > SO42- > Cl- > NO3-”.
From WQI data analysis, it is seen that in pre-monsoon, 26.67% of samples have excellent type of water quality, 66.67% (good) and 6.66% (poor) while in monsoon, 60% (good) and 40% (poor). The WQI data shows that all the samples (S-1 to S-15) can be taken as granted (suitable) for human consumption.
In the overall, the samples from S-1 to S-15 can be used for irrigation (agricultural) purposes.
For both the two seasons, the TH of the various samples is mainly due to dissolved sulphates of Ca2+ and Mg2+ leading to weakly permanent hardness of water but there is no sign of temporary hardness of water.
Acknowledgements
The authors are grateful to the Principal, D.M. College of Science, Dhanamanjuri University, Imphal, Manipur for providing the laboratory facilities of the Ph.D. research work.
Funding Source
The first author is grateful to UGC, New Delhi for providing fellowships through Manipur University, Canchipur, Imphal (order no. – 746, file no. – MU/2-6/05/Aca(Pt-II), dated – 18th Sept. 2019.
Conflict of Interest
The authors declare that they have no conflict of interest.
Authors’ Contribution
Both the authors have contributed equally in this article.
Data Availability Statement
Not applicable.
Ethics Approval Statement
Not applicable.
References
- Prasad P.R.C., Rajan K.S., Bhole V., Dutt C.B.S. Is rapid urbanization leading to loss of water bodies? J. Spat. Sci. 2009; 2(2): 43-52.
- Raghunath H.M. Ground Water. Third edition, New Age International (P) Limited, New Delhi, 2007, 520 pages.
- Patra S., Sahoo S., Mishra P., Mahapatra S.C. Impacts of urbanization on land use /cover changes and its probable implications on local climate and groundwater level. J. Urban Manag. 2018; 7, 70-84.
CrossRef - Panneerselvam B., Ravichandran N., Kaliyappan S.P., Karuppannan S., Bidorn B. Qualiy and Health Risk Assessment of Groundwater for Drinking and Irrigation Purpose in Semi-Arid Region of India using Entropy Water Quality and Statistical Techniques. Water. 2023; 15, 601, 1-20.
CrossRef - Goswami R., Neog N., Thakur R. Hydrogeochemical assessment of groundwater quality for drinking and irrigation in Biswanath and Sonitpur district of the central Brahmaputra Plain, India. Front. Water. 2022; 4:889128.
CrossRef - Shahab A., Shihua Q., Rashid A., Hasan F.U., Sohail M.T. Evaluation of Water Quality for Drinking and Agricultural Suitability in the Lower Indus Plain in Sindh Province, Pakistan. Pol. J. Environ. Stud. 2016; 25(6): 2563-2574.
CrossRef - Ghalib H.B. Groundwater chemistry evaluation for drinking and irrigation utilities in east Wasit province, Central Irag. Appl. Water Sci. 2017; 7: 3447-3467.
CrossRef - Jafari K., Asghari F.B., Hoseinzadeh E., Heidari Z., Radfard M., Saleh H.N., Faraji H. Groundwater quality assessment for drinking and agriculture purposes in Abhar city, Iran. Data Br. 2018; 19, 1033-1039.
CrossRef - Megahed H.A. GIS-based assessment of groundwater quality and suitability for drinking and irrigation purposes in the outlet and central parts of Wadi El-Assiuti, Assuit Governorate, Egypt. Bull Natl Res Cent. 2020; 44:187, 1-31.
CrossRef - Chakrabarti S., Patra P.K. Hydrochemical analysis of ground water of Rampurhat-II Block, Birbhum district, West Bengal, India. Rasayan J. Chem. 2017; 10(4), 1424-1430.
- Chaudhary V. Satheeshkumar S. Assessment of groundwater quality for drinking and irrigation purposes in arid areas of Rajasthan, India. Appl. Water Sci. 2018; 8:218, 1-17.
CrossRef - Adimalla N. Groundwater Quality for Drinking and Irrigation Purposes and Potential Health Risks Assessment: A Case study from Semi-Arid Region of South India. Expo. Health. 2019; 11, 109-123.
CrossRef - Nimmi N., Shiji M., Harikumar P.S. Groundwater quality characteristics of Kattampally and Biyyam wetlands of Kerala, India. Int. j. ecol. environ. sci. 2020; 46(3-4): 231-240.
- Saleem M., Hussain A., Mahmood G. Analysis of groundwater quality using water quality index: A case study of greater Noida (Region), Uttar Pradesh (U.P.), India. Cogent Eng. 2016; 3(1), 1-11.
CrossRef - Chandra D.S., Asadi, SS., Raju M.V.S. Estimation of water quality index by weighted arithmetic water quality index method: A model study. International Journal of Civil Engineering and Technology (IJCIET). 2017; 8(4), 1215-1222.
- Singh A.K., Bhardwaj S.K. Assessment of Spatial and Temporal Variation of Water Quality in Mid Hills of North West Himalayas- A Water Quality Index Approach. Curr. World Environ. 2019; 14(1).
CrossRef - Nadikatla S.K., Mushini V.S., Mudumba P.S.M.K. Water quality index method in assessing groundwater quality of Palakonda mandal in Srikakulam district, Andhra Pradesh, India. Appl. Water Sci. 2020; 10:30, 1-14.
CrossRef - District Census Hand Book - Imphal East, Village and Town Directory. Directorate of Census operations Manipur. Census of India, Manipur, 2011.
CrossRef - APHA. Standard Methods for the Examination of Water and Wastewater, 18th edition. American Public Health Association, Washington, D.C.1992.
- Tyagi S., Sharma B., Singh P., Dobhal R. Water Quality Assessment in Terms of Water Quality Index. Am. J. Water Resour. 2013; 1(3): 34-38.
CrossRef - Wilcox L.V. Classification and use of irrigation water. US Department of Agriculture, Circular 969, Washington DC. 1955.
- Todd D.K. Groundwater hydrology (2nd edition). John Wiley and Sons (Asia) Pvt. Ltd., New York. 1980.
- Doneen L.D. Notes on water quality in agriculture. Published as a water science and engineering paper 4001, Department of Water Science and Engineering, University of California, Davis. 1964.
- Kelly W.P. Permissible composition and concentration of irrigated waters. In: Proceedings of the ASCE, 1940.
- BIS - IS 10500. Indian standard for drinking water-specification (second revision), Bureau of Indian standards, New Delhi. 2012.
- WHO. Guidelines for drinking water quality (Fourth edition). World Health Organization, Geneva, Switzerland, 2011.
- Sawyer C.N., McCarty P.L. Chemistry for sanitary Engineers, Second edition. McGraw Hill, New York, 1967.
- Kumar P.R., Gowd S.S., Krupavathi C. Groundwater quality evaluation using water quality index and geospatial techniques in parts of Anantapur District, Andhra Pradesh, South India. HydroResearch. 2024; 7, 86-98.
CrossRef - DeZuane J. Handbook of Drinking Water Quality. Second edition. Wiley India Pvt Ltd. 2012, 592 pages.
- Ali S.A., Ali U. Hydrochemical characteristics and spatial analysis of groundwater quality in parts of Bundelkhand Massif, India. Appl. Water Sci. 2018; 8(39), 1-15.
CrossRef - Sharma M.K., Kumar M. Sulphate contamination in groundwater and remediation: an overview. Environ. Monit. Assess. 2020; 192, 74.
CrossRef - Parvizishad M., Dalvand A., Mahvi A.H., Goodarzi F. A Review of Adverse Effects and Benefits of Nitrate and Nitrite in Drinking Water and Food on Human Health. Health Scope. 2017; 6(3): e14164.
CrossRef


