Contamination Status of Residential and Farmland Surface Soils Within the Sunyani Municipality of Ghana
Benjamin Darko Asamoah1
*
 , Paul Danyi1
, Bernice Araba Otoo2
, Daniel Adusu3
and Bright Ankudze4
, Paul Danyi1
, Bernice Araba Otoo2
, Daniel Adusu3
and Bright Ankudze4
1
Department of Chemical Sciences,
University of Energy and Natural Resources,
Sunyani,
Ghana
2
Department of Physical and Mathematical Sciences,
University of Environment and Sustainable Development,
Somanya. P.M.B,
Somanya
Ghana
3
Department of Environmental Management,
University of Energy and Natural Resources,
Sunyani,
Ghana
4
Department of Chemistry Education,
University of Education,
Winneba,
Ghana
Copy the following to cite this article:
Asamoah B. D, Danyi P, Otoo B. A, Adusu D, Ankudze B, Contamination Status of Residential and Farmland Surface Soils Within the Sunyani Municipality of Ghana. Curr World Environ 2024;19(1).
Copy the following to cite this URL:
Asamoah B. D, Danyi P, Otoo B. A, Adusu D, Ankudze B, Contamination Status of Residential and Farmland Surface Soils Within the Sunyani Municipality of Ghana. Curr World Environ 2024;19(1).
Citation Manager Publish History

Introduction
For several decades, scientists have employed the phrase "heavy metals" in their investigations within the field of ecotoxicology. In such investigations, the concentration, fate, emission, mobility, and toxicity of the metals have been widely explored. Heavy metals are sometimes referred to as toxic metals due to their poisonous nature either in elemental state or combined form 1. The biogeochemical characteristics of metals differ. For example, period four transition metals such as chromium, manganese, iron, copper, and zinc, are known for some biochemical functions in humans. In contrast, metals such as arsenic, mercury, cadmium, and lead, are highly toxic at background concentrations and have no known biological significance 2. As soon as heavy metals enter the lithosphere, they remain undecomposed and they bioaccumulate to cause detrimental effects 3. Sources of these metal pollutants can either be natural or anthropogenic. Natural sources include but are not limited to erosion processes experienced by rocks containing metals, atmospheric deposition, and volcanic eruptions while human-induced activities which are linked to industrialization, encompass activities like waste disposal, waste incineration, urban effluents, vehicular emissions, fertilizer application, and the prolonged use of wastewater in agricultural lands 4. Heavy metals are frequently used in different industrial processes, such as production the of batteries, alloys, electroplated metal components, agrochemical uses, and road building 5,6. These toxic metals are non-biodegradable and, as a result, persistently pollute the air, the land, the water, and sediments 7. Concentrations of metals in surface soils rely on the chemical, physical, biological, geological, and anthropogenic factors that may cause the rise of these metal concentrations beyond their acceptable environmental soil quality guidelines 8.
Heavy metals' possible adverse effects on humans, animals, and plants have caused a great deal of anxiety, especially in developing nations where mitigation techniques are still in their infancy 9. For example, exposure to lead, even at low levels, has been reported to cause mutilation of the brain nerves, and heart-related issues in living organisms10. The detrimental impact of mercury pollution on neurons, nerves, digestive, and reproductive systems has been established among biota.11. Cadmium contamination has been associated with changes in human male spermatogenesis, semen quality, including sperm motility, and hormonal releases12.
The fundamental structural component of the biosphere is the soil-plant system. It transforms solar energy into biological energy, supplying essential natural resources for organisms including plants, animals, and humans 13. Often, it is assumed that surface soils in residential areas that have not seen a significant degree of industrial activity are pristine. Due to common homeowner practices like applying pesticides and fertilizers, rebuilding and building with lead-based paint, using pressure-treated wood for decks, and being exposed to vehicle emissions, these soils may record high levels of metals and metalloids 14,15.
Many studies have reported high concentrations of metals at locations where human-induced activities are widespread. Notwithstanding, there is scanty information on the potential risks posed to the lithosphere and biota by these metals. Therefore, investigating the heavy metal levels in both farmland and residential soil is an urgent task. The present study assessed the level and toxicity of nine heavy metals from fifty-two surface soils in the Sunyani municipality grouped into residential and farmlands based on the place of sampled soil.
Materials and Methods
Study location
Sunyani municipality is an expanding urban center and serves as the administrative capital of the Bono Region in Ghana. The municipality covers approximately 506.7 square kilometers and is located at latitude 7.34° and longitude -2.33°. Sunyani is located within the wet semi-arid climate zone of Ghana. The lowest and highest monthly temperatures are in August and April, respectively, and range from 23 °C to 33 °C. Rainfall is typically 88.99 cm 16. The residential areas in the municipality are scattered around the southern and the northern zones. The middle corridor of the municipality is saturated with commercial activities. Farming is the Indigenous' primary occupation, which they often perform outside of town. The sampling locations within the municipality for this study are depicted in Fig. 1.
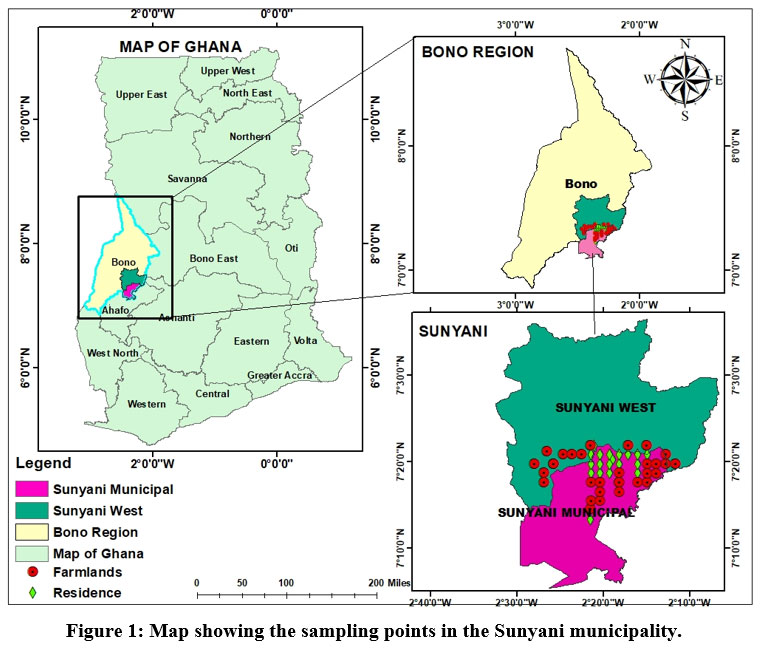 | Figure 1: Map showing the sampling points in the Sunyani municipality.
|
Soil sampling
Samples were collected in April 2022 at a depth of 0 – 15 cm with a clean, dry shovel. Surface soils particularly the depth chosen, are reported to be the layer that humans may have direct contact with oral ingestion17. During sampling, the digging tools were cleaned using detergents and washed under a running tap after fetching each sample. This was done to reduce cross-contamination. Fifty-two samples were randomly collected within the study location; 20 from identified residential areas and 32 from farmlands. At each sample site, three replicates were taken within 3 m intervals, homogenized, kept in zip-loc, and conveyed to the laboratory. The samples were prepared for analysis by drying, removing debris and pebbles, powdering, and sieving to a particle size of 250 µm. This size indicates the fraction of soil particles with the ability to adhere to the skin, especially the hands.
pH and EC
Soil pH and electrical conductivity of all the soil samples were determined by an Oakton PCSTestr35 multiparameter probe (Quebec, Canada)18. In brief, a supernatant liquid of soil: water (1:5, w/v) was shaken for about 30 minutes on a mechanical shaker (DRAGONLAB SK-0330-PRO), and the resulting mixture was allowed to stand for about 15 minutes before measurements.
ICP-MS analysis
Before instrumental analysis, soil samples were acid digested in the laboratory by following US EPA Method 305119. A 3.0 g portion of the prepared sample was subjected to digestion in a beaker containing a mixture of conc. HNO3 and conc. HCl (1:3 v/v) at 95 oC for 1 hr. The resulting mixture was allowed to cool, filtered, and made to mark followed by instrumental analysis. The quality assurance and quality control measures involved the measurement of procedure blank, a certified reference sample (NIST 2709a), and for the replicate samples.
Pollution indices
Contamination factor (CF) and pollution load index (PLI)
CF assesses the degree of contamination by comparing the concentration of metal in the sample to its baseline value. Equation 1 was employed to calculate CF values for each heavy metal20.
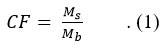
Ms and Mb denote sampled metal concentration and background concentration respectively. Soil sample from the botanical garden of the University of Energy and Natural Resources (UENR) - Sunyani was used as the background sample due to its pristine nature. CF values were classified as no (CF < 1), low (CF = 1-3), significant (CF = 3-6), or high (CF > 6)21.
PLI approximates the all-inclusive condition of contamination of the heavy metals at a specific study site. PLI values were obtained with the aid of Equation 2.

The n indicates the number of metals employed in the study (nine in this study). PLI greater than 1, connotes deterioration of the surface soil whereas PLI less than 1, connotes baseline levels of metal present.
Geoaccumulation index (Igeo)
Igeo measures the contamination of the surface soil by individual metals (Equation 3).
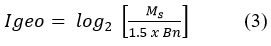
Ms and Bn indicate average metal levels of the sampled metal and the geochemical reference level values respectively. The 1.5 is a constant which explains the inputs from the lithosphere and anthroposphere 21.
Enrichment Factor (EF)
The EF distinguishes natural sources of metal contamination from human inputs (Equation 4). Iron metal was used for the normalization due to its abundance in the lithosphere.
.jpg)
Ms and Fes = individual metal and Fe average concentrations, Mb and Feb = metal and Fe concentration from the reference sample 22.
Potential ecological risk index (PERI)
The ecological risk posed by individual metal within the surface soil was evaluated using the ecological risk coefficient (Erf), and risk index (RI). (Equation 5).
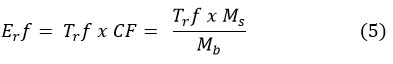
The toxic response factor (Trf) denotes the level of toxicity by individual metal and the degree of sensitivity that humans have towards it. Trf values were as used as in literature10. Categorization of ecological risks ranges from little risk (Erf < 15) to extreme risk (Erf > 120).
PERI, a summation of each risk indices (RI) of the metal was employed to ascertain the degree of metal pollution within the study area (Equation 6).

where 'n' = total number of metals examined. The following classification was used 23: PERI < 50 = little risk, 50 < PERI < 90 = considerable risk, 90 < PERI < 120 = significant risk, 120 < PERI < 200 = high risk, PERI > 200 = extreme risk.
Statistical analyses
Correlation, t-tests, and regression analysis were employed to statistically analyze the data. Application of t-tests analyzes changes in the characteristics that were measured and determines if there were differences in sample means across the sites. Given the continuous nature of our dataset, The correlation analysis was employed to evaluate the correlation between physicochemical parameters (EC, pH) and the levels of metals. A two-tailed test with a 95% confidence interval was utilized to determine if there were significant mean differences across different locations.
Results and discussion
pH and EC
Soil pH and EC values for both residential and farmland are summarized in Table 1. Statistically, the pH values in the two different areas showed no statistical difference (p > 0.05). The residential surface soils recorded pH values from 6.32 to 8.89 with a mean of 7.31 ± 0.77, indicating that the soil samples exhibit a slightly acidic to basic nature. This differs slightly from the farmland surface soils which recorded pH values of 5.83 to 8.25 with a mean of 7.06 ± 0.60, denoting the acidic to basic nature of the surface soils. At low pH, metals have higher solubility than at elevated pH probably due to their ability to form bioaccessible free ionic forms at low pH 24. As an illustration, metals that pose health risks, like lead, tend to have higher solubility in acidic conditions compared to basic conditions. Under basic conditions, a significant portion of dissolved lead can be induced to form solid precipitates, facilitating its removal 24.
The group’s mean EC showed no statistical difference, with the residential surface soils recording EC values from 97.30 to 713.00 µS/cm averaging 261.90± 44.10 µS/cm. Comparatively, the farmland soils recorded lower EC values between (76.8 and 207.10) µS/cm with a mean of (146. 30 ± 61.10) µS/cm. EC reveals the level of ions in a given soil sample. Elevated hydrogen ion concentrations in soil are linked to higher electrical conductivity, which may limit the mobility of metals in the soil 6.
Heavy metal concentrations across residential and farmland soils
Descriptive statistics and physicochemical parameters of the metals are summarized in Table 1. Average levels of Cd, Cu, and Zn across the study areas revealed statistical difference, whereas As, Cr, Hg, Mn, Ni, and Pb showed no statistical difference in the study areas. Surprisingly, similar mean arsenic concentration was recorded in both the residential and farmland surface soil (0.03 ± 0.03) ppm, higher than the 0.019 ppm observed in the control sample. This implies minimal anthropogenic influence in the two areas raised As levels. The average lead level observed in the residential soil (0.16±0.25) ppm was slightly higher than recorded in the farmland soil (0.10±0.04) ppm. The control site, however, recorded a relatively higher mean concentration of lead (1.15 ppm) than in the two study sites. This suggests naturally high levels of lead in the residential and farmland surface soils in the Sunyani Municipality. Lead-contaminated soils may cause renal impairment in humans and it is also toxic to the reproductive organs. These concentrations are far lower than a geometric mean of 48.0±5.0 ppm recorded in a similar work conducted on surface soils in the USA14.
The average zinc content observed at the residential surface soil (0.66 ± 0.85) ppm was higher than the (0.31 ± 0.12) ppm recorded in the farmland surface soils but lower than recorded at the control site, 1.640 ppm. A study conducted at dump sites in the Sunyani Municipality observed a relatively higher Zn concentration, 0.43 ppm 25. The relatively low Zn mean levels in both study areas can be attributed to factors such as soil efficiency in terms of Zn-bearing minerals, elevated calcium carbonate content, plentiful bicarbonate in irrigation water, depleted soil conditions, excessive phosphorus, and nitrogen levels in the lithosphere, and the absence of zinc fertilizer application can collectively contribute to zinc deficiency in soils. (Hamid & Payandeh, 2022). The average Cr and Cu levels observed in the residential surface soil (0.52±0.33) ppm and (0.22±0.21) ppm respectively, were higher than seen in the farmland soils (0.46±0.56) ppm and (0.17±0.77) ppm respectively. Both metal concentrations in the two areas were lower than the control site (0.59 and 0.84) ppm respectively. Also, a survey conducted at auto mechanic workshops in the Sunyani municipality recorded significantly higher metal levels of Cr and Cu (6.33±1.49) ppm and (6.87±9.70) ppm respectively 2. This trend suggests that human activities at both study sites are not necessarily increasing the metal levels above their acceptable limits.
Manganese and nickel are the only two metals in this study, that recorded a comparatively higher concentration in the farmland soils (6.78±3.63) ppm and (0.17±0.29) ppm respectively than in the residential topsoil (5.93±3.68) ppm and (0.14±0.11) ppm respectively. Mn mean levels in both study areas was higher than in the control site, 4.032 ppm. Ni content in the control sample (1.777 ppm) however, was relatively higher than both residential and farmland surface soils. According to literature, some fertilizers used in farming for crop growth contain appreciable amounts of manganese which is not easily degraded or destroyed once introduced into the soil 1. A study conducted at Kumasi top soils recorded values of Mn and Ni (347.86±217.17) ppm and (43.16±21.83) ppm 27, far greater than what was observed in this study. Concentrations of mercury and cadmium across the two study areas were basically below detection limits. These two carcinogenic, teratogenic, and poisonous metals are widely known to exist in the surface soils in minute concentrations, except in places where anthropogenic activities involving their usage are predominant 12,28.
Table 1: Statistical summary of pH, EC (µS/cm), and metal concentrations (ppm) in the two study areas.
| Residential
| Farmland
| P-Value
| Pristine soil | ||||||
Min. | Max. | Average | St.Dev | Min. | Max. | Average | St.Dev. |
| Average | |
pH | 6.32 | 8.89 | 7.31 | 0.77 | 5.83 | 8.25 | 7.06 | 0.60 | 0.11 | 8.13 |
EC (µS/cm) | 97.30 | 713.00 | 261.9 | 44.10 | 76.8 | 207.1 | 146.3 | 61.1 | 0.43 | 142.1 |
As | 0.01 | 0.10 | 0.03
| 0.03 | 0.01 | 0.15 | 0.03
| 0.03
| 0.78 | 0.019 |
Cd | 0.00 | 0.01 | 0.00 | 0.00 | 0.00 | 0.00 | 0.00 | 0.00 | 0.01 | 0.001 |
Cr | 0.17 | 1.16 | 0.52
| 0.33 | 0.13 | 3.37 | 0.46
| 0.56 | 0.74 | 0.589 |
Cu | 0.05 | 0.96 | 0.22
| 0.21 | 0.06 | 0.35 | 0.17
| 0.07 | 0.02 | 0.834 |
Hg | 0.00 | 0.01 | 0.00 | 0.00 | 0.00 | 0.01 | 0.00 | 0.00 | 0.98 | 0.001 |
Mn | 1.17 | 15.95 | 5.93
| 3.68 | 1.88 | 15.06 | 6.78
| 3.63 | 0.79 | 4.032 |
Ni | 0.06 | 0.53 | 0.14 | 0.11 | 0.08 | 1.75 | 0.17 | 0.29 | 0.68 | 1.777 |
Pb | 0.06 | 1.19 | 0.16
| 0.25 | 0.04 | 0.19 | 0.10
| 0.04 | 0.06 | 1.151 |
Zn | 0.12 | 3.38 | 0.66
| 0.85 | 0.12 | 0.61 | 0.31
| 0.12 | 0.00 | 1.640 |
Extent of metal pollution
Contamination factor and pollution load index
Tables 2-4 shows the values for the indices. In the residential soil, all the metals recorded low contamination except for As, Hg, and Mn which showed moderate contamination. This observation is not different from the farmland surface soils. Except As, Hg, and Mn which showed moderate contamination, the remaining six metals showed low contamination. A previous survey carried out on top soils in the Kumasi metropolis, revealed considerable contamination for As, Cu, Ni, and extreme contamination of Hg, Zn, Cd, Cr, and Pb 6, indicating relatively low contamination of top soils in this current findings. The PLI value of 0.48 and 0.40 in residential and farmland soils respectively, suggests an overall baseline level of heavy metals in soils at both locations and no deterioration of the top soils 22.
Table 2: CF of metals and PLI values in the two study sites.
Sample location | Contamination Factor | PLI | ||||||||
| As | Cd | Cr | Cu | Hg | Mn | Ni | Pb | Zn |
|
Residential | 1.63 | 0.50 | 0.88 | 0.26 | 1.03 | 1.47 | 0.08 | 0.13 | 0.40 | 0.48 |
Farmland | 1.68 | 0.30 | 0.78 | 0.21 | 1.13 | 1.68 | 0.10 | 0.09 | 0.19 | 0.40 |
I-geo and EF
The data for I-geo showed practically non-contamination for all the metals except arsenic (moderate contamination) in the residential surface soils. In the farmland surface soils, the I-geo values revealed moderate contamination in As, Hg, and Mn, whereas the remaining six metals showed no contamination. Contamination of farmland soils with As, Hg, and Mn can be attributed to the presence of phosphate-containing fertilizers as well as liming materials which have appreciable concentrations of these metals5.
The EF values in the residential surface soil confirmed background concentrations of all the metals except cadmium and chromium which showed depletion to minimal enrichment, and significant enrichment for arsenic. In contrast, all metals except manganese showed baseline levels in the farmland surface soils with the manganese showing depletion to minimal enrichment. This trend further explains the lithogenic source of the metals rather than anthropogenic influence 29.
Table 3: I-geo values in the study locations
Sample location |
| ||||||||
| As | Cd | Cr | Cu | Hg | Mn | Ni | Pb | Zn |
| Residential | 0.12 | -1.57 | -0.76 | -2.52 | -0.53 | -0.03 | -4.23 | -3.48 | -1.89 |
| Farmland | 0.16 | -2.31 | -0.94 | -0.40 | 0.16 | 1.68 | -3.93 | -4.07 | -2.97 |
Table 4: EF values in the study sites.
Sample location | Enrichment Factor | ||||||||
| As | Cd | Cr | Cu | Hg | Mn | Ni | Pb | Zn | |
| Residential | 6.03 | 1.08 | 2.81 | -2.52 | -0.53 | -0.03 | -4.23 | -3.48 | -1.89 |
| Farmland | 0.16 | -2.31 | -0.94 | -0.40 | 0.16 | 1.68 | -3.93 | -4.07 | -2.97 |
Ecological risk indices
A summary of the ecological risk assessment is computed in Table 5. Low ecological risks were observed for all metals except As and Cd in both sites, suggesting geogenic contributions of the potential toxic metals to the surface soils 8. Cadmium notwithstanding, revealed moderated ecological risk in the residential top soils with arsenic also found exhibiting moderate ecological risk in both study areas. A condition known as arsenicosis develops when individuals ingest or inhale significant amounts of arsenic. Prolonged exposure to arsenic can lead to more severe symptoms, including skin swelling, abdominal pain, feelings of nausea, vomiting, and diarrhea 30. Even at minute concentrations, the introduction of cadmium into the environment causes diverse health effects to biota such as chronic pulmonary, kidney, renal, bone, and cardiovascular-related diseases 31.
Table 5: Potential Ecological Risk Index for Residential and Farmland Soils
Sample location | RI of metals | PERI | ||||||||
| As | Cd | Cr | Cu | Hg | Mn | Ni | Pb | Zn | ||
| Residential | 16.35 | 15.15 | 1.77 | 1.31 | 10.38 | 7.36 | 0.40 | 0.67 | 0.40 | 53.818 |
| Farmland | 16.78 | 9.09 | 1.56 | 1.02 | 11.33 | 8.40 | 0.49 | 0.44 | 0.19 | 49.33 |
Correlation analysis
To establish the strength, direction, and significance of the relationship between nutrient variables assessed in this study, a Pearson correlation analysis was conducted and a correlation matrix was constructed among these variables (Table 6). The study revealed a significant (p < 0.05) but weak positive correlation between Mn and Cr (r = 0.337*) and Ni and Cu (r = 0.294*) while EC and pH (r = 0.420**), Cdand EC (r = 0.452**), Pb and EC (r = 0.421**), Zn and EC (r = 0.429**), Cu and As(r = 0.588**) , Mn and As (r = 0.470**), Cu and Cr (r = 0.588**), and Mn and Cu(r = 0.694**) showed significantly (p < 0.01) moderate correlations. The significant positive correlation between Pb, Cd, Zn, Cd, Ni, and Cr indicates the possibility of the metals being deposited into the surface soil from a common origin 32.
Table 6: Correlation matrix for studied parameters
| pH | EC | As | Cd | Cr | Cu | Hg | Mn | Ni | Pb | Zn |
pH | 1 |
|
|
|
|
|
|
|
|
|
|
EC | 0.420** | 1 |
|
|
|
|
|
|
|
|
|
As | -0.203 | -0.086 | 1 |
|
|
|
|
|
|
|
|
Cd | 0.254 | 0.452** | 0.002 | 1 |
|
|
|
|
|
|
|
Cr | -0.087 | -0.013 | 0.258 | 0.078 | 1 |
|
|
|
|
|
|
Cu | -0.152 | 0.078 | 0.588** | 0.144 | 0.364** | 1 |
|
|
|
|
|
Hg | 0.058 | -0.094 | 0.129 | -0.018 | 0.144 | 0.135 | 1 |
|
|
|
|
Mn | -0.109 | -0.070 | 0.470** | 0.047 | 0.337* | 0.694** | 0.152 | 1 |
|
|
|
Ni | -0.090 | -0.097 | 0.108 | 0.054 | 0.924** | 0.294* | 0.088 | 0.264 | 1 |
|
|
Pb | 0.224 | 0.421** | -0.016 | 0.915** | 0.078 | 0.046 | 0.000 | 0.031 | 0.005 | 1 |
|
Zn | 0.255 | 0.429** | -0.099 | 0.885** | -0.038 | 0.084 | 0.042 | -0.117 | -0.070 | 0.837** | 1 |
*. Correlation is significant at the 0.05 level (2-tailed)
**. Correlation is significant at the 0.01 level (2-tailed)
Conclusion
This research has successfully evaluated the heavy metal burden on residential and farmland surface soils within Sunyani Municipality of Ghana. In the residential areas, mean levels of As, and Mn slightly exceeded that of the control site, suggesting minimal contamination of the surface soils. The remaining seven metals recorded relatively higher concentrations in the control site than in the residential surface soils, indicating lithogenic contributions of the metals to the surface soil. The pristine surface soil recorded higher levels of all metals than the farmland surface soils, except for As and Cd. This suggests that farming activities in the municipality are not necessarily increasing metal concentrations in the soil. However, constant monitoring is needed to maintain the natural conditions of the lithosphere. At the study locations, there was moderate contamination of As, Hg, and Mn, with the remaining metals showing minimal contamination. The Pollution load index of the residential surface soil was inconsiderably higher than recorded in the farmland although both values indicate perfection of the surface soils. The potential ecological risk index results suggest considerable risk of metals in both study areas. It is therefore imperative for indigens of the municipality to exercise a little precaution not to ingest, inhale, or dermally contact with these potential toxic metals.
Acknowledgments
We appreciate the Department of Chemical Sciences, UENR, for laboratory space during the research.
Conflict of interest
The authors declare no conflict of interest
Funding Sources
The authors received no financial support for this research, authorship, and/or publication of this article.
Authors’ Contribution
The research idea was conceived by Benjamin Darko Asamoah, Paul Danyi, and Bright Ankudze. Paul Danyi and Benjamin Darko Asamoah carried out the sampling processes, and laboratory analysis done by Bernice Araba Otoo and Benjamin Darko Asamoah. Daniel Adusu did all the statistical analysis of the results and the manuscript was drafted by Benjamin Darko Asamoah, Daniel Adusu, and Bright Ankudze. Final proofreading was done by all authors.
Data Availability Statement
The manuscript incorporates all datasets produced or examined throughout this research study.
Ethics Approval Statement
Authors assert a lack of any recognized financial or personal connections with individuals or entities that might inappropriately influence their work. They have carefully examined and understood the principles concerning the "Ethical Responsibilities of Authors" and have adhered to them accordingly.
References
- Karn R, Ojha N, Abbas S, Bhugra S. A review on heavy metal contamination at mining sites and remedial techniques. IOP Conf Ser Earth Environ Sci. 2021;796(1):0-29. doi:10.1088/1755-1315/796/1/012013
CrossRef - Asamoah BD, Asare A, Okpati SW, Aidoo P. Heavy metal levels and their ecological risks in surface soils at Sunyani magazine in the bono region of Ghana. Sci African. 2021;13:e00937. doi:10.1016/j.sciaf.2021.e00937
CrossRef - Liu R ping, Xu Y ning, Zhang J hua, Wang W ke, Elwardany RM. Effects of heavy metal pollution on farmland soils and crops: A case study of the Xiaoqinling Gold Belt, China. China Geol. 2020;3(3):402-410. doi:10.31035/cg2020024
- Ali H, Khan E, Ilahi I. Environmental chemistry and ecotoxicology of hazardous heavy metals: Environmental persistence, toxicity, and bioaccumulation. J Chem. 2019;2019(Cd). doi:10.1155/2019/6730305
CrossRef - Zhou Q, Yang N, Li Y, et al. Total concentrations and sources of heavy metal pollution in global river and lake water bodies from 1972 to 2017. Glob Ecol Conserv. 2020;22:e00925. doi:10.1016/j.gecco.2020.e00925
CrossRef - Akoto O, Bortey-Sam N, Ikenaka Y, et al. Contamination Levels and Sources of Heavy Metals and a Metalloid in Surface Soils in the Kumasi Metropolis, Ghana. J Heal Pollut. 2017;7(15):28-39. doi:10.5696/2156-9614-8.15.28
CrossRef - Kinuthia GK, Ngure V, Beti D, Lugalia R, Wangila A, Kamau L. Levels of heavy metals in wastewater and soil samples from open drainage channels in Nairobi, Kenya: community health implication. Sci Rep. 2020;10(1):1-13. doi:10.1038/s41598-020-65359-5
CrossRef - Nna Orji C, Abdulrahman FW, Rosemary Isu N. Pollution Status of Heavy Metals in Spent Oil-Contaminated Soil in Gwagwalada. Asian J Appl Chem Res. 2018;4(1):1-10. doi:10.9734/ajacr/2018/v1i29623
CrossRef - Gyamfi O, Sorenson PB, Darko G, Ansah E, Bak JL. Human health risk assessment of exposure to indoor mercury vapour in a Ghanaian artisanal small-scale gold mining community. Chemosphere. 2020;241. doi:10.1016/j.chemosphere.2019.125014
CrossRef - Mihankhah T, Saeedi M, Karbassi A. A comparative study of elemental pollution and health risk assessment in urban dust of different land-uses in Tehran’s urban area. Chemosphere. 2020;241:124984. doi:10.1016/j.chemosphere.2019.124984
CrossRef - Panagos P, Jiskra M, Borrelli P, Liakos L, Ballabio C. Mercury in European topsoils: Anthropogenic sources, stocks and fluxes. Environ Res. 2021;201(June):111556. doi:10.1016/j.envres.2021.111556
CrossRef - Haider FU, Liqun C, Coulter JA, et al. Cadmium toxicity in plants: Impacts and remediation strategies. Ecotoxicol Environ Saf. 2021;211:111887. doi:10.1016/j.ecoenv.2020.111887
CrossRef - Lin N, Jiang R, Li G, Yang Q, Li D, Yang X. Estimating the heavy metal contents in farmland soil from hyperspectral images based on Stacked AdaBoost ensemble learning. Ecol Indic. 2022;143(August):109330. doi:10.1016/j.ecolind.2022.109330
CrossRef - Nezat CA, Hatch SA, Uecker T. Heavy metal content in urban residential and park soils: A case study in Spokane, Washington, USA. Appl Geochemistry. 2017;78:186-193. doi:10.1016/j.apgeochem.2016.12.018
CrossRef - Qasem NAA, Mohammed RH, Lawal DU. Removal of heavy metal ions from wastewater: a comprehensive and critical review. npj Clean Water. 2021;4(1). doi:10.1038/s41545-021-00127-0
CrossRef - Ghana Statistical Service. Sunyani municipality. Published online 2014. doi:10.1016/j.jdeveco.2009.09.012
CrossRef - Amponsah LO, Dodd M, Darko G. Gastric bioaccessibility and human health risks associated with soil metal exposure via ingestion at an E-waste recycling site in Kumasi, Ghana. Environ Geochem Health. 2022;44(2):497-509. doi:10.1007/s10653-020-00760-7
CrossRef - Konadu FN, Gyamfi O, Ansah E, et al. Human health risk assessment of potentially toxic elements in soil and air particulate matter of automobile hub environments in Kumasi, Ghana. Toxicol Reports. 2023;11(September):261-269. doi:10.1016/j.toxrep.2023.09.010
CrossRef - Akanchise T, Boakye S, Borquaye LS, Dodd M, Darko G. Distribution of heavy metals in soils from abandoned dump sites in Kumasi, Ghana. Sci African. 2020;10:e00614. doi:10.1016/j.sciaf.2020.e00614
CrossRef - Qing X, Yutong Z, Shenggao L. Assessment of heavy metal pollution and human health risk in urban soils of steel industrial city (Anshan), Liaoning, Northeast China. Ecotoxicol Environ Saf. 2015;120:377-385. doi:10.1016/j.ecoenv.2015.06.019
CrossRef - Asare A, Asamoah BD, Sanful PO. Assessment of Heavy Metal Contaminants Using Pollution Indices in Ankobra River at Prestea Huni-Valley District, Ghana. J Geosci Environ Prot. 2019;07(09):25-35. doi:10.4236/gep.2019.79003
CrossRef - Li Y, Zhou H, Gao B, Xu D. Improved enrichment factor model for correcting and predicting the evaluation of heavy metals in sediments. Sci Total Environ. 2021;755:142437. doi:10.1016/j.scitotenv.2020.142437
CrossRef - Swarnalatha K, Letha J, Ayoob S. An investigation into the heavy metal burden of Akkulam-Veli Lake in south India. Environ Earth Sci. 2013;68(3):795-806. doi:10.1007/s12665-012-1780-2
CrossRef - Sintorini MM, Widyatmoko H, Sinaga E, Aliyah N. Effect of pH on metal mobility in the soil. IOP Conf Ser Earth Environ Sci. 2021;737(1). doi:10.1088/1755-1315/737/1/012071
CrossRef - Agbeshie AA, Adjei R, Anokye J, Banunle A. Municipal waste dumpsite: Impact on soil properties and heavy metal concentrations, Sunyani, Ghana. Sci African. 2020;8:e00390. doi:10.1016/j.sciaf.2020.e00390
CrossRef - Hamid E, Payandeh K. Potential ecological risk assessment of heavy metals ( trace elements ) in coastal soils of southwest Iran.
- Darko G, Dodd M, Nkansah MA, et al. Distribution and ecological risks of toxic metals in the topsoils in the Kumasi metropolis, Ghana. Cogent Environ Sci. 2017;3(1):1-15. doi:10.1080/23311843.2017.1354965
CrossRef - Li S, Yang L, Chen L, Zhao F, Sun L. Spatial distribution of heavy metal concentrations in peri-urban soils in eastern China. Environ Sci Pollut Res. 2019;26(2):1615-1627. doi:10.1007/s11356-018-3691-6
CrossRef - Dung TTT, Cappuyns V, Swennen R, Phung NK. From geochemical background determination to pollution assessment of heavy metals in sediments and soils. Rev Environ Sci Biotechnol. 2013;12(4):335-353. doi:10.1007/s11157-013-9315-1
CrossRef - Basta NT, Juhasz A. Gastrointestinal Bioaccessibility Testing to Adjust Human Exposure to Arsenic from Soil Ingestion. Rev Mineral Geochemistry. 2014;79:451-472.
CrossRef - Rweyemamu AR, Nkansah MA, Darko G, Dodd M. Contamination and Human Health Risk Due to Toxic Metals in Dust from Transport Stations in the Kumasi Metropolis, Ghana. Chem Africa. 2020;3(3):831-843. doi:10.1007/s42250-020-00174-z
CrossRef - Allan K. Urban Park Soils Metals Distribution in the Victoria area, British Columbia. 2015;(February 2015):160.


