Distributed Embedded System for Air Quality Monitoring based on Long Range (LoRa) Technology
Hiral M Joshi
*
 , Vibhutikumar G. Joshi
and Hiteshkumar J. Lad
, Vibhutikumar G. Joshi
and Hiteshkumar J. Lad
1
Department of Physics,
V.N.S.G .University,
Surat,
Gujarat
India
Copy the following to cite this article:
Joshi H. M, Joshi V. G, Lad H. J. Distributed Embedded System for Air Quality Monitoring based on Long Range (LoRa) Technology. Curr World Environ 2024;19(1).
Copy the following to cite this URL:
Joshi H. M, Joshi V. G, Lad H. J. Distributed Embedded System for Air Quality Monitoring based on Long Range (LoRa) Technology. Curr World Environ 2024;19(1).
Citation Manager Publish History

Introduction
Air quality contamination has far-reaching consequences for climate, life expectancy, ecosystems, and standard of living. The concentration of population, industrial activities, and the growing number of vehicles poses significant health risks, particularly in urban areas.1. This research introduces a system designed to gather data on the levels of air pollutant gases, particulate matter, and various meteorological factors, leading to calculate the Air Quality Index (AQI) based on this comprehensive dataset. Air pollution monitoring is a complex yet crucial task. Traditional laboratory based methods such as gravimetric, spectroscopic and chemical method collects data periodically. Although this methods are well established and accurate, however they are very much time consuming and uses bulky instruments, hence not suitable for real-time monitoring at large scale 2.
With recent advancement in fields of Wireless Sensor Network (WSN) there are various gas sensors available to monitor the air pollution, such as electrochemical, infrared sensors, PID sensors, thermal conductivity, metal oxide sensors (MOS) etc.3, 4. MQ series sensor used in this study are the Metal Oxide-Semiconductor (MOS) sensor. MOS are the most suitable sensors for real time air pollutant detection. It provides high sensitivity characteristics, stability, low power consumption, low manufacturing costs with considerably long life-span 5, 6. Pollutant parameters are chosen based on its toxicity and health impact. Real-time concentration of particulate matter PM2.5 and PM10; air pollutant CO, NOX, O3, NH3 and meteorological parameters such as temperature, humidity and UV-index are considered.
Various transmission technologies such as Wi-Fi, ZigBee, Long Range (LoRa) modules are developed to establish communication in WSN 7. Many researchers have worked with various real world application of wireless sensor network system and communication technologies. Kandris et al., (2020) Provides thorough information on a wide range of applications for wireless sensor networks 8. Furthermore, Ullo et al., (2020) gives critical review on WSN application for various environment monitoring purpose and its challenges 9. Zhao et al., (2020) gives detailed review on application of various communication technologies in the field of air quality monitoring 10. This review article suggest that for indoor air quality monitoring, Wi-Fi is the majorly used communications protocols. Similarly, ZigBee protocol in WSN for measuring CO2 gas concentration level have been used within the campus 11. It has been observed that for city scale range, LoRa communication technology finds potential 12. Whereas, other technology focus on the speed and bandwidth but they drain more power moreover, they require additional memory due to their larger protocol stack, whereas, Long Range (LoRa) is a low powered, low bandwidth technology that is ideal for transmitting small size sensor data packets over long distance. It is a wireless radio communication technology that uses Chirp Spread Spectrum (CSS) modulation technique 13. It operates in sub-gigahertz frequency band in the range of 865 MHz to 867 MHz in India. It has low bit rate ranges from 0.3 kbps to 50 kbps 14 to 16. The LoRa modem enables long-distance communication, reaching up to 15 km or more in clear line of sight and 3 to 5 km in the presence of obstacles 17, 18.
The study aims to set up a DES system utilizing LoRa communication technology, dedicated to monitoring real-time AQI throughout city. This DES aims to tackle issues such as accessibility, availability, and the high costs associated with existing air quality measurement equipment. Moreover, sensing of various pollutant gas and particulate matter that forms AQI have been included together with measurement of meteorological parameter which not only provide real time AQI, but also will be suitable for the purpose of determining correlation and forecasting. The content of the paper can be summarize as follows: Starting with the proposed DES system architectures, nodes technical specification, sensor calibration and data extraction procedure is also discussed. System implementation, Long Range communication parameter and AQI calculation has been discussed in detail in succeeding sections. Details regarding statistical comparison between proposed DES system and pre-existing system has been given in data validation section. Lastly, paper ends with result and discussion followed by conclusion.
System Design
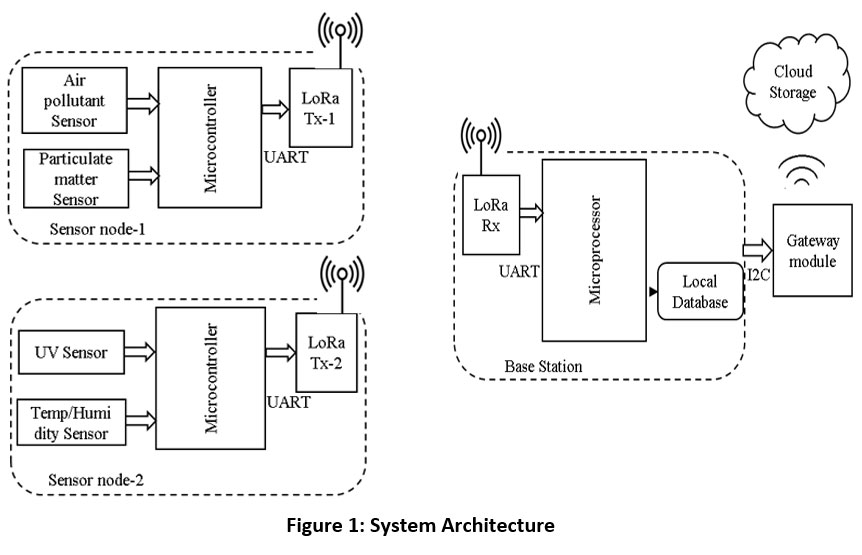
As shown in Figure 1, air quality monitoring system is composed of three parts: sensors for meteorological parameters and air pollution data acquisition, microcontroller for control and coordination, and gateway wireless module to transmit the data to the cloud storage.
 | Figure 1: System Architecture.
|
Sensor node comprises of sensors for air pollutants, Particulate Matters (PM) measurements, temperature, humidity and UV index sensor. ATmega328P microcontroller based embedded system is programed to detect the analogue sensor voltage and convert them into usable units of particular pollutant concentration. Microcontroller then transfers this data to the LoRa transmitter attached with each sensor node. At base station LoRa receiver module transfers received data to the attached microprocessor for further processing and analysis of air quality index and sub-indices. ESP8266 Wi-Fi module communicate with microcontroller through protocol to collects the data. It then load the data into Wi-Fi data frame payload and transmit them wirelessly to the cloud storage.
Particulate Matter Sensor
Table 1: Data Frame of the Sensor 19
Bite No. of the data frame | Content |
0th | Message header |
1st | Commander No. |
2nd | PM25 low byte |
3rd | PM25 high byte |
4th | PM10 low byte |
5th | PM10 high byte |
6th | ID byte1 |
7th | ID byte 2 |
8th | Check-sum |
9th | Message tail |
Particulate matter concentration measuring sensor used here is SDS011 optical sensor. The SDS011 PM sensor boasts a measurement range of up to 999 ug/m³ with a minimum resolution of 0.3 um, operating efficiently on an input voltage between 4.7 V to 5.3 V and requiring a power supply exceeding 1W 19. Functioning accurately in temperatures ranging from -10°C to +50°C and up to 70% humidity, the sensor utilizes UART protocol through Rx and Tx pins for communication with a microcontroller 19. Sensor operates based on the laser scattering principle to measure the particle concentration in the air. A tiny fan connected to the sensor generates negative pressure, ensuring consistent airflow into the measuring chamber. Light scattering induced when particles enters in the detecting area 19.
Scattered light is detected by Photodiode and gets converted into electrical signals, which then amplified and further processed. By analysing the waveform of signal Concentration and dimension of the particulate can be determined 20, 21.
It generates data frame of 10-bytes, as shown in Table 1, in which and concentration value is from byte-2 to byte-5. Algorithm to programme the microcontroller for extracting this concentration values of particulate from data frame is based on bellow equation.
Gas Pollutant Sensor
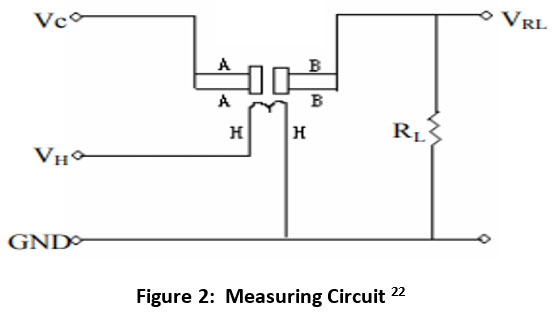
Gas pollutant sensors used here are MQ series sensors. Here MQ-7, MQ-137 and MQ-131 sensors are used to measure CO, NH3, NO2 and O3 concentration respectively. MQ sensors are resistive chemical sensors composed of micro Aluminium Oxide (Al2O3) with primary sensing material of SnO2 22. Operating voltage of sensor circuit is 5 V ± 0.1 V, using temperature ranges from -20oC to 50oC, at relative humidity less than 95% and standard oxygen condition (21%) should be maintained 22. sensor shows higher electrical resistance in clean air and its electrical resistance decreases with increase in presence of respective pollutant 22.
 | Figure 2: Measuring Circuit 22
|
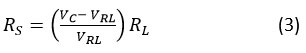
Figure 2 shows the basic test circuit of MQ sensors. Using this simple circuit, the variation in gas concentration within the surroundings can be translated to the change in conductivity. It requires two voltage inputs: heater voltage (VH) supplies voltage for the heater coil of the sensor, and circuit voltage (Vc) to drive the gas sensor circuit. VRL is the voltage across the load resistance (RL). An appropriate value needs to be set in order to improve sensor performance. Sensor resistance (RS) is inversely proportional to the concentration of the gas pollutant. Load resistance (RL) is adjusted to allow the sensor to obtain the full range of values. The sensor resistance Rs can be calculated by voltage divider circuit of Figure 2, from the equation,
Sensor Calibration
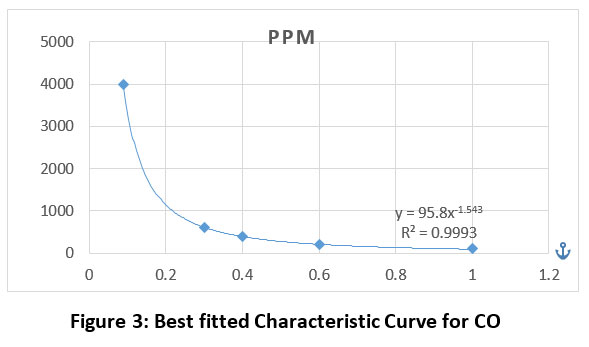
MQ series sensors are nonlinear sensors, hence it is necessary to calibrate them appropriately, before data acquisition, in order to improve data dependability 23. A calibration technique for gas sensors include finding a base value in clean air (R0) concentrations using the sensitivity characteristics curve provided in the manufacturer's datasheet. This result is then used to calculate the sensor resistance (RS) in presence of target gas. The resistance ratio to clean air (RS/R0) is computed, this ratio is used to derive the formula for real time concentration of target gas in PPM unit.
 | Figure 3: Best fitted Characteristic Curve for CO
|
Table 2: Components for Equation
Sensor | Target Gas | a | b |
MQ-7 | CO | 95.8 | -1.543 |
MQ-131 | O3 | 0.0295 | -0.993 |
NOX | 0.4163 | -1.993 | |
MQ-137 | NH3 | 35.995 | -2.965 |
New graphs have been plotted using the data points retrieved from the characteristic curves, as shown in Figure 3. Best fitted curves and their equations were calculated using the Microsoft Excel, so that they more accurately resembles the original characteristic curves.
The derived power function with a negative exponent has the following formula:
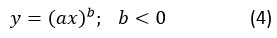
Solving above equation using nonlinear regression equation, target gas concentration a(RS/R0)b ppm. Component a and b value obtained from best fitted characteristic curve for CO, O3,NOx and NH3 is mentioned in Table 2.
System Implementation
Prototype system has been implemented at various location in Surat city as shown in Google map in Figure 4. Total five location has been strategically selected in a way so that it gives rough idea of air quality of overall city. Details of the location where sensor nodes deployed are: (1) Railway Station, (2) Textile market, (3) Civil Hospital, (4) Athwalines River-front and (5) One of the Metro rail construction site. Base station location has been selected such that it provide good connectivity to the LoRa receiver from LoRa transmitters attached at all the sensor nodes.
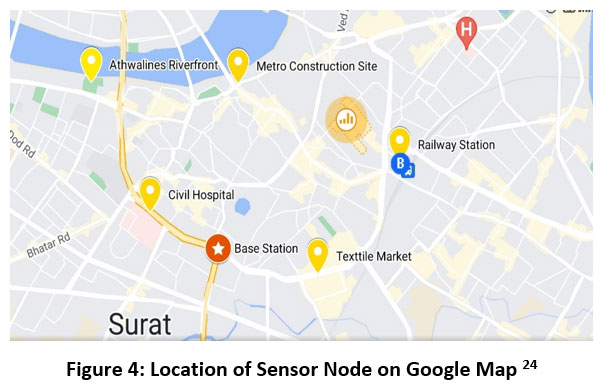 | Figure 4: Location of Sensor Node on Google Map 24
|
LoRa Communication
LoRa module used here is Reyax RYLR896 module consists of Semtech SX1276 transceiver chip. Each LoRa Communication network has a unique Network ID, and each LoRa device within the network has a specific address. Central frequency of wireless band has been set at 865 MHz. To communicate with each other, the transmitter and receiver must utilise the same frequency band. Available range for Spreading Factor (SF) is from7 to 12. SF represents the number of symbols transferred per bit of information. Here communication is within 3 km range, hence suitable SF will be 10. Signal bandwidth has been set at default 125 kHz. In order to establish communication SF, bandwidth and other network parameters also should be same within network.
AQI Calculation
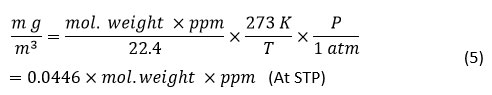
Gas pollutant Concentrations are considered in unit of either or as per the national ambient air quality guidelines. MQ sensor gives pollutant concentration in ppm, for this conversion the ideal gas equation is used to as follow:
An Air Quality Index (AQI) is a holistic approach that translates diverse air pollution and particulate concentration values into a unified numerical representation. Through numerical manipulation, it simplifies parameter values into a more straightforward and comprehensive form.
As per the pollution control board guidelines of the country, particulate matter PM2.5 and PM10 in addition with pollutant gas NO2, SO2, CO, O3, NH3 and Pb are considered in near real-time dissemination of AQI. Each parameter is translated into a Sub-Indices based on pre-defined categories, as given in Table 3. Final real-time AQI is the maximum of Sub-Indices, with the condition that at one of particulate matter concentration and at least three out of the eight other pollutant should be available25.
For pollutant concentration “C”, sub-index is calculated by formula:
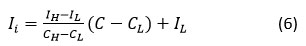
Where,
Ii = Sub-index for given parameter
C = Observed pollutant concentration
CL = Break point concentration < C
CH = Break point concentration > C
IL = Index value corresponding to CL
IH = Index value corresponding to CH
Table 3: Breakouts Points for AQI 25
AQI Category (Range) | PM10 | PM2.5 | NO2 | O3 | CO | NH3 |
Good (0–50) | 0–50 | 0–30 | 0–40 | 0–50 | 0–1.0 | 0-200 |
Satisfactory (51–100) | 51–100 | 31–60 | 41–80 | 51–100 | 1.1–2.0 | 201-400 |
Moderate (101–200) | 101–250 | 61–90 | 81–180 | 101–168 | 2.1–10 | 401-800 |
Poor (201–300) | 251–350 | 91–120 | 181–280 | 169–208 | 10–17 | 801-1200 |
Severe (301–400) | 351–430 | 121–250 | 281–400 | 209–748 | 18–34 | 1201-1800 |
Hazardous (401+) | 430+ | 250+ | 400+ | 748+ | 34+ | 1800+ |
Data validation
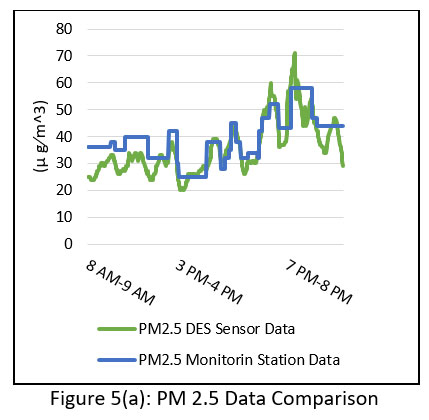
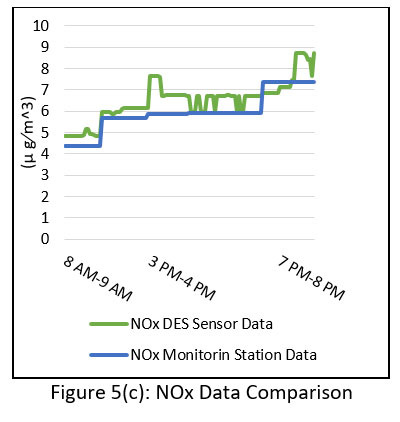
To validate the performance of the DES system, it has been compared with meteorological station established by local administration agency. Particulate matter, CO, and NOx sensors have been installed in the same vicinity of meteorological station. Total 124 number of readings for NOx and CO and 492 numbers of reading for Particulates Matter has been taken for hour interval in morning (8:00 AM to 9:00 AM), afternoon (3:00 PM to 4:00 PM) and evening (7:00 PM to 8:00 PM). Figure 5(a), 5(b), 5(c), and 5(d) present a graphical comparison between the observed data from the DES sensor and the meteorological station data for pollutants PM2.5, PM10, NOx and CO gas, respectively.
.jpg) | Figure 5(a): PM 2.5 Data Comparison
|
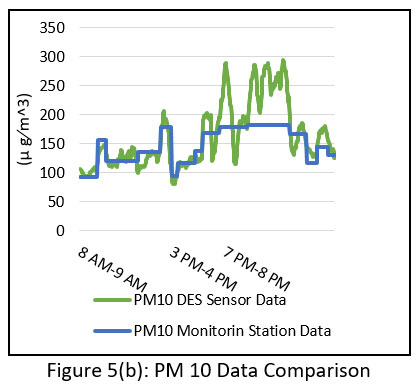 | Figure 5(b): PM 10 Data Comparison.
|
 | Figure 5(c): NOx Data Comparison.
|
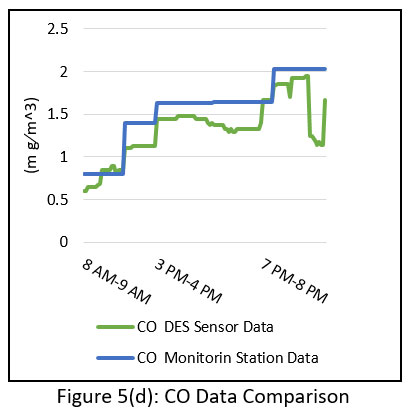 | Figure 5(d): CO Data Comparison.
|
Comparative statistical analysis results are tabulated in Table 4. The correlation coefficient and R2 for PM2.5, NOx, and CO are more than 0.7, indicating that sensor readings are in high agreement with meteorological station data. The R2 for PM10 is 0.65, indicating that the results are not particularly accurate. Lower values of mean absolute error (MAE) and root mean square error (RMSE) readings indicate a good correlation between sensor data and metrological site data. Smaller value of Mean Bias Error (MBE) implies accuracy of calibrated sensor. Positive MBE value for NOx and PM2.5 indicate that readings are slightly overestimated, whereas negative MBE value for CO and PM10 indicate that readings are slightly underestimated compared to meteorological site data.
Table 4: Statistical Analysis Parameter
Parameters | PM2.5 | PM10 | NOx | CO |
No. of data taken | 492 | 492 | 124 | 124 |
Correlation Coefficient | 0.8443 | 0.806 | 0.838 | 0.859 |
R2 | 0.713 | 0.650 | 0.702 | 0.739 |
Mean Absolute Error (MAE) | 5.25 | 26.51 | 0.66 | 0.24 |
Mean Bias Error (MBE) | -0.022 | 0.012 | 0.00408 | -0.00121 |
Root Mean Square Error (RMSE) | 0.496 | 0.497 | 0.0449 ) | 0.0179 |
Result
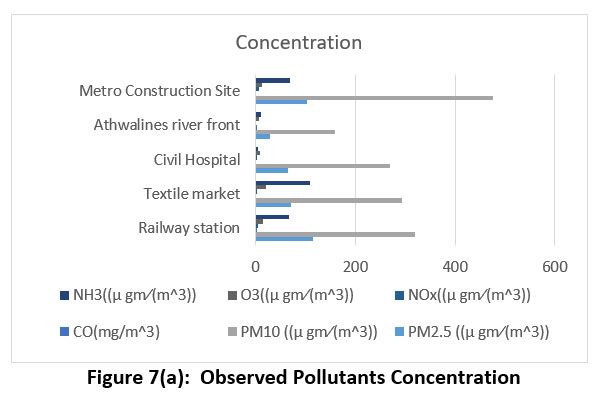
Sensor data from all five location of Surat city have been collected by sensor nodes. These data then transmitted by Lora transmitter modules attached with sensor node to the LoRa receiver module at the base station. At base station, these data have been further processed at the base station, AQI is calculated and transferred to the cloud for the storage purpose. Base station LoRa receiver module comport image is shown in Figure 6 for understating nature of received data and pollutant data separation. The data have been collected in April, when summer is almost at its peak in the city. Average temperature and relative humidity were 37°C and 32%, respectively. The average UV index have been observed to be 11 during day time. Pollutants concentration and its sub-indices of all five locations are shown in graphs of Figure 7(a) and Figure 7(b) respectively. It is clear from the graphs that major pollutant throughout the city are particulate matters. It has been observed that Athwalines riverfront has the lowest AQI of 139, which is in moderately polluted category. Metro construction site has the highest AQI of 458, which falls into hazardous category.
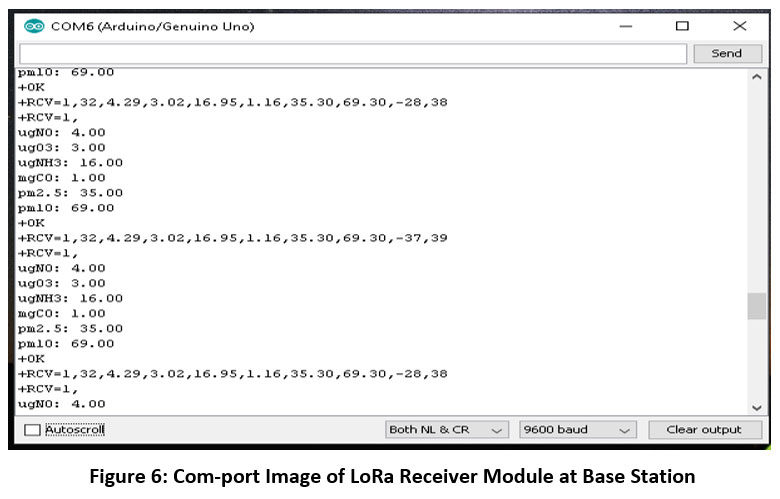 | Figure 6: Com-port Image of LoRa Receiver Module at Base Station
|
 | Figure 7(a): Observed Pollutants Concentration.
|
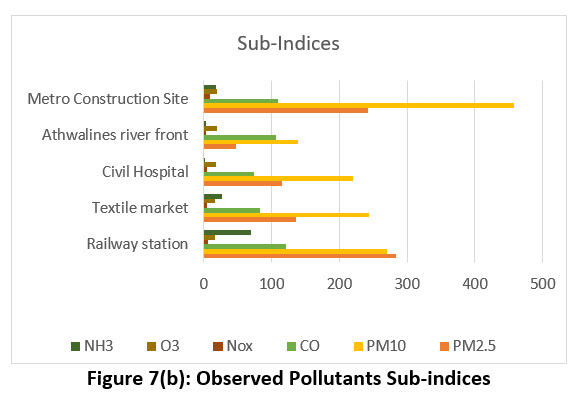 | Figure 7(b): Observed Pollutants Sub-indices
|
Table 5 give the information regarding distance of base station from various sensor nodes and observed LoRa receiver parameter at that distance. LoRa receiver module attached at base station observes Received Signal Strength Indicator (RSSI) ranges from -60 dBm to -114 dBm. It has been observed that received signal strength decreases as distance between nodes increase. In this case, RSSI have been observed to be within acceptable range, allowing communication within 2.6 km distance. Data have been received without any error and complete packet loss. If RSSI further deteriorates or large packet loss observed, by selecting appropriate network parameters, RSSI and hence communication efficiency can be improved. Additionally, observed base station LoRa receiver module Signal to Noise Ratio (SNR) ranges from 3 dB to 57 dB. Positive SNR indicates that LoRa communication operates above the noise floor in this case. It was observed that when line of sight is clear SNR is good, whereas with increase in obstacle within the Fresnel zone, SNR deteriorates. SNR can be improved by placing LoRa module at higher altitude. Also AQI, its severity and determining pollutant of all the sensing location is also given in Table. 5.
Table 5: Receiver Parameter and Pollutant Category
Location | Distance From base station (km) | LoRa Receiver parameter | AQI | Determining pollutant | Severity | |
RSSI (dBm) | SNR (dB) | |||||
Railway Station | 2.5 | -107 | 10 | 283 | PM2.5 | Poor |
Textile Market | 1.4 | -75 | 42 | 244 | PM10 | Poor |
Civil Hospital | 1 | -60 | 57 | 220 | PM10 | Poor |
Athwalines River front | 2.6 | -114 | 3 | 139 | PM10 | Moderate |
Metro Construction Site | 2 | -89 | 28 | 458 | PM10 | Hazardous |
Conclusion
In this paper, Long Range (LoRa) technology based prototype system has been set up to monitor real time air quality index. The system has been successfully implemented in Surat city. Sensors calibration procedure and statistical analysis comparing DES system data with that from a government-established meteorological station validates its accuracy and reliability. Meteorological parameters data have been recorded, which may be used to study long-term trends and improve air quality index. Use of LoRa technology for communication between nodes provide city-scale coverage. It has been concluded that proposed DES provides promising and cost solution for wide spread continuous real-time air quality monitoring in urban environments, addressing the challenges of air pollution with efficiency and affordability.
Acknowledgements
The author would like to thank the research guide Dr. V. G. Joshi for his support, guidance, and valuable feedback. And thanks to V.N.S.G University, Surat for providing necessary resources and facilities to carry out this research work.
Funding Sources
The author(s) received no financial support for the research, authorship, and/or publication of this article.
Conflict of Interest
The author(s) declares no conflict of interest.
Authors’ Contribution
The authors confirm contribution to the paper as follows: Conceptualization 1, 3, Methodology 1, 3, Experimental work and data collection 1, Analysis 1, original draft writing 1, Review and edit 2, 3 and Supervision 2.
Data Availability Statement
The manuscript incorporates all datasets produced or examined throughout this research study. Raw data that supports the findings of this study are available from the corresponding author on request.
Ethics Approval Statement
Not applicable.
References
- Manisalidis I, Stavropoulou E, Stavropoulos A, Bezirtzoglou E. Environmental and health impacts of air pollution: A review. Front Public Health. 2020;8. doi:10.3389/fpubh.2020.00014
CrossRef - Idrees Z, Zheng L. Low cost air pollution monitoring systems: A review of protocols and enabling technologies. J Ind Inf Integr. 2020;17(100123):100123. doi:10.1016/j.jii.2019.100123
CrossRef - Kingsy Grace R, Manju S. A comprehensive review of wireless sensor networks based air pollution monitoring systems. Wirel Pers Commun. 2019;108(4):2499-2515. doi:10.1007/s11277-019-06535-3
CrossRef - Pang X, Chen L, Shi K, et al. A lightweight low-cost and multipollutant sensor package for aerial observations of air pollutants in atmospheric boundary layer. Sci Total Environ. 2021;764(142828):142828. doi:10.1016/j.scitotenv.2020.142828
CrossRef - Mane SA, Nadargi DY, Nadargi JD, Aldossary OM, S. Tamboli M, Dhulap VP. Design, development and validation of a portable gas sensor module: A facile approach for monitoring greenhouse gases. Coatings. 2020;10(12):1148. doi:10.3390/coatings10121148
CrossRef - Sai KBK, Mukherjee S, Sultana HP. Low cost IoT based air quality monitoring setup using Arduino and MQ series sensors with dataset analysis. Procedia Computer Science. 2019;165:322-327.
CrossRef - Gupta SK, Singh S. Survey on energy efficient dynamic sink optimum routing for wireless sensor network and communication technologies. Int J Commun Syst. 2022;35(11). doi:10.1002/dac.5194.
CrossRef - Kandris, D., Nakas, C., Vomvas, D., & Koulouras, G. Applications of wireless sensor networks: an up-to-date survey. Applied system innovation, 2020;3(1), 14.
CrossRef - Ullo, Silvia Liberata, and Ganesh Ram Sinha. Advances in smart environment monitoring systems using IoT and sensors.Sensors 20.11 (2020): 3113.
CrossRef - Zhao, Liang, Ye Yang, and Zhenyu Wu. Review of Communication Technology in Indoor Air Quality Monitoring System and Challenges. Electronics 11.18 (2022): 2926.
CrossRef - Lara-Cueva, R. A., Meneses, P. B., Márquez, M. D., Gordillo, R. X., & Benítez, D. S. Air quality monitoring system within campus by using wireless sensor networks. In 2019 14th Iberian Conference on Information Systems and Technologies (CISTI) 2019: (pp. 1-4). IEEE.
CrossRef - Andrade, Roberto Omar, and Sang Guun Yoo. A comprehensive study of the use of LoRa in the development of smart cities. Applied Sciences 9.22; 2019, 4753
CrossRef - Tao W, Zhao L, Wang G, Liang R. Review of the internet of things communication technologies in smart agriculture and challenges. Comput Electron Agric. 2021;189(106352):106352. doi:10.1016/j.compag.2021.106352
CrossRef - Reynders B, Pollin S. Chirp spread spectrum as a modulation technique for long range communication. In: 2016 Symposium on Communications and Vehicular Technologies (SCVT). IEEE; 2016.
CrossRef - SEMTECH Wireless, sensing & timing datasheet for SX1276/77/78/79. (SX1276-7-8.book (mouser.com))
- Devalal S, Karthikeyan A. LoRa technology - an overview. In: 2018 Second International Conference on Electronics, Communication and Aerospace Technology (ICECA). IEEE; 2018.
CrossRef - Husein, N. A. A., Abd Rahman, A. H., & Dahnil, D. P. (2019). Evaluation of LoRa-based air pollution monitoring system. International Journal of Advanced Computer Science and Applications, 10(7).
CrossRef - Magrin D, Centenaro M, Vangelista L. Performance evaluation of LoRa networks in a smart city scenario. In: 2017 IEEE International Conference on Communications (ICC). IEEE; 2017.
CrossRef - Nova SDS011 laser PM sensor data sheet. (Laser PM2.5 Sensor specification (cdn-reichelt.de))
- Joshi HM, Lad HJ, Joshi VG. Cloud-based portable and cost-effective particulate matters concentration estimation system. In: 2020 4th International Conference on Electronics, Communication and Aerospace Technology (ICECA). IEEE; 2020
CrossRef - Li J, Mattewal SK, Patel S, Biswas P. Evaluation of nine low-cost-sensor-based particulate matter monitors. Aerosol Air Qual Res. 2020;20(2):254-270. doi:10.4209/aaqr.2018.12.0485
CrossRef - MQ-7 Sensor technical datasheet, Hanwei Eletronics. (MQ-7.doc (sparkfun.com))
- Sales-Lérida D, Bello AJ, Sánchez-Alzola A, Martínez-Jiménez PM. An approximation for metal-oxide sensor calibration for air quality monitoring using multivariable statistical analysis. Sensors (Basel). 2021;21(14):4781. doi:10.3390/s21144781
CrossRef - Google map: Sensor Nodes Location (google.com).
- “National Air Quality Index”, Control of Urban Pollution Series: CUPS/82/2014-15. (http://app.cpcbccr.com/ccr_docs/FINAL-REPORT_AQI_.pdf).


