Exploring Cost Effective Fleet Electrification Possibilities for Public Transit Services in Kutch Region
Mamta L Prajapati1
*
 and Nipa A. Desai2
1
Civil Engineering Department,
Tolani. F. G. Polytechnic, Adipur, Gujarat Technological University,
Ahmadabad,
Gujarat
India
2
Civil engineering Department, Neotech Institute of Technology,
Affiliated to Gujarat Technological University,
Vadodara,
Gujarat
3
Copy the following to cite this article:
Prajapati M. L, Desai N. A. Exploring Cost Effective Fleet Electrification Possibilities for Public Transit Services in Kutch Region. Curr World Environ 2024;19(1).
Copy the following to cite this URL:
Prajapati M. L, Desai N. A. Exploring Cost Effective Fleet Electrification Possibilities for Public Transit Services in Kutch Region. Curr World Environ 2024;19(1).
Citation Manager Publish History

Introduction
India's "Shoonya Campaign" pursues the ambitious objective of achieving net zero emissions by 2070.1-3Rooted in the Sanskrit word "Shoonya," meaning zero, this campaign underscores the paramount need to revolutionize the transport sector. The envisaged transition entails a radical and expeditious shift toward zero-emission vehicles, effectively putting an end to emission-spewing transportation systems. Urban centers bear the brunt of the negative ramifications of transportation systems heavily reliant on fossil fuels. The resulting emissions profoundly impact the urban environment, upsetting ecological equilibrium. As a remedy, sustainable transportation emerges as a pivotal strategy in the development of sustainable cities, aligning with contemporary trends that champion the "green corridor" model. In today's urban landscapes, planning and design trends increasingly embrace concepts such as smart growth, new urbanism, and sustainable transportation policies as viable alternatives to conventional urban transport approaches. Moreover, there is growing emphasis on harnessing renewable energy sources as a bulwark against pollution, global warming, ozone depletion, and other pressing environmental issues. ?In 2013, the Indian government launched an agenda called the National Electric Mobility Mission Plan (NEMMP) 2020. 1-3This plan aims to make India less dependent on foreign oil by encouraging people to use electric and hybrid vehicles. As part of this plan, the government started a lineup called Faster Adoption and Manufacturing of Hybrid & Electric Vehicles (FAME India). FAME India focuses on four things: developing new technology, helping people understand the benefits of electric and hybrid vehicles, doing pilot projects, and building places where people can charge their vehicles. An electric bus has been designed to meet the need for a transportation system that is better for the environment. This bus does not produce any harmful emissions and runs quietly. It is a leader in the industry because it not only sets high standards for technology but also comes up with new ways to meet the unique needs of Indian travelers.
Based on a comprehensive study of literature from diverse sources, the following key findings have emerged. Experts and Researchers worldwide focuses on four pillars of energy systems based on the following elements: renewable energy, energy-efficient buildings, energy storage, and smart grids combined with electricity.4 The reference article assesses energy usage models for the Asian region.5Amodel described by the author predicts that the reduction of carbon emissions in developing countries will be achieved not only by reducing carbon intensity but also by breaking the historical tie between the usage of energy and upturn.6The author has designed a model that predicts a reduction in carbon emissions in developing countries.7A comprehensive Transport Energy Consumption (TEC) evaluation model has been developed for the design, operation, and life cycle assessment of electric vehicles (EVs) and it is documented that the rapid worldwide implementation of EVs is crucial for improving the road environment and is considered a key factor in achieving the goal of carbon neutrality.8In this reference study, the authors presented a cutting-edge fleet management framework designed specifically for electric vehicles (EVs). The innovative architecture delivers a range of real-time services to fleet management companies, aimed at optimizing fleet monitoring capabilities.9The findings of the research rely on a dataset comprising 60 routes and five different car models (Tesla Model 3, Audi e-Tron, Tesla Model S, Kia e-Niro, and VW ID.3), which may necessitate further investigation for unique scenarios and specific geographical areas. Nevertheless, it is reasonable to assume that the general patterns and conclusions derived from this study are reliable, as the selected routes are well-distributed and reasonably reflective of conditions in Germany.10In a study, the authors introduced charging stations for battery recharging, including the duration of charging at each designated station, non-linear concave charging profiles, and service time and frequency.11Consequently, in the reference, the author explored the challenge of routing in a smart travel system, wherein the travel duration links are considered as uncertain quantities. The objective is to lower both the total energy demand and travel length. To accomplish this, adaptive warnings are implemented to create a state-space-time network that accurately represents the unpredictable traffic conditions. Additionally, signals are employed that dynamically adjust travel times based on signal information, such as signal sign, green zone, and red time.12 Reference shows that the study of multi-objective optimization encompasses three key facets: energy consumption, travel duration, and battery longevity. The findings underscore the impact of terrain on route selection. Energy consumption is notably affected by topography, particularly in the case of electric vehicles, where the ability to regenerate energy while traveling downhill creates a substantial correlation between energy consumption and the terrain's features.13Research suggested that the additional electricity generation required for the adoption of electric vehicles in all countries is only a small part of their current national production and providing this electricity through dedicated renewable energy generation will increase economic and environmental benefits.14 The author proposed solving methods for the charging problems by considering port and road network factors, economic considerations, the operation of the electric network, and the ease of use of electric vehicles in Guwahati city.15
Materials and Methods
Fleet electrification involves replacing traditional gasoline-powered vehicles with electric vehicles. ? In the present research the entire study is divided into four major stages. The first stage represented in section 3.1 involves identification of problems and collection of data in which problems related to dependency of transport sector on gasoline-based energy and its consequences were identified and objectives for the present study were defined. In the second stage, keeping in mind the necessity of reducing energy dependence and objectives of exploring fleet electrification possibilities, data was collected from a selected study area and based on the recommendations extracted from literature, the standard specifications were fixed for charging infrastructure, operational efficiency, and cost optimization along with detailed explanation about various attributes adopted for fleet electrification planning in the present study as represented in section 4.1 and4.2. During third Stage, collected data was further analyzed and modeled to access fleet electrification possibilities considering various optimization parameters as mentioned in section 5.1,5.2 and 5.3.In Stage four the model output was assessed based on its potential for implementation and final recommendations were given.
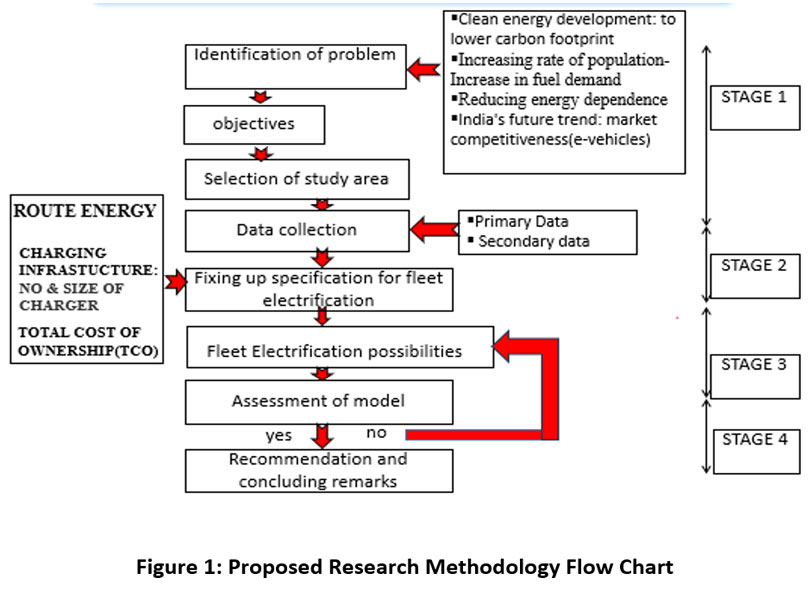 | Figure 1: Proposed Research Methodology Flow Chart
|
Study area delineation and data collection
Data collection pertaining to existing transit bus services
Clean energy development reduces carbon footprints by switching from fossil fuels to renewable like solar, wind, and hydroelectric power, cutting greenhouse gases and promoting sustainable growth. India's e-vehicle market is set to soar due to government support, technology progress, and rising eco-consciousness. In study data collection involves systematically gathering relevant input through various techniques such as surveys, interviews, observations, and document analysis.
Identification of problem and study objectives
Population growth drives up fuel demand due to increased transportation, industry, and energy use. To reduce dependency, nations must diversify energy sources, improve efficiency, and adopt renewable energy, ensuring security and sustainability. Implementing sustainable energy policies is crucial to mitigate environmental impact and ensure long-term energy security. With a focus on emission reduction and fossil fuel independence, India's electric vehicle sector is set for rapid expansion, offering lucrative opportunities for domestic and global players.
The study aims to evaluate two main objectives: assessing the current dependency on transportation fuel consumption and conducting an air quality impact assessment of diesel-operated public buses. Additionally, it seeks to explore the potential for fleet electrification and assess the feasibility of transitioning to environmentally sustainable energy sources to replace existing fuels.
Study area profile
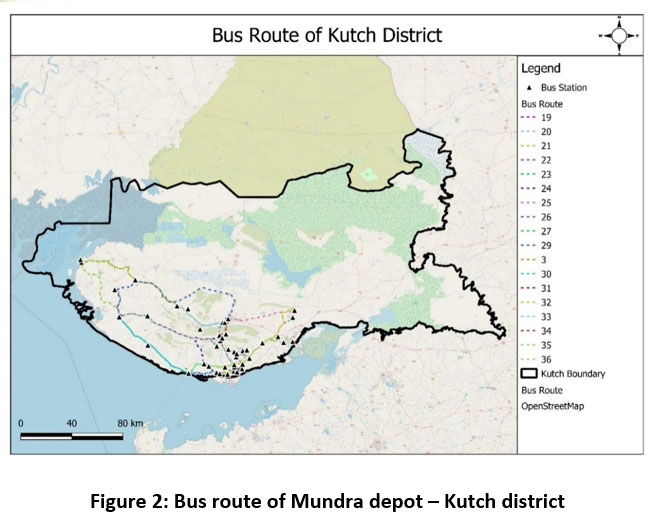
Kutch is the largest district in India, covering an area of 45,674 km². The population of Kutch is approximately 2,092,371. It comprises 10 talukas, 994 villages, and 8 municipalities. Kutch is well-connected to major Indian cities, including Ahmedabad, Vadodara, Surat, Mumbai, Delhi, Kolkata, Pune, Ghaziabad, Jaipur, Ajmer, Hapur, Moradabad, Bareilly, Kharagpur, Ujjain, and others, via a comprehensive railway network. The city boasts a domestic airport, offering daily flights to Mumbai operated by Air India. Additionally, state transport buses, known as GSRTC (Gujarat State Road Transport Corporation), are readily available in the city center, providing convenient access to various destinations. Furthermore, numerous private tour operators offer frequent bus services to major cities within and beyond the state of Gujarat. For local transportation within the city, residents and visitors rely on city buses and auto rickshaws.
 | Figure 2: Bus route of Mundra depot – Kutch district
|
The Kutch-Bhuj GSRTC Division is divided into eight main bus stations, including Bhuj, Bhachau, Mandvi, Rapar, Mundra, Naliya, Anjar, and Nakhatrana. There are a total of 203 major routes in the Kutch-Bhuj. The map of Mundra-Kutch district was prepared in GIS, earlier prescribed mentioned criteria in which 5 buses out of 18 having a state of charge not less than 25% have been selected for the study are 20,26,29,31 and 32 shown in the highlighted legend.
Data on different types of buses operated by GSRTC in the Kutch district, including bus type, distance traveled in kilometers, departure times, and arrival times, were obtained from the Bhuj divisional office. The Kutch-Bhuj Division comprises eight primary bus stations, housing a combined fleet of 381 buses that collectively travel around 82,916 kilometers each day, serving around 530 stops. On average, these buses transport approximately 150,000 passengers daily.
In the study, the Mundra terminal, one of the eight divisions, was considered. It operates a total of 18 buses covering 22 routes with 103 trips in a day. After conducting energy modeling simulations, optimal buses were selected based on their energy consumption, specifically their state of charge. Buses with the lowest energy consumption were given priority as they require less charging and can complete their daily routes with minimum charging of buses. As a result, 5 buses were selected in the first phase, later by modifying the selection criteria possibility of considering other buses can be done.
Fixing up specifications and selection of various parameters for fleet electrification planning
For planning of fleet electrification considering enhancement in bus efficiency, fleet's energy consumption under various scenarios, range, and sustainability following attributes are adopted. Various specifications fixed for the below-mentioned attributes are discussed in further sections.
Route Energy planning
Travel Characteristics identification.
Selection of electric battery
Charging Infrastructure planning
Economical assessment.
Fixing up specifications for fleet electrification planning
Fleet electrification planning involves strategizing the transition of vehicles from traditional internal combustion engines to electric power trains. This entails evaluating infrastructure requirements, assessing vehicle suitability, and implementing charging solutions to optimize fleet operations while reducing emissions and enhancing sustainability.
Route Energy planning
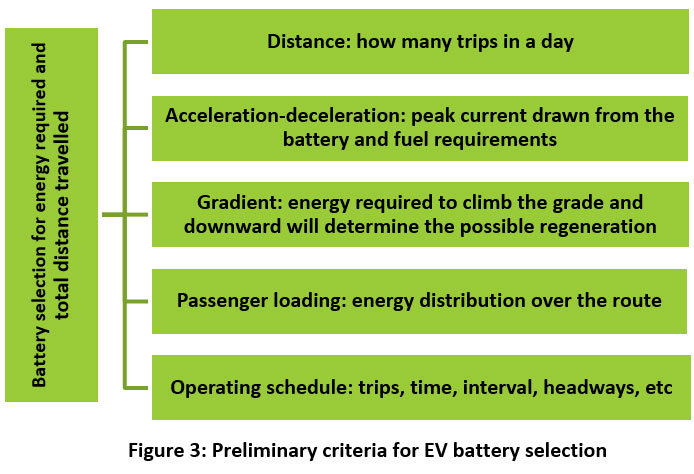
Route energy planning is essential for maximizing the efficiency and range of electric fleets. By considering vehicle capabilities, charging infrastructure, driving practices, and utilizing dedicated software, the way can be paved for a smooth and cost-effective transition to cleaner transportation. In the context of electric buses (EV buses), route energy refers to the total energy consumption required by a specific bus route. It serves as a critical metric for assessing the efficiency and practicality of electric bus operations. The energy consumption of an electric bus can vary significantly based on factors outlined in Table 1.
Table 1: Factors associated with route energy planning
Factor associated with route energy planning | Description |
Average Speed of travel | Buses with less travel speed and frequent breaking benefit from regenerative braking systems. |
Payload Weight | Heavier loads demand more energy, requiring adjustments in route planning and charging |
Weather conditions | Cold temperatures reduce battery range, necessitating careful consideration in winter months. Intense heat or humidity may reduce batteries life and necessitate adjustments. |
Vehicle Condition | Old vehicles consume more power compared to new vehicles. |
While considering energy modeling for electric buses, there are several specific factors and points to be considered. These variables collectively influence how much energy a bus will utilize on a specific route.
Travel Characteristics identification
Travel characteristics are crucial in planning the transition of fleets to electric vehicles (EVs) effectively. Understanding these factors optimizes operations, ensures sufficient range, and minimizes costs. Essential characteristics considered for the present study are listed below.
Table 2: Factors associated with route characteristics identification
Factor associated with travel characteristics identification. | Description |
Route Type | High-speed highways may require higher battery capacity than urban streets. |
Total Distance | Long highway stretches require different planning compared to short deliveries within cities. |
Terrain | Hilly and mountainous regions demand more energy than flat plains. |
Traffic pattern | Congestion and travel delays significantly impact energy consumption. |
Identifying and understanding travel characteristics are key steps in successful fleet electrification. Utilizing a data-driven approach, specialized tools, and stakeholder collaboration ensures smooth operations, maximizes range and efficiency, and propels a sustainable future for fleets. Continuous monitoring and adaptation based on real-world data are vital for optimizing routes and integrating EVs into transportation systems smoothly.
Selection of Electric Battery
Electric buses rely on batteries to store the energy that propels them. The number and size of batteries required depend on several factors, such as the bus size and its required driving range. Choosing the right battery type is crucial for energy density, cycle life, safety, and optimal performance. This decision influences the efficiency, range, and lifespan of an entire electric bus fleet. Electric bus batteries typically use lithium-ion battery technology owing to their properties like long lasting, Fast Charging, Good performance and Safety compared to other batteries. Different types of lithium-ion chemistries, such as NMC (Nickel Manganese Cobalt), NCA (Nickel Cobalt Aluminum), and LFP (Lithium Iron Phosphate), are commonly used, with each offering different trade-offs in terms of energy density, cycle life, and safety.
Different chemistries offer trade-offs: NCM (Nickel-Cobalt-Manganese)batteries: High energy density but have safety concerns and shorter lifespans.LFP (Lithium Iron Phosphate) batteries: Safer and have longer lifespan but lower energy density, limiting range.LTO (Lithium Titanate Oxide) batteries: Excellent for frequent, fast charging and cold weather performance but are expensive and have lower energy density. Different EVs are used for different purposes, and the battery needs to provide sufficient energy to cover the expected distance on a single charge. For instance, a commuter car may have a different range requirement than a long-haul electric truck. Selecting a battery that can meet or exceed the required range is essential to ensure that the EV serves its intended purpose. Various factors influencing battery selection are described in Table 3.
Table 3: Attributes associated with selection of electric battery
Attributes associated with selection of electric battery | Description |
Battery useful Life cycles
| Generally, bus battery is designed for 10years i.e.3,500 cycles |
Charging time | Depends on voltage 1C- 2hour, 2C-1 hour. |
Distance covered in one cycle charge | Big battery-300-350kwh Small battery- 150-250kwh |
Battery cost | 22,00,125 (e-Bus Fixed & Big Battery, with subsidy), 4,50,090 (e-Bus Fixed & Small Battery (AC), with subsidy)
|
Battery DOD (depth of discharge)
| 80% (e-Bus Fixed & Big Battery, with subsidy)
|
Battery Size and Range | Electric buses with larger battery capacities and longer ranges may require less frequent charging, potentially reducing the number of chargers needed. 320 (Big Battery), 180 (small battery) |
By considering these factors, planners can select the optimal battery type and design efficient routes for their electric bus fleets.
 | Figure 3: Preliminary criteria for EV battery selection
|
Charging Infrastructure
The charging infrastructure plays a crucial role in maintaining efficient bus operations. The speed with which an electric vehicle (EV) battery recharges determines the appropriate charging option. Different parameters are to be considered for determining the number and size of chargers for electric buses. They are summarized in table no 4.
Table 4: Attributes associated with charging infrastructure
| Attributes associated with Charging infrastructure. | Description |
| Location and Accessibility | Depot charging, mobile chargers or partnerships with existing infrastructure should be considered. Mapping of existing charging stations and planning of routes accordingly. |
| Charging speed | Prioritizing routes with fast-charging stations for long journeys is beneficial. There are typically three levels of charging for electric buses: slow, fast, and rapid. |
| Capacity | Fast: 1. Combined Charging System (CCS) (min 50 kW) 2. Charged Move (CHAdeMO) (min 50 kW). 3. Type-2 AC (min 22 kW) Slow: 1. Bharat DC-001 (15 kW) 2. Bharat DC-001 (15 kW) 3. Bharat DC-001 (10 kW)16 |
Cost for utilizing charging infrastructure.
| Charger Cost - @ 7.5Lakh /Fast Chargerx3 -@ 1.5Lakh/ Slow Charger x 3 Total - 22.5Lakh + 4.5Lakh = 27Lakh Transformer + Connection + Beaker etc-8L Branding Cost - 3Lakh Software maintenance - 0.5Lakh / Year Technician/ Labor - 2.5Lakh / Year Maintenance - 1.8Lakh / Year |
| Number of nodes available for charging | A larger fleet will require more chargers to ensure that all buses can be charged as needed. As per India government norms compulsory 3-fast and 3-slow chargers are to be installed. |
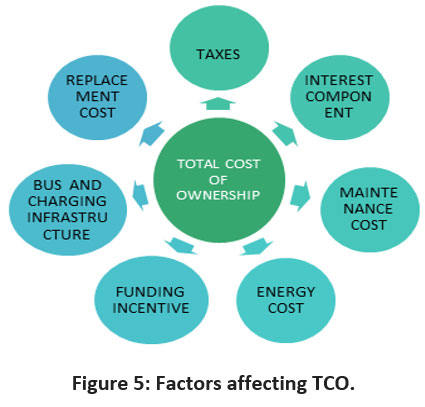
Economical assessment
The overall financial cost in running an electric bus(EV bus) involves a comprehensive financial analysis that reflect all expenses associated with investment, operating, and maintaining the bus over its entire life period. TCO represents a critical metric for evaluating the economic feasibility and benefits of transitioning to electric buses compared to traditional internal combustion engine (ICE) buses. A breakdown of the components contributing to the TCO for EV buses includes are shown in table no 5.
Table 5: Attributes associated with Economical assessment
| Attributes associated with Economical assessment. | Description |
| Initial cost | This incorporates the expense of acquiring the electric bus, which may be higher than that of a traditional ICE bus due to the electric power train and battery technology. Charging Infrastructure Costs: These encompass expenses related to the installation and maintenance of charging stations, including infrastructure upgrades and installation labor. |
| Operating Costs | These represent the cost of charging the bus batteries, which can vary based on electricity rates, charging infrastructure efficiency, and the bus's energy consumption. |
| Maintenance cost | Electric buses, while generally requiring less maintenance than ICE buses due to having fewer moving parts, still necessitate consideration of maintenance costs. Also includes costs associated with replacing tires due to wear and tear. |
| Battery Replacement | This encompasses the cost of replacing the bus's battery pack, which typically occurs after several years of use. |
| Resale Value | This accounts for the depreciated value of the bus at the end of lifespan, influenced by factors such as battery health and technology advancements. |
Selection of various parameters for fleet electrification planning
Selection of EV-battery type for proposed study
Fleet electrification planning includes analyzing vehicle usage patterns, assessing charging infrastructure needs, considering total cost of ownership, and evaluating the availability of incentives and subsidies.
Selection of EV-bus type for proposed study
Tata motors new design has changed the electric transportation framework and vows to serve travelers with facilities, security, and solace and most important economic compared to others. For the study, the TATA ULTRA 9m low-floor model electric buses are considered equipped with a 320-kWh battery capacity. These electric buses cost 82 lakhs, inclusive of subsidies (including the battery cost). The buses have a service life of 10 years, and their salvage value is estimated at 10% of the capital cost, which amounts to 6 lakhs. The battery is expected to be replaced every 10 years.
Table 6: Bus description &and cost data
| Title | Description | ICE Diesel Bus (AC) | E-Bus Fixed & Big Battery (AC), with subsidy. |
| Bus size | M | 9 | 9 |
| Incremental bus cost for AC | % | 15% | 15% |
| Bus cost (without battery) | CUR | 46,00,000 | 69,00,000 |
| Fuel (or Electricity) tariff | CUR/liter (CUR/kWh) | 80.00 | 5.50 |
| Avg. km run per day | km/day | 180 | 300 |
| Operational days per year | days/year | 365 | 365 |
| Bus Fleet utilization | % | 90% | 90% |
The advanced technology behind lithium-ion batteries minimizes the need for regular maintenance. It does not exhibit a memory effect, and there is no need for scheduled cycling to extend its lifespan. Furthermore, its self-discharge rate is significantly lower than that of nickel-cadmium batteries, making it ideal for use in modern fuel gauge applications. Small batteries (190kwh) results in multiple charging and big batteries (450) are costly. So here medium capacity batteries (320kwh) are taken into consideration. The number of recharge cycles a battery can handle before its performance noticeably drop is called its cycle life. Electric bus batteries are designed for thousands of cycles to ensure long-term reliability.
Selection of EV-charger type for proposed study
Different chargers could be considered for buses charging are low power (40 – 125 kW) and faster (up to 350 kW). Low power requires more time to charge compared to a fast charger. For opportunity charging during daytime fast chargers are preferred that require less time for charging as buses have less time halt for opportunity charging. Chargers capable of charging buses at a rate of 2C were considered. These chargers can fully charge a bus in 51 minutes, with an additional 10-minute handling process.
Ultimately, the planning of the number and size of chargers for electric buses should be conducted with careful consideration to ensure the efficient operation of the fleet, adherence to schedules, and meeting the energy demands of the buses. This process involves finding a balance between cost-effectiveness, operational requirements, and long-term sustainability goals.
Assumption
[1] Battery sizes and charger capacities follow market standards and government guidelines wherever applicable and are available in the annexure. [2] The analysis assumed a 75% depth of discharge and a 95% charging efficiency.[3] It was assumed that the passengers who traveled in a week were the same. [4] It was assumed that the energy required for the route in a week was the same.
Data analysis
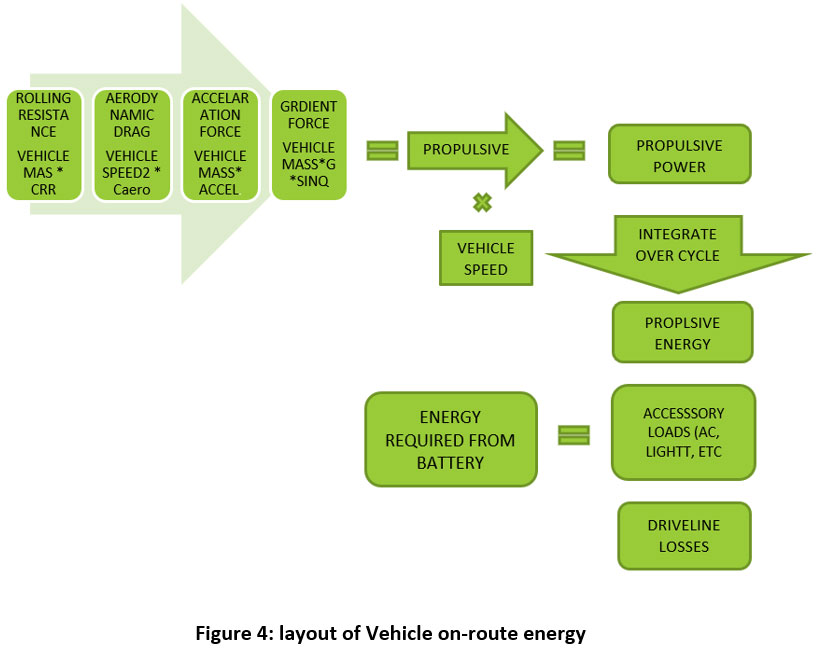
After collecting the data Vehicle-on-Route Energy is calculated for electric vehicles primary purpose of route duty-cycle data collection for electric vehicles is to gather detailed information about the energy consumption of electric vehicles on specific routes or in defined operating conditions. In this study, data collection was facilitated using the Smartphone app NMEA tool. Vehicle on-route energy layout is explained in Figure:4.
 | Figure 4: layout of Vehicle on-route energy
|
Optimization for EV Battery capacity utilization
Batteries have served as the primary energy source for electric vehicles (EVs) over an extended period. Various battery technologies have been developed and implemented for specific applications. The critical factors in battery selection revolve around achieving both high energy density and high-power density. A high specific energy is essential to ensure an extended driving range, while a high specific power contributes to improved acceleration.
Optimization for EV charger capacity utilization
Charging electric buses using conductive chargers, the two most frequently employed approaches are depot charging and opportunity charging. By comparing 1C and 2C chargers, the 2C Charger serves more charging of buses in less time. Thus, in the study, 2C was considered. Details are shown in table no.7
Table 7: E-bus energy exchange in kwh (consumption/charging).
VIH.SCH.NO-19 (FOR 2C CHARGER) | ||||||||||
Inputs | ||||||||||
| Start of Schedule | [hh:mm] | 5:45 | Initial State of Charge | [%] | 100% | |||||
| Schedule Duration | [hh:mm] | 15:40 | Depth of Discharge (assume 85% if not known) | [%] | 85% | |||||
| Reference Battery Capacity Specification | [kWh] | 324 | Reference Battery Useful Capacity | [kWh] | 275.4 | |||||
SR .NO | Acitvity | Start of Activity | Duration | Energy Exchange in kWh (+ve consumption / -ve charging) | End of Activity | |||||
Time hh:mm | SoC % | Time hh:mm | SoC % | |||||||
0 | Idle for start of schedule | 0:00 | 100.0% | 5:45 | 5:45 | 100.0% | ||||
1 | MUNDRA - BHUJ | 5:45 | 100.0% | 1:30 | 74 | 7:15 | 73.1% | |||
2 | layover | 7:15 | 73.1% | 0:20 | 0 | 7:35 | 73.1% | |||
3 | BHUJ - MUNDRA | 7:35 | 73.1% | 1:25 | 71 | 9:00 | 47.3% | |||
4 | layover | 9:00 | 47.3% | 0:20 | 0 | 9:20 | 47.3% | |||
5 | MUNDRA - BHUJ | 9:20 | 47.3% | 1:25 | 71 | 10:45 | 21.6% | |||
6 | layover | 10:45 | 21.6% | 0:30 | -180 | 11:15 | 86.9% | |||
7 | BHUJ - MUNDRA | 11:15 | 86.9% | 1:25 | 71 | 12:40 | 61.1% | |||
8 | layover | 12:40 | 61.1% | 0:35 | 0 | 13:15 | 61.1% | |||
9 | MUNDRA - BHUJ | 13:15 | 61.1% | 1:25 | 71 | 14:40 | 35.4% | |||
10 | layover | 14:40 | 35.4% | 0:35 | -180 | 15:15 | 100.0% | |||
11 | BHUJ - MUNDRA | 15:15 | 100.0% | 1:25 | 71 | 16:40 | 74.2% | |||
12 | layover | 16:40 | 74.2% | 1:20 | 0 | 18:00 | 74.2% | |||
13 | MUNDRA - BHUJ | 18:00 | 74.2% | 1:25 | 71 | 19:25 | 48.4% | |||
14 | layover | 19:25 | 48.4% | 0:35 | 0 | 20:00 | 48.4% | |||
15 | BHUJ - MUNDRA | 20:00 | 48.4% | 1:25 | 71 | 21:25 | 22.7% | |||
16 | Idle for REST of schedule | 21:25 | 22.7% | 0:00 | -324 | 21:25 | 100.0% | |||
Optimization for Total cost of ownership
TCO analysis enables transit agencies and organizations to make decisions regarding the economic viability of transitioning to electric buses and the potential for long-term cost savings when compared to traditional ICE buses.
.jpg) | Figure 5: Factors affecting TCO.
|
It considers not only the upfront purchase price but also the ongoing operational and maintenance costs, fuel savings, incentives, and other factors influencing the overall financial impact of electric buses on an organization's budget. The TCO difference between ICE diesel-operated buses and EVs is briefed in the below sheet.
Table 8: 9m E-bus Total cost of ownership scenario Annual Capital cost for ICE Diesel Bus and EV Bus was carried out; Bus Capitalization Cost, Battery Capitalization Cost, Charging Infra Capitalization Cost, and Annual Operation Cost were considered.
Currency = CUR | INR | Indian Rupee | ||
Conversion rate (1 CUR = x INR) | 1 | INR/CUR | ||
Scenario No. | Scenario-A | Scenario-2A | Scenario-3A | |
Scenario Name | ICE Diesel Bus (Non-AC) | e-Bus Fixed & Big Battery (Non-AC), with subsidy | e-Bus Fixed & Small Battery (AC), with subsidy | |
Bus size | m | 9 | 9 | 9 |
Bus cost (without battery) | CUR | 4,000,000 | 6,000,000 | 6,000,000 |
Fuel (or Electricity) tariff | CUR/litre (CUR/kWh) | 80.00 | 5.50 | 5.50 |
Battery size | kWh | 320 | 180 | |
Battery cost (after subsidy) | CUR | 2,200,125 | 450,090 | |
Bus cost (with battery and subsidy) | CUR | 8,200,125 | 7,350,090 | |
Battery DOD | % | 80% | 80% | |
Battery useful Life cycles | # | 3,500 | 3,500 | |
Charger’s cost | CUR | 1,200,000 | 600,000 | |
Manpower cost (Driver + Conductor) | CUR/km | 15.00 | 15.00 | 15.00 |
Bus AMC cost (Manpower + Materials) | CUR/km | 8.00 | 6.00 | 6.00 |
Bus Insurance cost | % | 2% | 2% | 2% |
Bus Capitalization Cost | CUR/year | 650,982 | 976,472 | 1,122,943 |
Battery Capitalization Cost | CUR/year | 365,614 | 104,278 | |
Charging Infra Capitalization Cost | CUR/year | 203,198 | 127,361 | |
Opex Cost Annualised | CUR/year | |||
Fuel Cost | CUR/year | 1,576,800 | 423,503 | 388,211 |
Manpower cost (Driver + Conductor) | CUR/year | 886,950 | 886,950 | 886,950 |
Total Cost | CUR/year | 3,587,772 | 3,210,518 | 2,984,522 |
Table 9: Total cost of ownership comparison between ICE Diesel Bus& EV Bus
| Capital Cost Annualized | ICE Diesel Bus | EV Bus |
| Bus Capitalization Cost | 7,48,629 | 11,22,943 |
| Battery Capitalization Cost | NA | 7,14,147 |
| Charging Infra Capitalization Cost | NA | 2,34,459 |
| Operation Cost Annualized | ||
| Fuel Cost | 21,50,182 | 10,58,757 |
| Manpower cost (Driver + Conductor) | 8,86,950 | 14,78,250 |
| Bus AMC Cost (Manpower + Materials) | 4,73,040 | 5,91,300 |
| Vehicle Insurance | 92,000 | 1,38,450 |
| Total Cost | 42,58,801 | 51,99,857 |
| TCO (with salvage included) | 72.80 Rs/km | s/km |
Result and Discussion
Fleet electrification involves careful planning and implementation to balance technological, operational, and strategic factors. Evaluating an organization's needs, budget, and operating environment is crucial to determine the feasibility and potential benefits of transitioning to EVs. Successful fleet electrification can lead to significant cost savings, environmental benefits, and an enhanced brand reputation. This shift towards electric vehicles (EVs) within a fleet aims to reduce carbon emissions, improve energy efficiency, and align with sustainable transportation goals.
A TCO was calculated for the project to assess the optimum Fleet Electrification possibilities for existing diesel-operated public transit bus services in the Kutch region. Detailed models were utilized to calculate the energy requirements of all 103 trips operated by the 18 buses stationed at the Mundra depot. Prioritizing the most energy-efficient routes led to the identification of five buses with the potential for electrification. A comparison of Ownership (TCO) Analysis: To make an informed decision, a comprehensive comparison of annual costs between diesel and electric buses was conducted. This analysis included:
Bus Acquisition Costs
The capital expense of purchasing new electric buses was weighed against the cost of diesel buses.
Battery Costs
As electric vehicles, battery costs were factored into the analysis, considering both initial price and potential degradation over time.
Charging Infrastructure
The initial investment and ongoing maintenance costs of the chosen charging stations were incorporated.
Operational Costs
The annual fuel expenses for diesel buses were compared with the electricity costs for charging electric buses. This also considered potential differences in maintenance costs between the two technologies.
By carefully considering these key aspects, informed decisions can be made regarding the electrification of bus fleets, balancing environmental benefits with economic feasibility. The results are plotted in the graph below.
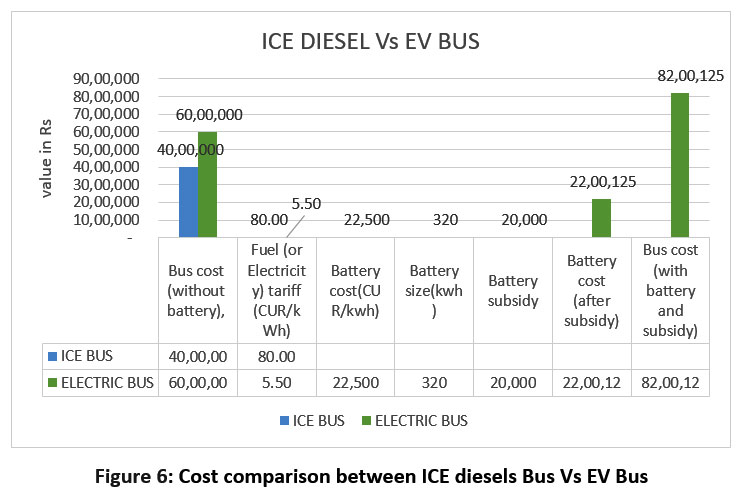 | Figure 6: Cost comparison between ICE diesels Bus Vs EV Bus
|
By comparing ICE Diesel buses with EV-bus, the life cycle cost analysis for an EV bus is 49.64 Rs/km, while that of a diesel bus is 72.80 Rs/km.
Potential benefits of e-buses include.
Environmental benefits: E-buses generate significantly lower greenhouse gas emissions and air pollution compared to gas-powered vehicles, contributing to cleaner air and mitigating climate change.
Economic benefits: Operating costs can be lower due to cheaper fuel and less maintenance required for e-buses. Government incentives and rebates can further ease the transition.
Operational benefits: E-buses offer improved efficiency, smoother acceleration, and quieter operation compared to their gas-powered counterparts. Additionally, vehicle-to-grid (V2G) technology presents potential revenue streams by selling stored energy back to the grid during peak demand.
Public perception: E-buses can enhance a brand's image by demonstrating commitment to sustainability and environmental responsibility, increasing public goodwill and customer loyalty.
Conclusion
In the universe humanity has disrupted nature for its own benefit, resulting in an imbalance within the ecosystem with the degradation of Earth's sustainability. The application of renewable energy sources is seen as a solution to mitigate these problems. EV Buses has not only maintained its position in the market as a leader by setting technology standards but has also efficiently adapted innovations to suit the unique travel conditions in India by focusing on passenger comfort and safety, these buses are equipped with modern features and state-of-the-art technology to enhance their visual appeal. Energy modeling for electric buses entails simulating and analyzing the energy consumption that includes Charging Infrastructure, Operational Efficiency, and Cost Analysis. The results of the study of all 103 trips operated by the 18 buses stationed at the Mundra depot demonstrate that eco-friendly vehicles (EVs) are significant cost-effective relative to traditional internal combustion engine (ICE) diesel buses. The overall cost for an EV bus is 49.64 Rs/km, while that of a diesel bus is 72.80 Rs/km.
Acknowledgment
I embrace the opportunity to express my deep sense of gratitude to my supervisor Dr Nipa A. Desai, Professor, Neotech Institute of Technological University, Baroda, India for his constant guidance, valuable suggestions and kind encouragement during my association. His Encouragement, constant support, intellectual stimulation, perceptive guidance, immensely valuable ideas, and suggestions from the initial to the final level enabled me to develop an understanding of the subject.
The work presented in this research paper would not have been possible without my close association with many people who were always there when I needed them the most. I take this opportunity to acknowledge them and extend my sincere gratitude for helping me make this research paper a possibility.
Funding Sources
The author(s) received no financial support for the research, authorship, and/or publication of this article.
Conflict of interest
The author(s) declares no conflict of interest.
Authors’ Contribution
Author 1 contribution to this research was substantial, encompassing the conception of the original idea into writing manuscript, design of the methodology, data collection, and analysis. This comprehensive involvement played a critical role in significant intellectual and practical involvement in the entire research project.
Author 2 significantly enhances the collaborative writing environment by not only overseeing the writing process but actively engaging in it by offering insightful critiques and proposing revisions to their peers' work. This dynamic involvement results in a meticulous refinement of the manuscript, ensuring both clarity and accuracy are achieved at every stage of development.
Data Availability Statement
The primary source of data collection revolved around government authorities, harnessing comprehensive statistics to inform the study. Supplementing this, partial surveys were conducted, offering valuable additional perspectives on public perceptions, thereby enriching the overall understanding of the subject matter.
References
- Electric Buses in India: Technology, Policy and Benefits.
- E-Mobilizing India: Accelerating Sustainable Electric Mobility in Indian cities.ELECTRIC BUSES IN INDIA.; 2022.
- Promoting Clean Energy Usage Through Accelerated Localization of E-Mobility Value Chain. 2022.
- Kraja?i?, G., Dui?, N., Zmijarevi?, Z., Mathiesen, B.V., Vu?ini?, A.A. and da Graça Carvalho, M., 2011. Planning for a 100% independent energy system based on smart energy storage for integration of renewables and CO2 emissions reduction. Applied thermal engineering, 31(13), pp.2073-2083.
CrossRef - Blanford, G.J., Rose, S.K. and Tavoni, M., 2012. Baseline projections of energy and emissions in Asia. Energy Economics, 34, pp. S284-S292
CrossRef - Steckel JC, Brecha RJ, Jakob M, Strefler J, Luderer G. Development without energy? Assessing future scenarios of energy consumption in developing countries. Ecological Economics. 2013; 90:53-67.
CrossRef - Gracceva F, Zeniewski P. A systemic approach to assessing energy security in a low-carbon EU energy system. Appl Energy. 2014;123.
CrossRef - Ji J, Bie Y, Zeng Z, Wang L. Trip energy consumption estimation for electric buses. Communications in Transportation Research. 2022; 2:100069.
CrossRef - Mehar S, Senouci SM, Remy G. EV-planning: Electric vehicle itinerary planning. In: 2013 International Conference on Smart Communications in Network Technologies (saconet). IEEE; 2013:1-5.
CrossRef - Hecht C, Victor K, Zurmühlen S, Sauer DU. Electric vehicle route planning using real-world charging infrastructure in Germany. E-Transportation. 2021; 10:100143.
CrossRef - Zhang Y, Ma Q, Zhang X, et al. Integrated Route and Charging Planning for Electric Vehicles Considering Nonlinear Charging Functions. In: Proceedings of the 2018 IEEE 22nd International Conference on Computer Supported Cooperative Work in Design, CSCWD 2018. Institute of Electrical and Electronics Engineers Inc.; 2018:207-212.
CrossRef - Zhou W, Wang L. The Energy-Efficient Dynamic Route Planning for Electric Vehicles. J Adv Transp. 2019; 2019:1-16.
CrossRef - Perger T, Auer H. Energy efficient route planning for electric vehicles with special considerationof the topography and battery lifetime. Energy Efficient. 2020;13(8):1705-1726.
CrossRef - Khandekar A, Rajagopal D, Abhyankar N, Deorah S, Phadke A, Berkeley L. The Case for All New City Buses in India to Be Electric Energy Technologies Area.; 2018.
CrossRef - Deb S, Tammi K, Kalita K, Mahanta P. Charging Station Placement for Electric Vehicles: A Case Study of Guwahati City, India. IEEE Access. 2019; 7:100270-100282.
CrossRef - Tripta thakur, Tushar Kumar. Chapter 37 Electric vehicle infrastructure planning for Indian distribution sector. Springer science and business media LLC. 2022
CrossRef - Yu, M., Bai, B., Xiong, S., & Liao, X. (2021). Evaluating environmental impacts and economic performance of remanufacturing electric vehicle lithium-ion batteries. Journal of Cleaner Production, 321, 128935
CrossRef - Mrozik, W., Rajaeifar, M. A., Heidrich, O., & Christensen, P. (2021). Environmental impacts, pollution sources and pathways of spent lithium-ion batteries. Energy & Environmental Science, 14(12), 6099-6121.
CrossRef - Xiong, S., Ji, J., & Ma, X. (2020). Environmental and economic evaluation of remanufacturing lithium-ion batteries from electric vehicles. Waste Management, 102, 579-586.doi:10.1016/j.wasman.2019.11.013
CrossRef - Driving affordable financing for electric vehicles in india. 2022.
- Mastoi MS, Zhuang S, Munir HM, et al. An in-depth analysis of electric vehicle charging station infrastructure, policy implications, and future trends. Energy Reports. 2022;8:11504-11529. Doi:10.1016/j.egyr.2022.09.011
CrossRef - Mastoi MS, Zhuang S, Munir HM, et al. An in-depth analysis of electric vehicle charging station infrastructure, policy implications, and future trends. Energy Reports. 2022;8:11504-11529. Doi:10.1016/j.egyr.2022.09.011
CrossRef - Gujarat RE Policy-2023, 4.10.23.
CrossRef - Tyagi B, Sasidharan C, Das S. A Case Study on Potential Impact of ElectricVehicle Charging for an Electricity Distribution Utility in India.
- Napoli G, Micari S, Dispenza G, Andaloro L, Antonucci V, Polimeni A. Freight distribution with electric vehicles: A case study in Sicily. RES, infrastructures and vehicle routing. Transportation Engineering. 2021;3:100047. Doi:10.1016/J.TRENG.2021.100047
CrossRef - Mersch M, Markides CN, Mac Dowell N. The impact of the energy crisis on the UK’s net-zero transitions. Science. 2023;26(4). doi:10.1016/j.isci.2023.106491
CrossRef - Weinand JM, Hoffmann M, Göpfert J, et al. Global locusof decentralized off-grid renewable energy systems. Renewable and Sustainable Energy Reviews. 2023;183:113478. doi:10.1016/j.rser.2023.113478
CrossRef - Connolly D, Lund H, Mathiesen B V., Leahy M. The first step towards a 100% renewable energy-system for Ireland. Appl Energy. 2011;88(2):502-507. Doi:10.1016/j.apenergy.2010.03.006
CrossRef - Mathiesen BV, Lund H, Karlsson K. 100% Renewable energy systems, climate mitigation and economic growth. Appl Energy. 2011;88(2):488-501. doi:10.1016/j.apenergy.2010.03.001
CrossRef - Singh N, Mishra T, Banerjee R. Emission’s inventory for road transport in India in 2020: Framework and post facto policy impact assessment. Published online 2021. doi:10.21203/rs.3.rs-297185/v1
CrossRef - Sheth A, Sarkar D. Social Benefit Cost Analysis of Electric Bus Transit for Ahmadabad. Transportation in Developing Economies. 2021;7(1). Doi:10.1007/s40890-021-00116-5
CrossRef


