Impact of Surface Dew Point Temperature, Precipitable Water and the Lifted Index on the Precipitation over Hyderabad (India).
Mohammad Taiyab
 , Rizwan ul Haq Ansari
*
, Md Khaleelur Rahiman
and Hakeem Aleem Basha
, Rizwan ul Haq Ansari
*
, Md Khaleelur Rahiman
and Hakeem Aleem Basha
1
Physics section, School of Sciences,
Maulana Azad National Urdu University,
Hyderabad,
Telangana
India
Copy the following to cite this article:
Taiyab M, Ansari R. H, Rahiman M. K, Basha H. A. Impact of Surface Dew Point Temperature, Precipitable Water and the Lifted Index on the Precipitation over Hyderabad (India). Curr World Environ 2024;19(1).
Copy the following to cite this URL:
Taiyab M, Ansari R. H, Rahiman M. K, Basha H. A. Impact of Surface Dew Point Temperature, Precipitable Water and the Lifted Index on the Precipitation over Hyderabad (India). Curr World Environ 2024;19(1).
Citation Manager Publish History

Introduction
Precipitation affects the Earth’s ecosystem. Precipitation is water in liquid form in the atmosphere and falls on to the earth. Precipitation also depends on temperature. Precipitation provides water required to all plants, animals and humans. Precipitation patterns (such as rain and snowfall) are also changing in many parts of the world. This may affect the availability of water for plants and animals and may lead to drought or floods in some areas. Rising temperatures, changing precipitation patterns and more frequent extreme weather events can lead to shifts in habitats, disruptions to food webs and changes in the distribution and behaviour of plant and animal species. The rains occurring during the monsoon are essential for agriculture as it provides the majority of the yearly rainfall for crops but can also cause flooding and disruptions to daily life. Rains fills lakes, rivers and restores underground aquifers. The global average annual precipitation is approximately 100 cm (39 inches) however its distribution is highly variable. The spatial distribution of precipitation across the globe is varied by latitude, topography, water bodies, and wind patterns. Temperature and humidity are two important factors for rainfall. In the polar regions, the amount of rainfall is less but snowfall is more. The highest precipitation areas are found in Southeast Asia’s monsoon and equatorial regions. The precipitation is moderate at the middle latitudes, whereas very low amount of precipitation occurs around poles and over subtropical desert regions1. Some of the meteorological parameters that affect and are affected by precipitation are dew point temperature (Td), precipitable water (PW) and lifted index (LI). In the atmospheric air the water in gas phase changes to liquid when the temperature of air reaches to dew point. While calculating LI, the dew point is taken into consideration. PW is the water in the column of the atmosphere which varies with evapotranspiration in the atmosphere and temperature of air. All the four parameters are mutually related to each other.Understanding the correlation between these parameters (Td, PW, LI and precipitation) is essential and may be useful for climate research, water resource management and planning for the impacts of climate change. Furthermore, looking at the statistical relationships between these parameters can help in detecting possible trends and changes in these variables, which can have implications for various fields, including agriculture and public health.
The purpose of this study is also to investigate the relationship between these parameters with precipitation during monsoon seasons. Based on the correlations between these parameters, we show that they can be key predictors of the monsoon over the station Hyderabad. For example, a negative correlation between PW and LI implies heavy rainfall. i.e. the more the negative values of LI indicate more rainfall. The thermodynamic state of the atmosphere can be described using LI and PW, also they can be used to describe pre-convective state of the atmosphere.2 Thus, the correlations studied in this present work provide us a way to gain insight into the moisture condition in the atmosphere.
First, we will review some important studies based on the Td, PW, and LI relationships and discuss their implications on precipitation, atmospheric stability and convective activity in the atmosphere. We then discuss data and methodology used. Results, conclusions and the future directions of work are presented in the last section.
Summary of Previous Research Findings
Many studies have dealt with PW, Td and LI owing to their significance in predicting weather conditions. These studies have helped us in understanding the behaviour of atmospheric activities and we have presented here some of the important works to highlight the significance of atmospheric events or weather forecasting.
Reitan (1963) observed the relationship between the logarithm of precipitable water ln (PW) and the surface dew point temperature (Td). He analyzed 3 years of monthly mean data from 15 different meteorological stations over the United States. The study found a strong correlation coefficient of 0.98, indicating a significant association between the variables. Furthermore, the standard error of the precipitable water from regression was determined to be 1.8 mm indicating the accuracy of the regression model in predicting the relationship between precipitable water and dew point temperature.3
Bolsenga (1965) investigated total water vapor in the atmosphere vs surface dew point for hourly and daily mean data. He found the similar results as Reitan predicted i.e., daily mean, hourly water vapor and dew point follow the same basic relationship as monthly mean values but with lower correlation coefficients. The correlation coefficient is 0.80 and 0.85 for hourly and daily mean data of dew points and water vapor. The standard errors vary as monthly mean < daily mean < hourly.4
Smith expressed the relation between precipitable water and dew point temperature which is similar to Reitan’s relation between the same two parameters. Smith (1966) also elucidates that the coefficient in the relation is not a constant but varies according to the moisture in a vertical column of the atmosphere. He also pointed out that varies with seasons and latitudes. So, he expressed that when relating PW and Td, the value of should be taken into account.5
Lowry and Glahn (1969) gave a relation for ln PW and Td after regressing radiosonde data over 56 stations in the eastern and central United States and southern Canada. They have estimated the standard error as 0.304 for the first relation and 0.280 for the second relation and concluded that there is a decrease in variance in ln PW when the other two parameters viz., sky cover and weather are also included. They have observed the geographical patterns in the decrease in variance, showing a low reduction of variance in the eastern seaboard and a higher reduction of variance over the eastern United States.6
Reber and Swope (1972) studied the relationship between PW and surface absolute humidity for 1,500 upper-level soundings. They have noted a large range (-0.29 to 0.83) in correlation coefficients. They have concluded that estimating PW from surface absolute humidity is not valid.7
Tuller mentioned that McGee, O. S.8 discovered a significant relationship between the monthly mean surface dew point and precipitable water vapor in the atmosphere at seven different weather stations in South Africa in a study. It turned out that after analyzing two years of data there were remarkably strong correlation coefficients between these variables. The correlation coefficient at Durban was 0.97, while it was 0.98 at Pretoria.8
Tuller scrutinized the interaction between precipitable water vapor and 3 other humidity parameters viz., mixing ratio (r), water vapor pressure (e), and dew point temperature for the year 1974 at four meteorological stations over New Zealand. it is classified into four seasons viz., Winter (June-August), autumn (March-May), spring (September-November), and summer (December-February). He applied regression analysis for PW individually with r, e, and Td and noted the positive correlation coefficients for all seasons and all regions are significant at the 0.05 level and the annual correlation coefficient ranges (from 0.81 to 0.88 for ln PW vs Td), (from 0.79 to 0.86 for PW vs r), (from 0.78 to 0.86 for PW vs e).9
Karalis compared the precipitable water with square root of surface vapor pressure and surface dew point in Athens. In this work he examined monthly mean radio soundings at 0000 and 1200 GMT from 1957 to 1971. Correlation coefficients and linear regression equations were used. Monthly correlation coefficients value ranged between -0.36 to 0.98, while seasonal values ranged (0.39 to 0.97). Late spring and summer had lower correlation coefficients than winter. 1200 GMT correlation coefficients were higher than 0000 GMT.10
Sinha Subroto and Sinha Sushanta K11 applied regression analysis to ln PW vs Td over the Indian subcontinent for the years 1967 and 1972. The relation is similar to the relation given by Reitan. The relation is ln (PW) = a + b * Td, where a, b are constants. They have observed that the two parameters show a good correlation at 850 mb during the monsoon season (June to September) with low standard error in the regressed line. They also noticed that the constant “a” depends on the geographic location of the meteorological station.11
Viswanadham Y applied regression analysis for the relation, given by Reitan3 relating PW and Td from the surface to 500 mb and from the equator to 85 °S. He achieved the correlation coefficients having a range from 0.21 (January) to 0.99 (October). He also noted the value is lower for lower latitudes (0 to 20 °S) and expressed the reason for the variability of moisture. It is observed that the two parameters have good relation with a higher correlation during winter. For the zonal average of precipitable water at higher latitudes, it is noted that the dew point temperature is in good relation with PW.12
The relation between precipitable water and surface relative humidity, Raj et al.13 used sun photometer to collect data of precipitable water for 41 months from May 1998 to September 2001 over the station Pune, India. In his study, he revealed two types of diurnal variation in the precipitable water one during winter and the other during summer. They also observed that the time series of the precipitable water profile follows closely with the surface relative humidity and found a positive correlation coefficient (0.60) between them. They also revealed that there is a possible influence of surface relative humidity on the precipitable water.13
Sharma et al.14 used average relative humidity (ARH), (LI), (TPW), and average refractivity (RI) obtained from radio occultation (RO) data to analyze the occurrence and intensity of rainfall. For the data duration May to August in the year 2007 over India and surrounding regions. They found that a combination of the LI, TPW, and ARH derived from RO data can predict the likelihood of rainfall by 90%. Additionally, the study found that average refractivity (RI), which is a measure of atmospheric instability, can be used along with TPW and ARH to predict the occurrence and intensity of rainfall. They have noted that RI can be used in place of LI to find rainfall probability and intensity. Rain events correlate with high TPW, ARH, RI, and negative LI values. RI can be used as a measure of atmospheric stability instead of LI and RO data is useful for predicting rainfall.14
As is evident from the above discussion, there are extensive studies involving various parameters like LI, PW, Vapor pressure, Relative humidity, Td etc. for different geographical locations across the earth. People have employed a variety of methods and techniques to study them, and all show that they are strongly related to each other and play a vital role in the dynamics and prediction of weather conditions. This motivates us to further investigate the connection between these parameters. We analyze the correlation between atmospheric instability and moisture parameters in the atmosphere using LI and PW, Td on the impact of precipitation. We analyze LI and PW, LI and precipitation correlation using monthly mean data which has not been studied. In the next section, we will discuss the technical details of Td, PW, and LI used to calculate these parameters and data analysis.
Data and Methodology
Atmospheric data of Td, PW, and LI for the period January 2010 to December 2019 over Hyderabad at 00:00 Z is obtained from Wyoming Weather Web.15 The long-term variation of atmospheric instabilities has been studied using atmospheric sounding data of the above parameters. Typically, radiosonde observations are done two times in a day, around 00:00 and 12:00 Z (05:30 and 17:30 IST) respectively. The complete details about the instrumentation or methods, quality and reliability of the obtained data were provided in the WMO documents by the U. S. Federal Meteorological Data Management Handbook.16 Using these atmospheric data, we have calculated monthly mean values of surface Td (in Celsius degrees oC), PW (in millimeters mm) and LI (in Celsius degrees oC). Linear interpolation was used to find missing data for Td, PW, and LI. For the same period January 2010 to December 2019, we obtained average precipitation data from the NASA Data Access Viewer17.
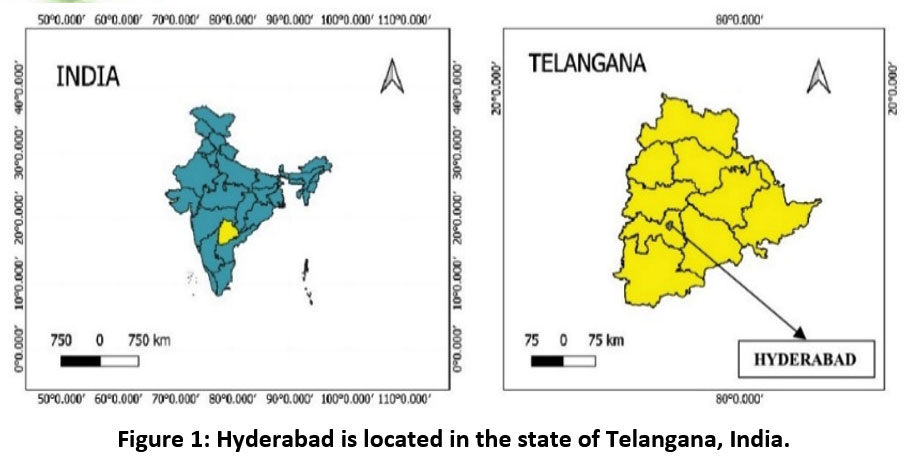
The Location of the present study is Hyderabad, an urban district in the state of Telangana, India, which has an area of about 217 square kilometers and an altitude of 536 meters. This district had a population of 3,943,323 according to the 2011 census. Hyderabad climate is Tropical Wet and Dry. In summer the maximum temperature is 40 oC and minimum 22 oC while in winter the maximum temperature is 22 oC and minimum 13.8 oC.18 The geographical location of Hyderabad is shown in Figure 1. The location map of the study area has been created using QGIS.
 | Figure 1: Hyderabad is located in the state of Telangana, India.
|
A brief description of these parameters (Td, PW and LI) is given below
The amount of moisture in the air is commonly referred to as dew point. To get saturated, air has to cool down to a particular temperature which is its dew point. The lower the dew point, the lower the amount of water vapor or moisture in the air. The increase in moisture or water vapor in the air is indicated by the increase in the dew point. The dew point measures how much moisture is actually in the air.
The PW is defined as the depth of water that would be obtained when all the water vapor in a column of air was condensed from the surface to the top of the atmosphere. It shows atmospheric moisture availability, which is essential for understanding cloud formation, precipitation potential and weather patterns. It can be calculated using the mixing ratio of water vapor at different pressure levels within a specified layer. In mathematical terms, when considering the mixing ratio (x) at a given pressure level (p), the amount of precipitable water vapor within a layer confined by pressures p1 and p2 can be determined.19
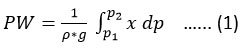
In Equation (1), the variable P represents the density of water and g stands for the acceleration due to gravity.
The LI is a useful indicator to predict latent instability of the atmosphere and was developed to predict severe storms and to elicit light on the behaviour and few processes occurring in the atmosphere.20 It is a measure of the stability of the atmosphere between the surface and 500 hPa in which a surface air parcel is lifted dry adiabatically to the lifting condensation level (LCL) and then lifted to 500 hPa with saturated adiabatic. The LI value is calculated as follows,
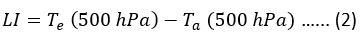
Where Te = environmental temperature at 500 hPa and Ta = air parcel temperature which is lifted to 500 hPa from the Earth’s surface.
LI values range from LI = 0 oC (stable atmosphere) to LI < -6 oC (severe storms are likely to occur).21
The method and data taken to evaluate the relevant parameters for our study is as follows. The degree of relationship or correlation coefficient between four pairs of parameters (Td and PW), (LI and PW), (PW and precipitation) and (LI and precipitation) was examined and also correlated for the average of monthly mean data for ten years (2010 to 2019) and also for monthly mean time series data.
The methods of interpolation, correlation and regression used in the analysis are briefly described below.
Interpolation
Interpolation is a mathematical approach to estimating the values of a function for any intermediate value from a given set of data points. The most practical interpolating function is the polynomial one.
Polynomial of degree n, y = Co + C1x + C2 x2 + …. + Cn xn
Vanishes for n and only n values of x are counted according to the order of multiplicity.
The iterated polynomial is linear compound formula for interpolation in equal intervals using a composite interpolation curve comprising of spliced polynomial arcs and has first derivative that is continuous, which is written as
Where, 1 > x > 0,
z denotes (1-x),
here represents the difference taken centrally,
the finite difference operators are given by Ao and B1 which are of the form
P represents a linear compound of "y's" having polynomials as coefficients in x.22
Correlation and Correlation coefficients
Correlation is a statistical technique used to determine the degree to which two variables are related. The correlation may be positive or negative. In positive correlation, there is a linear relationship between two variables i.e. both variables increase or decrease in the same direction. Whereas, in negative correlation there is an inverse relationship between two variables.
Correlation coefficient (r): It measures how strong is the linear relationship between two variables. The ‘r’ values range from -1 to +1. If r < 0, it implies that there is a negative correlation between the variables and -1 indicating strongest point of negative correlation. If r > 0 it implies there is a positive correlation and +1 is the strongest point of a positive correlation. When r = 0 we can say that there is no correlation between the variables.23
Regression
The method of prediction of the unknown values of a given variable from a known values of other variables, by studying the degree of the relationship between the variables is known as regression. Possible values of the dependent variable are estimated on basis of the values of the independent variables. A regression line is a line that is fitted to a set of data points to estimate the relationship between two variables. For example, if the regression equation is of y on x is then it shows how the value of y changes with the value of x.
y = bx + a,
where y denotes the dependent variable, independent variables is denoted by x, a represents the intercept and slope is given by b.
The methodology is represented by a Flow chart as shown in Figure 2.
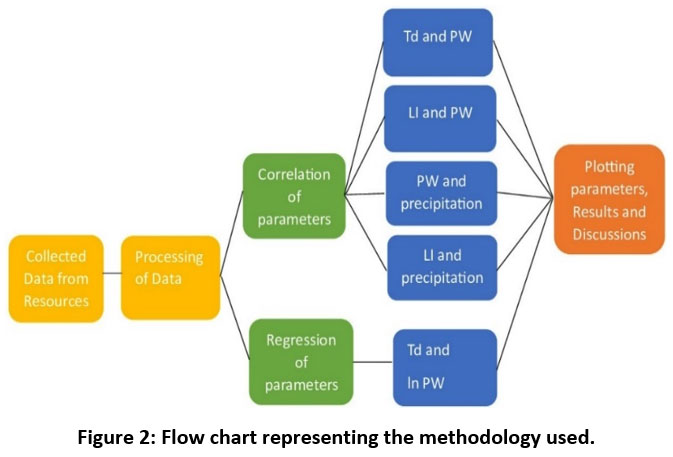 | Figure 2: Flow chart representing the methodology used.
|
Results and Discussion
Monthly mean time series of Precipitation, PW, Td and LI
The monthly mean time series of four parameters Precipitation (a), PW (b), Td (c) and LI (d) are illustrated in Figure 3. It is noticed that the four parameters show annual variation. The first three parameters are in phase whereas the LI is in the opposite phase. Figure 3 manifests the presence of a linear relation between the four parameters. We have observed a linear relation between the first three parameters which are explained in the following sections.
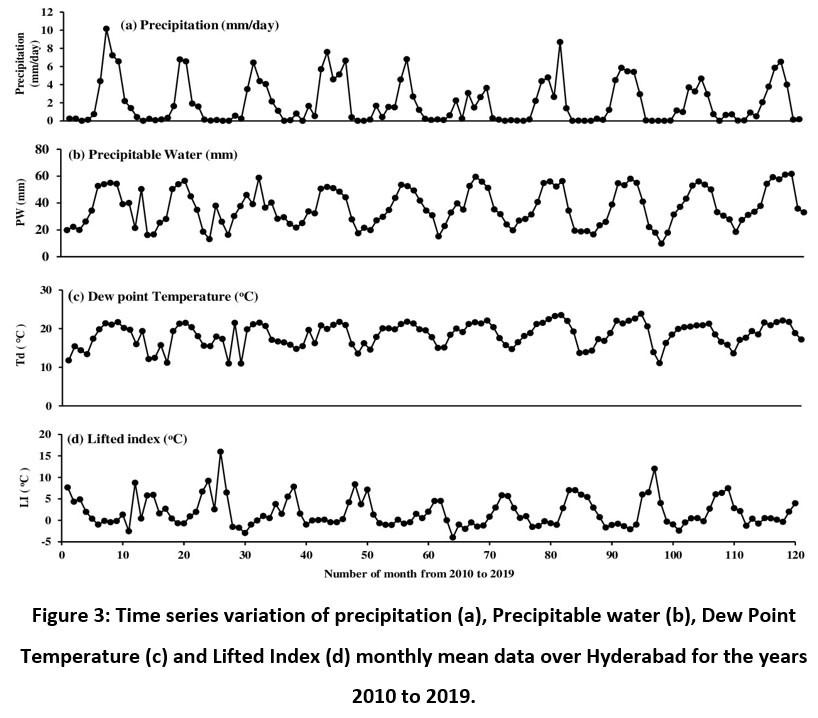 | Figure 3: Time series variation of precipitation (a), Precipitable water (b), Dew Point Temperature (c) and Lifted Index (d) monthly mean data over Hyderabad for the years 2010 to 2019.
|
We have calculated the time series correlation between four pairs of parameters and it is tabulated in Table 1. From the correlation values the correlation coefficient between Td and PW is positive and high indicating a linear relation between them. The other correlation coefficient values are low and may not be significant.
Table 1: Time series correlation of Td, PW, LI and Precipitation for 10 years of monthly mean data from 2010 to 2019 over Hyderabad.
Atmospheric parameters | Correlation coefficient |
Td & PW LI & PW PW & Precipitation LI & Precipitation | 0.8330 -0.7425 0.7885 -0.5144 |
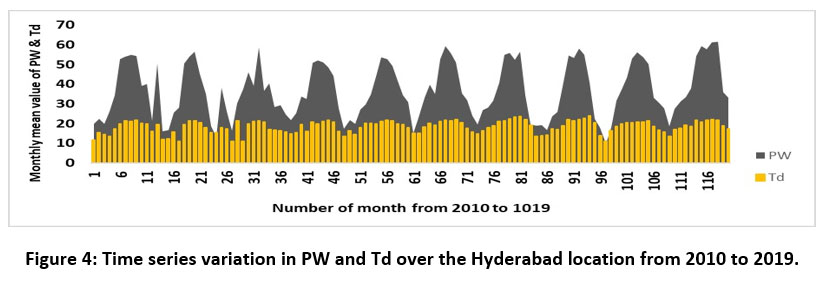
As we have found a positive and high correlation coefficient between Td and PW so we have compared these two time series parameters with bar charts as shown in Figure4. This Figure also illustrates the linear relation between these two parameters.
 | Figure 4: Time series variation in PW and Td over the Hyderabad location from 2010 to 2019.
|
Monthly mean time series of Precipitation, PW, Td, and LI and their Annual variations
Figure 5 shows the variations in monthly mean precipitation, PW, Td, and LI for 10 years for the above-mentioned duration. It is observed from Figure 5(a) that the precipitation increases from June indicating starting of the monsoon and most of the precipitation occurs from June to September in all the mentioned years. It is also observed that the maximum precipitation of 10.15 mm/day occurred in July 2010. Figure 5(b) shows the annual variation of surface Td and it is noted that the surface Td is maximum in the months similar to the months of maximum precipitation. Similarly, Figure 5(c) shows the annual variation of precipitable water (mm) and observed that it is maximum in the months when precipitation is maximum. It is noted that surface Td and PW is correlated with precipitation.
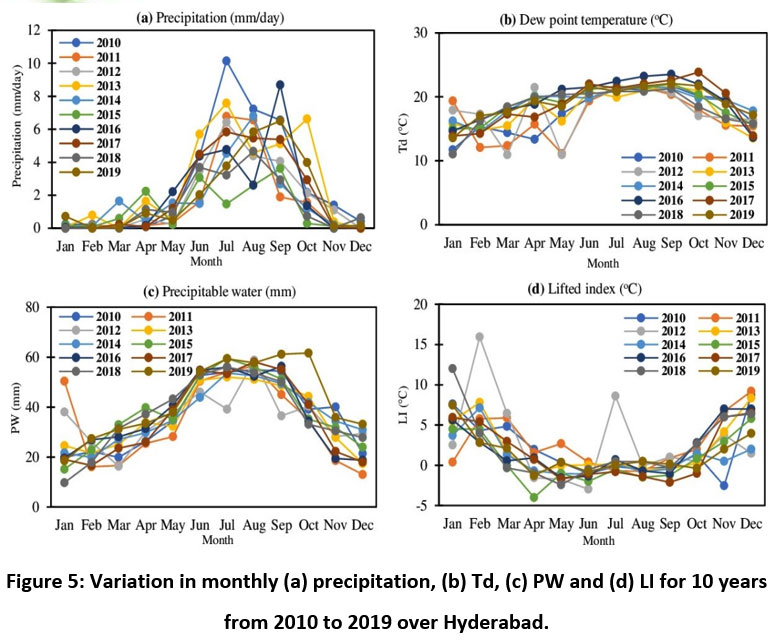 | Figure 5: Variation in monthly (a) precipitation, (b) Td, (c) PW and (d) LI for 10 years from 2010 to 2019 over Hyderabad.
|
The precipitation can be compared with LI. The monthly mean of LI for ten years is also shown in Figure 5(d). It can be observed from Figure 5(d) that the annual variation in LI indicates minimum during April, May, June, July, August, and September during which the precipitation is more. In the monsoon season (Jun to Sep) LI value is more negative compared to summer (Mar to May) and winter (Oct to Feb). Amid ten years of data, the minimum LI value of -4 (oC) is observed in April 2015.
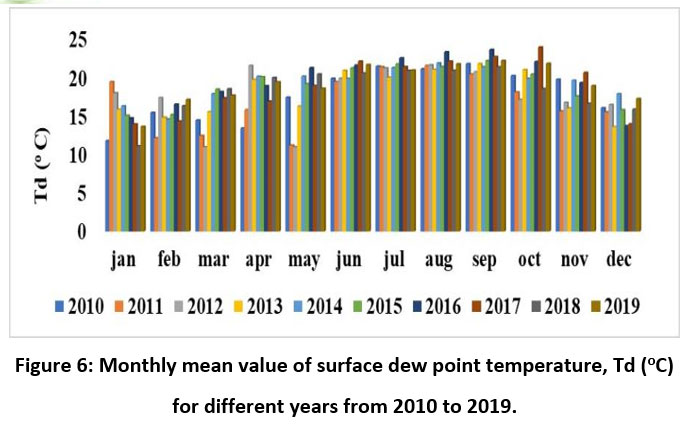
A different view in the form of bar chart for the monthly mean variation in Td and PW for the above-mentioned duration is shown in Figures 6 and 7 respectively. During 2016 the surface Td increases from June to September whereas the precipitation decreases in the month of August for the same year. From the chart of PW in Figure 7, the PW is more during June to September and it is also observed that there is similarity in the variation of PW with the variation of precipitation for the same year.
 | Figure 6: Monthly mean value of surface dew point temperature, Td (oC) for different years from 2010 to 2019.
|
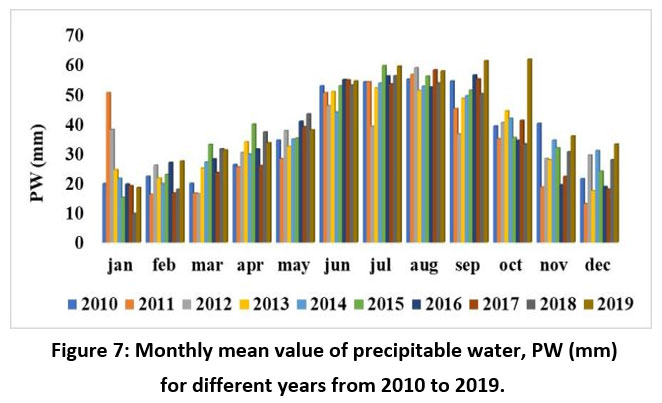 | Figure 7: Monthly mean value of precipitable water, PW (mm) for different years from 2010 to 2019.
|
We have calculated the average value for each month for ten years. The ten year average value for each month for the above mentioned four parameters is depicted in Figure 8. From Figure 8, it can be clearly observed that PW increases from June and reaches maximum value in August whereas Td also varies similarly throughout the year but remains approximately constant in the duration June to August.
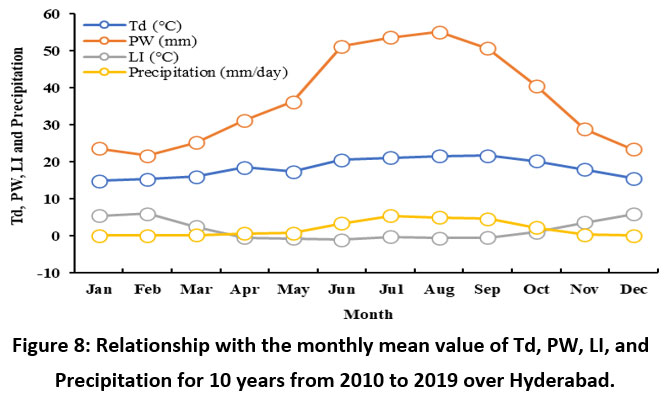 | Figure 8: Relationship with the monthly mean value of Td, PW, LI, and Precipitation for 10 years from 2010 to 2019 over Hyderabad.
|
The correlation is observed for ten years averaged for each month’s monthly mean data which are depicted in Figure 8 by taking four pairs of parameters mentioned above and their correlation coefficients were tabulated in Table 2. The correlation coefficient between Td and PW is positive and high (0.9528) indicating a linear relation between them.
Table 2: Correlation with the monthly mean value of Td, PW, LI, and Precipitation for 10 years from 2010 to 2019 over Hyderabad.
Atmospheric parameters | Correlation coefficient |
Td & PW LI & PW PW & Precipitation LI & Precipitation | 0.9528 -0.8232 0.9631 -0.6934 |
Figure 9 shows the correlation between Td and PW only, indicating linearly and positively related to each other. The correlation coefficient is 0.9528 is observed. A similar process is done for the other four pairs of parameters and their correlation coefficients were tabulated in Table 2.
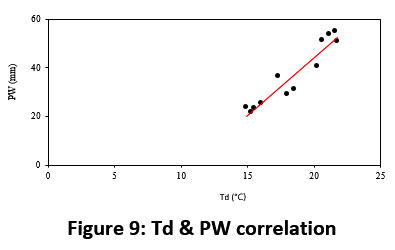 | Figure 9: Td & PW correlation.
|
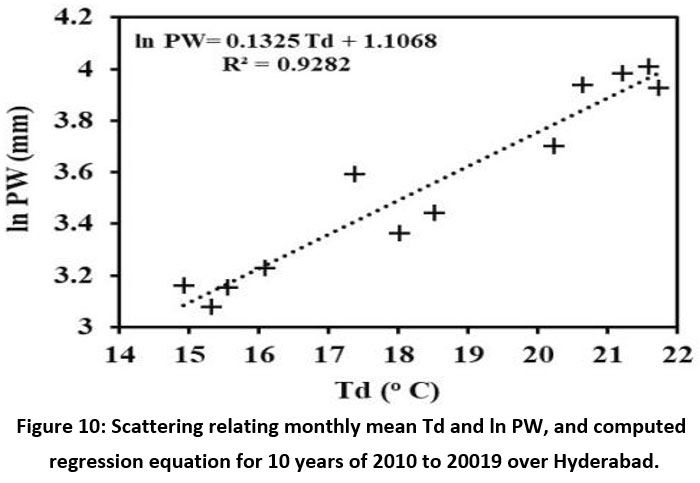
The surface Td is regressed with ln (PW). This investigation indicates a strong positive correlation between them as shown in Figure 10. The correlation coefficient and value of R-square calculated from regression statistics are 0.9634 and 0.9282. The standard error from regression was calculated and its value is 0.1001.
 | Figure 10: Scattering relating monthly mean Td and ln PW, and computed regression equation for 10 years of 2010 to 20019 over Hyderabad.
|
The regression equation that establishes a relationship between these two parameters was calculated using a simple linear regression for the above-mentioned duration. The linear equation is of the form: ln PW = slope * Td + intercept

For the given value of the surface dew point temperature, this linear regression Equation (3) can be used to calculate precipitable water. In Regression Equation (3), the value of slope is 0.1325 and the intercept is equal to -1.1068. Using Equation (3) we can compute PW over Hyderabad using given the value of surface Td. However, better equations can be obtained for specific stations. In all cases, when more accurate equations are not available, it is suggested that the regression equation can be employed as an estimator of PW from surface Td. Using average monthly data, the PW, Td relationship is seen here.
Thus, in general we see from this work that a negative correlation was found between LI and PW, LI and precipitation which is clearly seen in Figures 3, 5 and 8. During the analysis period, it can be seen from Figures 3 and 8 that maximum precipitation occurred when LI values were negative and precipitation events were more likely to occur when PW values exceeded 50 mm. A significant positive relationship was also observed between Td and PW in Hyderabad which is shown in Figures 3, 4, 5 and 8.
Conclusion
We have observed annual variation in the time series of four parameters viz precipitation, PW, Td and LI. Statistical correlation analysis is performed on the four pairs of parameters. The linear correlation is observed between ln PW and Td that advances us in arriving simple linear equation. A positive high correlation coefficient is observed between Td and PW and a negative correlation is observed between LI and PW. It is observed that maximum precipitation occurred when the LI values were negative. We found that PW and precipitation are positively correlated, but LI and precipitation are negatively correlated. The maximum precipitation was observed when the PW values were between 40 to 60 mm. In the monsoon period, June to September, during which intensity of precipitation is more, we have observed higher values for Td and PW over Hyderabad, India. The relationship between Td and PW is a key indicator of the intensity and progression of precipitation during monsoon, as higher values of both parameters indicate a more intense monsoon.
It is found that Td, PW and LI showed a substantial impact on precipitation patterns in Hyderabad, India. Higher Td and PW content were associated with an increased likelihood of precipitation, indicating the importance of moisture availability. From this study, it can be concluded that the accommodation of PW in the atmosphere can be related to the environmental temperature and dew point. These findings suggest that a comprehensive understanding of these meteorological parameters plays a vital role in predicting and analyzing precipitation in Hyderabad and can be found useful if this study extends to all the meteorological stations.
Acknowledgement
The authors are highly thankful to the Wyoming Weather Web and NASA data access viewer website for providing atmospheric and precipitation data.
Conflict of Interest
The authors have no conflict of interest regarding the publication of this manuscript.
Funding Sources
There is no funding or financial support for this research work.
Authors’ Contribution
Mr. Mohammad Taiyab contributed by conceptualised the idea, doing calculations, preparing graphs and initial draft. Dr. Rizwan ul Haq Ansari carried out the analysis of results and revising the drafts of the article. Dr. Md. Khaleelur Rahiman analysed the data, shaped the analysis, results and revision of final drafts. Prof. H Aleem Basha suggested the critical review of the manuscript and finalised the approval of the version of the manuscript to be sent to the Journal.
Data Availability Statement
Precipitation data is available via the NASA Data Access Viewer (https://power.larc.nasa.gov/data.access.viewer). Atmospheric sounding data of Td, PW, and LI have been collected from the Wyoming Weather Website. Atmospheric sounding data are available via the Wyoming Weather Web (https://weather.uwyo.edu/upperair/sounding.html).
Ethics Approval Statement
Not applicable.
References
- Howard B. Bluestein. Spatial distribution of rain across the globe. Britannica. https://www.britannica.com/science/climate-meteorology/World-distribution-of-precipitation. Accessed January 19, 2024.
- National Weather Service. Zhu training page thunderstorms. https://www.weather.gov/source/zhu/ZHU_Training_Page/thunderstorms_stuff/Thunderstorms/thunderstorms.htm. Accessed July 20, 2023.
- Reitan Clayton H. Surface dew point and water vapor aloft. J Appl Meteor (1962-1982). 1963; 2(6): 776-779. https://doi.org/10.1175/1520-0450(1963)002%3C0776:SDPAWV%3E2.0.CO;2
CrossRef - Bolsenga S. J. The relationship between total atmospheric water vapor and surface dew point on a mean daily and hourly basis. J Appl Meteor (1962-1982). 1965;4(3): 430-432. https://doi.org/10.1175/1520-0450%281965%29004%3C0430%3ATRBTAW%3E2.0.CO%3B2
CrossRef - Smith W. L. Note on the relationship between total precipitable water and surface dew point. J Appl Meteor. 1966; 5(5): 726-727. https://doi.org/10.1175/1520-0450(1966)005%3C0726:NOTRBT%3E2.0.CO;2
CrossRef - Lowry Dale A, Glahn Harry R. Relationships between integrated atmospheric moisture and surface weather. J Appl Meteor. 1969; 8(5): 762-768. https://doi.org/10.1175/1520-0450%281969%29008%3C0762%3ARBIAMA%3E2.0.CO%3B2
CrossRef - Reber E. E, Swope J. R. On the correlation of the total precipitable water in a vertical column and absolute humidity at the surface. J Appl Meteor (1962-1982). 1972; 11(8): 1322-1325. https://doi.org/10.1175/1520-0450%281972%29011%3C1322%3AOTCOTT%3E2.0.CO%3B2
CrossRef - McGee O. S. Surface dewpoint-precipitable water-vapor relationship. S Afr J Sci. 1974; 70(4): 119-120. https://journals.co.za/doi/epdf/10.10520/AJA00382353_4172
- Tuller Stanton E. The relationship between precipitable water vapor and surface humidity in New Zealand. Arch Met Geoph Biokl Ser A. 1977; 26 (2-3): 197-212. https://doi.org/10.1007/BF02247163.
CrossRef - Karalis John D. Precipitable water and its relationship to surface dew point and vapor pressure in Athens. J Appl Meteor. 1974; 13(7): 760-766. https://doi.org/10.1175/1520-0450%281974%29013%3C0760%3APWAIRT%3E2.0.CO%3B2
CrossRef - Sinha Subroto, Sinha Sushanta K. Precipitable water and dew point temperature relationship during the Indian summer monsoon. Pure Appl Geophys. 1981; 119(5): 913-921. https://doi.org/10.1007/BF00878959
CrossRef - Viswanadham Y. The relationship between total precipitable water and surface dew point. J Appl Meteorol. (1962-1982). 1981; 20(1): 3-8. https://doi.org/10.1175/1520-0450%281981%29020%3C0003%3ATRBTPW%3E2.0.CO%3B2
CrossRef - Raj P. Ernest, Devara P. C. S, Maheskumar R. S, Pandithurai G, Dani K. K, Saha S. K, Sonbawne S. M, Tiwari Y. K. Results of Sun photometer–derived precipitable water content over a tropical Indian station. J Appl Meteor. 2004; 43(10): 1452-1459. https://doi.org/10.1175/JAM2149.1
CrossRef - Sharma N, Jagadheesha D, Joshi P. C, Pal P. K. Atmospheric stability estimation using radio occultation data over India and surrounding region. Indian J Radio Space Phys. 2009; 38(6): 317-325. http://nopr.niscpr.res.in/handle/123456789/6899
- University of Wyoming. Atmospheric sounding data of Td, PW, and LI. Wyoming Weather Web. https://weather.uwyo.edu/upperair/sounding.html. Accessed May 21, 2023.
- Annarita Mariotti. U. S. Federal Meteorological Data Management Handbook: A Guide to Standards and Best Practices Release 2. FCM-H13-2021. Interagency Meteorological Coordination Office (IMCO). https://www.icams-portal.gov/resources/icams/related_documents/2021_fmh13.pdf. Published on December 2021. Accessed January 5, 2024.
- NASA. Precipitation Data. POWER Data Access Viewer. https://power.larc.nasa.gov/data.access.viewer. Accessed April 7, 2023.
- Hyderabad district, Government of Telangana. Description of the study area. https://hyderabad.telangana.gov.in/about-district/. Accessed January 3, 2024.
- American meteorological society. Precipitable water calculation. Glossary of meteorology. https://glossary.ametsoc.org/wiki/Precipitable_water. Published on January 26, 2012. Accessed May 21, 2023.
CrossRef - Galway J. G. The lifted index as a predictor of latent instability. Bull Amer Meteor Soc. 1956;37(10): 528-529. https://doi.org/10.1175/1520-0477-37.10.528
- US Department of Commerce, NOAA, National Weather Service. The lifted index value range. https://www.weather.gov/lmk/indices. Accessed May 15, 2023.
- Greville, Thomas NE. Recent developments in graduation and interpolation. Journal of the American Statistical Association. 1948; 43(243): 428-441. https://doi.org/10.1080/01621459.1948.10483272
CrossRef - Sharma A. K. Textbook of correlations and regression. Discovery Publishing House. 2005; 1-163. ISBN: 81-7141-935-6. Accessed 4 January 2024.


