Impact of Urbanization on Air Quality of Dehradun District
Sneha Dhankar
 , Gayatri Singh
and Krishan Kumar
*
, Gayatri Singh
and Krishan Kumar
*
1
School of Environmental Sciences,
Jawaharlal Nehru University,
New Delhi,
Delhi
India
Copy the following to cite this article:
Dhankar S, Singh G, Kumar K. Impact of Urbanization on Air Quality of Dehradun District. Curr World Environ 2024;19(1).
Copy the following to cite this URL:
Dhankar S, Singh G, Kumar K. Impact of Urbanization on Air Quality of Dehradun District. Curr World Environ 2024;19(1).
Citation Manager Publish History

Introduction
The allure of metropolitan settings sparks the aspirations of numerous individuals to reside in urban areas. As per the 2019 United Nations reports, it is projected that by the year 2050, cities will be home to two-thirds of the global population. The primary catalysts for variations in worldwide climate patterns can be attributed to the processes of urbanization and industrialization. Across the globe, cities have witnessed a rapid surge in population, resulting in the conversion of land surfaces—typically composed of flora and soil—into high-density structures and impermeable zones.
The construction of these impervious areas is largely due to the use of various materials, such as concrete, bricks, and tiles, as well as asphalt, for buildings, roads, and parking places.1,2 The urban environment is subject to change due to the thermal characteristics of the surfaces, as well as the emissions of heat, humidity, and pollution.3,4
Fuladlu & Altan5 investigated the contribution of LULC transformation to the air pollution in urban areas and the rise of major air pollutants and LST in Tehran and their concentration is significantly impacted by increasing height, as indicated by the negative association found between PM2.5, SO2, NO2, and altitude. According to a study, the urban heat island effect is caused by the high level of soil sealing and continuous built-up areas observed in Italian metropolitan regions, which significantly alter land surface temperature (LST) in different locations. There is a strong relationship between urban areas and LST variations across different cities of Italy.6 In a similar study over Kuala Lumpur, also shows that the urbanised area tends to raise the LST while vegetative area shows a decrease in LST.7 The study over different cities of Punjab also shows that urban areas generally exhibit higher average temperatures compared to suburban and rural locations.8 Pathak et al.,9 analysed the spatial pattern of LST and land indices (i.e. NDVI, NDBI and EBBI) and their interrelationship dynamics over the city of Agra and concluded that the city center has more increased LST than its periphery.
Numerous studies have concluded that there is a high correlation between LST and air pollutants, including carbon monoxide, hydrocarbons, sulfur dioxides and nitrogen oxides.5,10,11,12 Air pollution concentrations including sulfur dioxide, nitrous oxide, and hydrocarbon have increased as a result of several factors, including the fast growth of the population, coal mining, industrialization of the region, fast city development, and the proliferation of transportation options.13,14,15 A study over the Crimean Mountain River basins shows that the highest pollutant concentrations were seen in areas surrounding major urban centres and along important highways, with Simferopol with a considerable impact on the studied river basins. The complex index of atmospheric pollution was found to be highest in large settlements and nearby lands, whereas the lowest values were observed over forests. The emissions of atmospheric pollutants increased from 2018 to 2021.16 Gautam et al.,17 investigated the degree of air pollution exposure that people in Gujarat, India, experienced while participating in bonfire activities. Their research study discovered that PM2.5, PM10, and CO concentrations were greater than permissible limits, having a major detrimental impact on human health. They came to the conclusion that exposure to PM10 has adverse impact on human health than PM2.5 because larger particles were generated nearer to the source as compared to finer particles. Wright et al.,18 study showed that there is a considerable risk of cardiovascular diseases and respiratory ailments in Chinese cities when individuals are exposed to ambient air pollution over an extended period of time. Ambient air pollution, particularly SO2 and Ozone (O3), is linked with an elevated risk of severe respiratory and cardiovascular illnesses.
The emission of hazardous substances like aromatic hydrocarbons and particulate matter, as well as gaseous contaminants like ozone, nitrogen oxides, and sulfur dioxide, are primarily caused by vehicles, coal power plants, and agricultural activities.19,20,2122 NO2 concentration was found to be significantly higher throughout the year due to biomass fuel burning in the rural area of West Bengal.23 Aghazadeh et al.,24 found that the correlation between SUHI, airport, and population density was the most significant and it was most negatively correlated with NDVI and CO. They also reported that heat island and airport along with industrial area were found to be directly correlated while other land use classes were found to be inversely correlated and during the night all land use classes were directly correlated with heat islands.
Weng and Yang25 conducted a study in Guangzhou City and found that Particulate Matter, SO2 and NO2 were strongly linked with LST. Hereher26 finding also concludes that there is a positive relationship between UHII and CO2 and NO2. Bonn et al.,27 and Arabi et al.,28 stated that the implementation of more green roofs, urban green spaces and wooded areas could be beneficial in terms of decreasing particulate pollution, however, a decrease in NO mixing ratios would necessitate a decrease in traffic emissions. Panda et al.29 also conclude that tree plantation should be increased to curb air pollution based on the air pollution tolerance index plantation (APTI) of trees. Research indicates that along the southern part of China's Qinling-Huaihe line, green space has a larger mitigating effect on air pollution. There is empirical evidence to support the pollution-inhibiting function of greenspace, since it significantly lowers air pollution levels, which includes SO2, PM2.5, NO2, PM10, CO and O3. Different geographic areas are affected differently by it in terms of air pollution; cities in the south or with higher administrative levels noticeably see a decrease.30
Dehradun has experienced environmental deterioration, due to the unplanned growth of the city which shows a significant impact on the environment, particularly in vegetative regions.31 Nautiyal et al.,32 reported an increase in average LST by 14.8 during the period 2000-2010 and by 11.8 during 2010-2019 in Dehradun. The primary reasons for this increment in Land Surface Temperature values were urban intensification, urban layout, and anthropogenic heat sources such as traffic, commercial activities, and air conditioners. Piyoosh and Ghosh33 evaluated the fluctuations in Dehradun City's LULC between 1991 and 2019. Their results revealed that the urban area experienced a significant increase in population and vegetated regions were converted into settlement areas that also resulted in the observation of enhanced Land Surface Temperature. Deep et al.,34 analysed the air quality in Dehradun city from 2011 to 2014 and assessed the levels of Particle Matter (including both respirable and coarser particles) and pollutants such as SO2, and NO2 in various parts of the city. They reported that the PM10 and SPM exceeded the national standards during the winter season. Roy and Singha35 also found similar results in Siliguri city.
Our research diverges from prior Dehradun studies, which were often limited to short timeframes and primarily focused on Dehradun city.34,36 We address a significant research gap by encompassing the entire Dehradun district, enabling valuable urban-rural air quality comparisons. Additionally, while previous studies relied on older sensors34, we employ the higher-resolution TROPOMI data. Interestingly, our study covers 15 years, from 2005 to 2019, giving us a thorough understanding of trends in air pollutants. By taking into account various pollutants (NO2, HCHO, and CO) and environmental factors LST, Enhanced Vegetation Index (EVI), and precipitation (PPT), we also close another gap by providing a more comprehensive understanding of how these factors interact with the Dehradun district and the region's overall environmental health.
Hence, our research aims to assess the spatio-temporal fluctuations in air pollutants and additional environmental factors, alongside an examination of alterations in LULC within the Dehradun region from 2000 to 2019. Additionally, it examines monthly and seasonal variations in these parameters from 2019 to 2022. Furthermore, it investigates a fifteen-year trend in air pollutants trend from 2005 to 2019 over Dehradun district. The degradation of the quality of air in the district of Dehradun primarily stems from changes in LULC, with a continuous expansion of the built-up class and increased human activities, adversely influencing the overall environmental well-being in the area. This study highlights this critical issue and provides valuable insights for decision-makers. The unplanned urban sprawl that is negatively impacting the Dehradun district's ecology can be lessened by adopting well-informed action. In the case of Himalayan states such as Uttarakhand, which are highly vulnerable to environmental shifts, this holds particular significance due to their fragile ecology
Data description and methodology
Study area
Our study area i.e., district of Dehradun in Uttarakhand state of India, is located within the latitudes of 29 degrees 95 minutes North and 30 degrees 99 minutes North and longitudes of 77 degrees 57 minutes East and 78 degrees 31 minutes East. Situated between the Yamuna River and the Ganges River, the Dehradun district is surrounded by these waterways. In the district's north is the Shivalik Range, and in its south is the Himalayan Range. With a population density of 549 people per km² in 2011 (Census of India, 2011), Dehradun stands out as one of Uttarakhand's densely populated districts. Its size is 3088 km2. As of 2023, the district has a population of 2.25 million (Dehradun population, 2023).37 The district of Dehradun ranges in elevation from 269 meters to 3062 meters.
The district of Dehradun is made up of 767 villages, six blocks, and seven tehsils. Extreme winter temperatures are as low as 3.6 °C and as high as 19.3 °C; in contrast, extreme summer temperatures, which peak in June, are as high as 34.4 °C and as low as 29.4 °C. Monsoon months get the majority of the year's rainfall (2073.3 mm on average).38
.jpg) | Figure 1: Study area showing (a) Country of India; (b) State of Uttarakhand and (c) District of Dehradun
|
LANDSAT 5 and LANDSAT 8 data
For the present study area's LULC classification was derived from LANDSAT-5 images taken from 2000 and 2010. NASA launched the LANDSAT 5 spacecraft in 1984. With a resolution of thirty meters in each of the six bands (1–5) and 7, its MSS and TM sensors give the images. The thermal band is band no. 6. Utilizing the LANDSAT-8 dataset, we conducted a classification of our study area for the year 2019. On February 11, 2013, as a collaborative effort between NASA and the USGS. The thermal infrared sensor and the operational land imager (OLI) sensor are part of the payload carried by the Landsat 8 satellite. With a spatial resolution of thirty meters for SWIR, Near IR, and visible light, hundred meters for thermal, and fifteen meters for panchromatic, the OLI and TIRS sensors monitor the whole landmass. We employed a supervised classification approach to categorize our study area into distinct groups, including built-up areas, open forest, agricultural land, dense forest, open space or shrub land, fallow land and water bodies or dry riverbeds.
TROPOMI data
Data for CO, HCHO and NO2 was downloaded from the Copernicus Sentinel 5-Precursor Tropospheric Monitoring Instrument (S5-P/TROPOMI). The ESA i.e. European Space Agency launched this satellite on October 30, 2017. It is a sun-synchronous satellite which is currently positioned at an altitude of 824 kilometres as it orbits the Earth. Its equatorial crossing occurs in the afternoon at 13:30.39,40 With an enhanced spatial resolution of 5.5 kilometres by 3.5 kilometres (initially the resolution was 7 kilometres by 3.5 kilometres) at the nadir, the satellite offers higher spatial resolution data. The single instrument on the Sentinel 5P satellite, TROPOMI, features four spectrometers capturing radiance in 8 distinct spectral bands, spanning from UV to NIR. This extensive spectrum aids in the measurement of the ambient concentration of several trace gases, such as ozone, formaldehyde, carbon monoxide, nitrogen dioxide, and methane.41,42 Level 3 data was acquired for CO, formaldehyde (HCHO), and nitrogen dioxide (NO2) throughout a four-year period, from January 2019 to December 2022. Subsequently, the collected data underwent processing to generate monthly averaged spatial plots spanning the years 2019 to 2022, achieving a resolution of 5 km. Following this, the processed information was further analysed to produce a temporal series encompassing the entire four-year period.
OMI data
A valuable dataset spanning 15 years (January 2005 to December 2019) for formaldehyde (HCHO) and nitrogen dioxide (NO2) trends was extracted from the Ozone Monitoring Instrument i.e. OMI sensor. Long-time period duration is important for investigating the upward or downward trends over time. The data was collected from the OMI sensor aboard Aura satellite of NASA. This was a collaborative launch in 2004 involving Finnish and Dutch organizations.43 The OMI sensor utilizes a push-broom arrangement in its hyperspectral imager which encompass a broad swath of 2600 km. Spatial resolutions range from 13 kilometres by 24 kilometres at nadir to 28 kilometres by 160 kilometres at the outer extreme swath angle.44 The instrument measures various trace gases within the atmosphere, functioning as a near UV-visible spectrometer. To acquire data on HCHO and NO2 from the OMI sensor, the online data system Giovanni was utilized. Giovanni platform is developed by NASA GES DISC. The data, presented in monthly intervals, was retrieved in ASCII format. The fifteen-year time series plot for the Dehradun district, spanning from January 2005 to December 2019, was created using Microsoft Excel.
MOPITT data
The MOPITT sensor provided a large dataset spanning 16 years, from January 2005 to December 2020, in order to perform a thorough trend assessment of CO for the Dehradun district. An instrument on NASA's Terra satellite called MOPITT keeps track of carbon monoxide (CO) levels around the world. Its expansive 640 km wide swath enables the collection of data at the nadir, achieving a spatial resolution of 22 km by 22 km.45 Its approach uses a priori data and observed radiance to create CO vertical profiles via optimal estimation. The total column values of carbon monoxide (CO) are then obtained by integrating the profile.46 A monthly gridded MOPITT product, MOP03JM.009, was employed to examine CO temporal fluctuations throughout the district of Dehradun.
MODIS data
The Aqua satellite, launched by NASA in 2002, is furnished with MODIS sensor. Additionally, the NASA’s Terra satellite, launched in 1999, also carries the MODIS instrument. Sensor name MODIS stands for Moderate Resolution Imaging Spectroradiometer. For the present study, we have utilized data of MODIS sensor of Aqua satellite. The choice of Aqua is attributed to its equator crossing time at 1:30 P.M., aligning with the TROPOMI sensor utilized to gather trace gases data for the study area. Aqua has a wide swath of 2330 kilometres and orbits Earth at a height of 705 km. MODIS gathers information at different spatial resolutions, ranging from 250 m to 1000 m, covering thirty six spectral bands with wavelengths between 0.405 micrometres and 14.385 micrometers.47 For the present study, we first acquired daily land surface temperature over Dehradun at 1 km resolution using MODIS Aqua data (MYD11A1.061), and then we averaged it for monthly values across four years i.e. from 2019 to 2022. Additionally, we used monthly averaged MODIS Enhanced Vegetation Index (EVI) data for the Dehradun district with a resolution of one kilometre (MYD13A3.061).
CHIRPS data
Monthly precipitation data for the Dehradun district was obtained from the Climate Hazard Group Infra-Red Precipitation with Station data version 2.0 (CHIRPS-v2.0) datasets spanning the years 2019 to 2022. CHIRPS-v2.0 is a collaborative effort between the CHG and USGS which stand for Climate Hazard Group and the United States Geological Survey respectively. It offers dependable precipitation estimates globally for land areas within the range of 50 degrees South to 50 degrees North at a spatial resolution of 0.05 degrees. 48
Results and Discussion
Analysis of LULC in Dehradun District
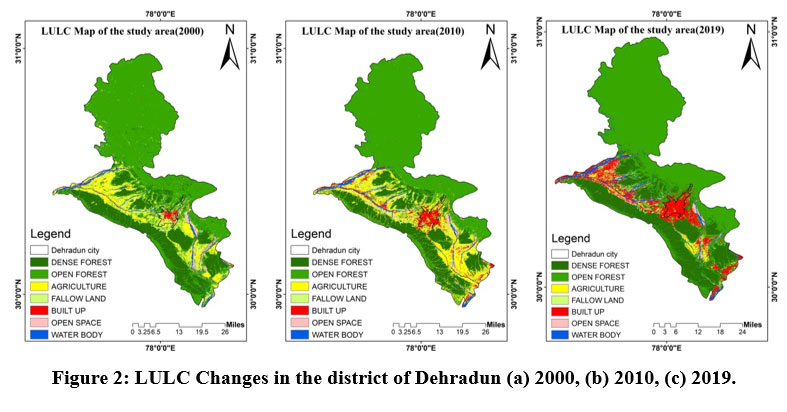
Over the past 20 years, the Dehradun district has seen notable changes in the LULC pattern. Dehradun's urban area has expanded significantly. Following Dehradun's designation as Uttarakhand's capital in 2000, the city saw an increase in population and a wide range of anthropogenic activities. During this timeframe, significant suburban development took place to accommodate the influx of new residents and the changing needs of the community. Between 2000 and 2010 and 2010 and 2019, the south and southeast of the city saw a rise in the built-up area. These regions were easier for construction in due to their gently sloped topography, and they are well-served by state and federal highways that link Dehradun to other regions of Uttarakhand as well as important towns.49
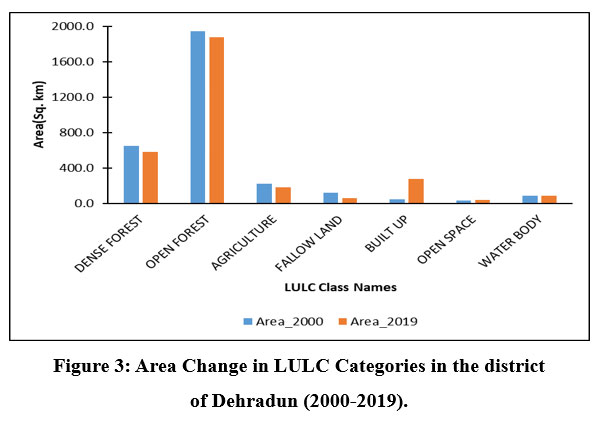
The Dehradun district's built-up area grew from 44.2 km2 to 276.5 km2 between 2000 and 2019. Between 2000 and 2019, the area covered by dense forest decreased from 649.2 km2 to 579.7 km2. In addition, the area of open forest has decreased from 1943.7 km2 to 1877.1 km2, while the area used for agriculture has decreased from 221 km2 to 179.6 km2.
.jpg) | Figure 2: LULC Changes in the district of Dehradun (a) 2000, (b) 2010, (c) 2019.
|
.jpg) | Figure 3: Area Change in LULC Categories in the district of Dehradun (2000-2019).
|
Spatial variations of air pollutants across the district of Dehradun
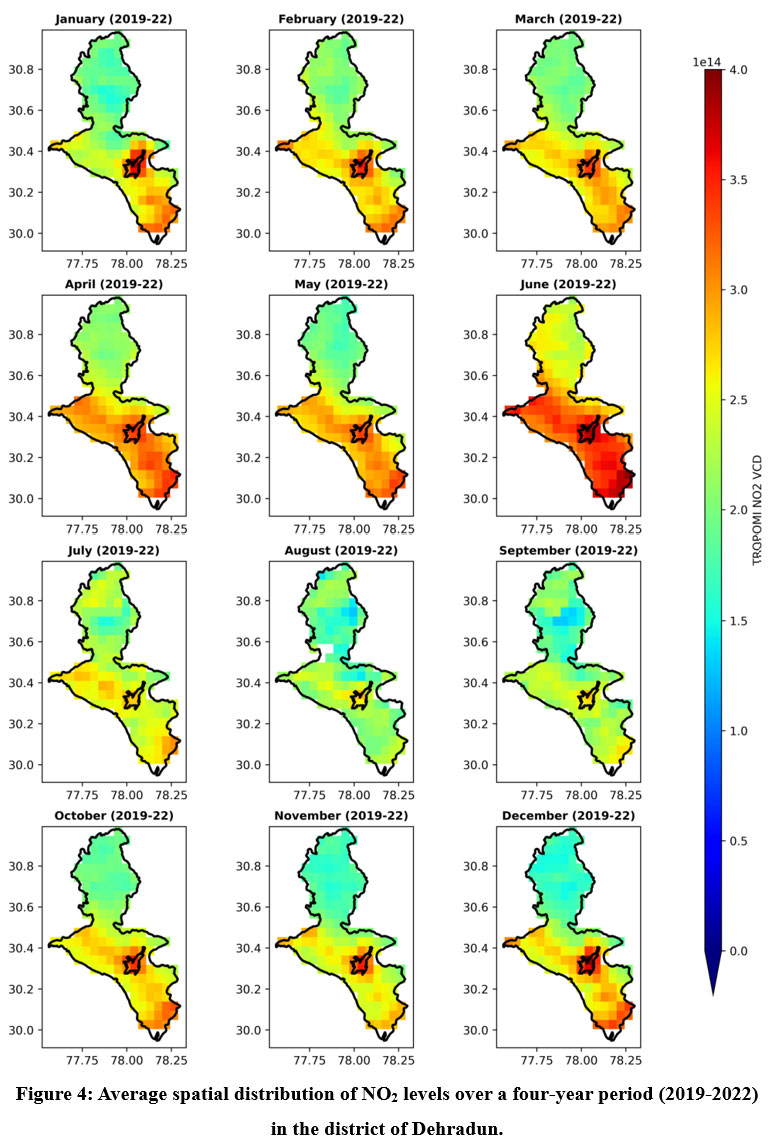
Figure 4 shows the monthly spatial variations in the nitrogen dioxide distribution over the Dehradun district averaged across the four years i.e. from 2019 to 2022. Higher levels of NO2 are observed from December to June. Maps depicting the spatial distribution of nitrogen dioxide highlight Dehradun city as a significant hotspot within the district of Dehradun. This assessment suggests that urbanized regions serve as the predominant source of NO2. According to the results of the change detection analysis as discussed in Section 3.1, the only class in the Dehradun district that has seen a considerable rise over the past 20 years is the "built-up" class. Since the combustion process releases nitrogen dioxide into the atmosphere, it can be used as a proxy for the fossil fuel-based energy consumption that is often highest in metropolitan areas.50,51 Consequently, the process of urbanization, particularly in and around Dehradun city, is associated with elevated levels of nitrogen dioxide in this region.
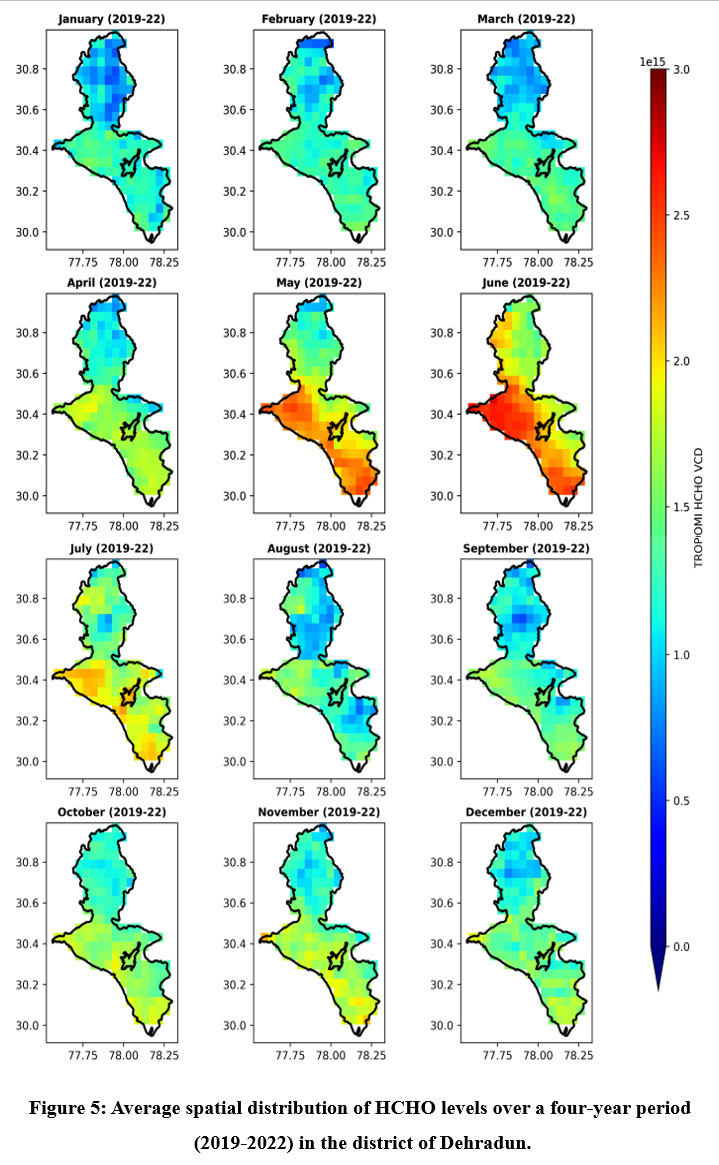
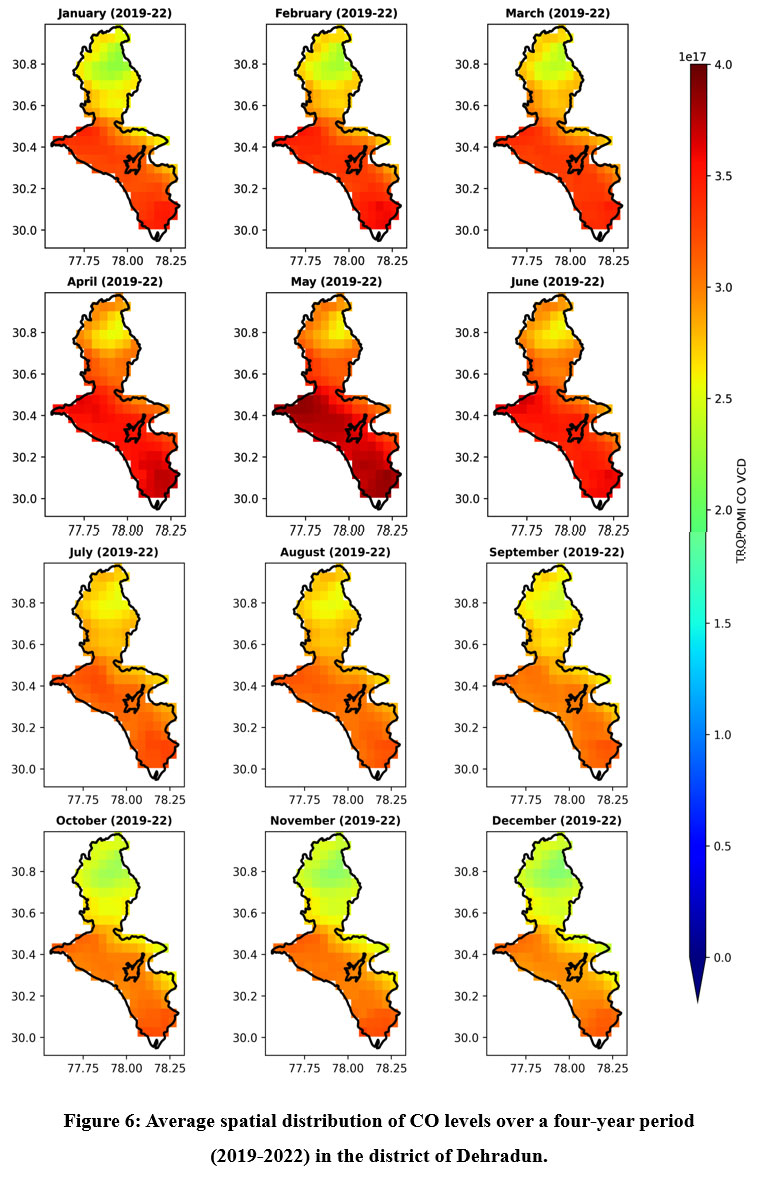
For other pollutants, such as formaldehyde and carbon monoxide (Figures 5 and 6), an observation reveals that the northern regions in the district of Dehradun consistently display minimum pollutants concentrations in comparison to the southern regions throughout the year. The increased pollution in the southern regions is due to substantial urbanization, as discussed in section 3.1. Spatial representations of formaldehyde illustrate that peak HCHO levels are prevalent from April to July (Figure 5). Anthropogenic activities contribute to elevated formaldehyde concentrations, particularly in the lower regions characterized by extensive built-up areas in the Dehradun district. The expansion of built-up areas in the Dehradun district (Section 3.1) has resulted in heightened anthropogenic activities, contributing to increased anthropogenic formaldehyde (HCHO) emissions. Elevated levels of formaldehyde (HCHO) are notably observed in the months of summer season, particularly in the south and southwest areas of the district which is characterized by dense forests (as depicted in Figure 2). This finding is consistent with the widely acknowledged understanding that HCHO is significantly released from biogenic sources.52,53
Spatial representations of CO also indicate peak concentrations from January to June, with the highest levels observed in the month of May (Figure 6). Spatially, higher levels of CO are observed in the southern region of Dehradun. It is possibly due to the high urbanization, resulting in a denser population in this region, and incomplete combustion from human activities like burning biomass and fossil fuels, as well as vehicle emissions, is known to release carbon monoxide into the atmosphere.54,55
.jpg) | Figure 4: Average spatial distribution of NO2 levels over a four-year period (2019-2022) in the district of Dehradun.
|
.jpg) | Figure 5: Average spatial distribution of HCHO levels over a four-year period (2019-2022) in the district of Dehradun.
|
.jpg) | Figure 6: Average spatial distribution of CO levels over a four-year period (2019-2022) in the district of Dehradun.
|
Temporal Changes in Air Pollutants and Environmental Factors in the district of Dehradun
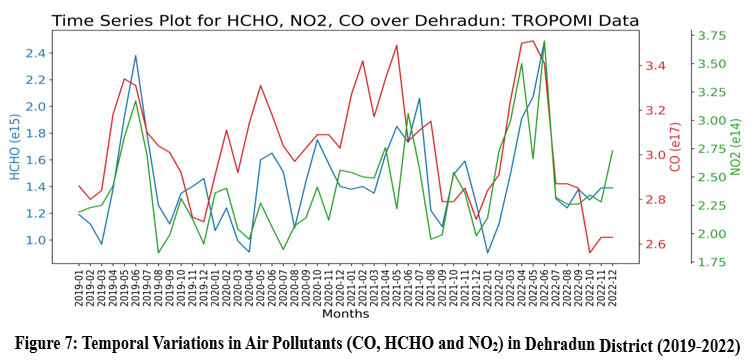
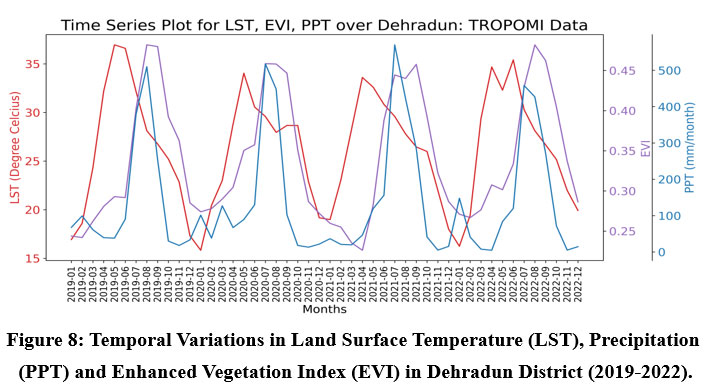
Over a four-year period, a time series of TROPOMI data averaged on a monthly basis for carbon monoxide, formaldehyde and nitrogen dioxide reveals seasonal variations in air pollutants over the study region. (Figure 7). These pollutants exhibit higher concentrations during the summer months, coinciding with elevated land surface temperatures (Figure 8). Figure 8 demonstrates that the Dehradun district experiences maximum precipitation from July to September, aligning with minimum levels of nitrogen dioxide and formaldehyde levels during these months, indicating pollutant washout during the wet season.
.jpg) | Figure 7: Temporal Variations in Air Pollutants (CO, HCHO and NO2) in Dehradun District (2019-2022)
|
.jpg) | Figure 8: Temporal Variations in Land Surface Temperature (LST), Precipitation (PPT) and Enhanced Vegetation Index (EVI) in Dehradun District (2019-2022).
|
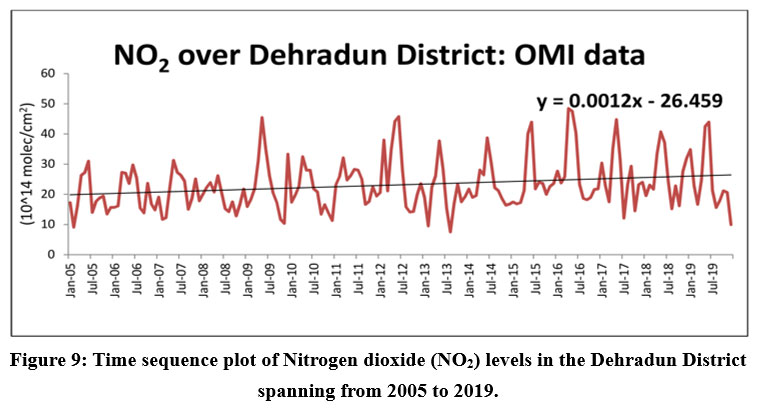
Illustrated in Figure 9 is a presenting NO2 data (obtained from OMI sensor) from 2005 to 2019. Despite potential data errors introduced by the row anomaly issue after several years in operation (as highlighted by De Smedt et al.,42) the data efficiently captures the general trends of higher and lower values. Consequently, it can be effectively utilized for analysing trends in pollutants over the Dehradun district. The trend assessment of a 15-year time series for NO2 reveals an increasing trend over the study region (depicted in Figure 9). The rising trend is linked to the growing urbanization in the Dehradun district over the years (as discussed in section 3.1) and elevated anthropogenic activities contribute to increased emissions of NO2. 50,51
.jpg) | Figure 9: Time sequence plot of Nitrogen dioxide (NO2) levels in the Dehradun District spanning from 2005 to 2019.
|
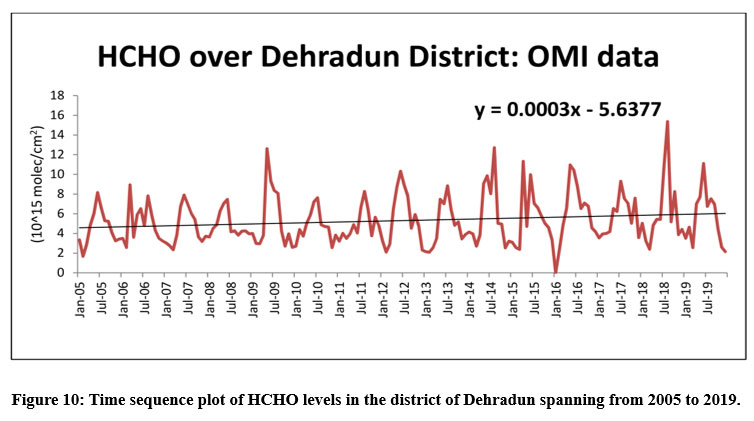
Displayed in Figure 10 is a plot of time series illustrating HCHO data (obtained from OMI sensor) from 2005 to 2019. Similar to NO2, OMI data is effective in capturing the general trends of higher and lower values of HCHO across the Dehradun district. The plot of the time series of monthly average formaldehyde from OMI sensor data also reveals an increasing trend in the study area (as seen in Figure 10). Formaldehyde emissions arise from both biogenic and anthropogenic sources and as urbanization increases in the region, the anthropogenic emissions of HCHO are also increasing. It should also be noted here that the slope of the increasing trendline of NO2 is higher than the HCHO (Figures 9 and 10). This is due to formaldehyde being significantly emitted from biogenic sources also (Millet et al.,52, Marais et al.,53) and a decrease in the forest class is observed in the Dehradun district (Figure 3). Consequently, a comparatively lower slope of the increasing trend is observed for HCHO.
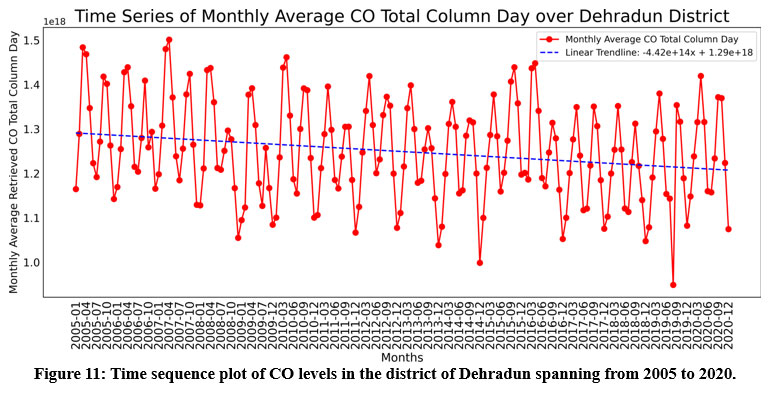
No evident upward trend is noted in the context of CO, as depicted in Figure 11; instead, a declining pattern is obtained. This trend could be attributed to the expanding adoption of the Ujjwala Yojana, leading to increased LPG cylinder usage and a subsequent decline in biomass burning, a notable contributor to carbon monoxide emissions in the area.
.jpg) | Figure 10: Time sequence plot of HCHO levels in the district of Dehradun spanning from 2005 to 2019.
|
.jpg) | Figure 11: Time sequence plot of CO levels in the district of Dehradun spanning from 2005 to 2020.
|
Analysis of Correlation Matrix of Environmental Factors and Air Pollutants in the Dehradun District
The correlation matrix (Table 1) reveals strong and significant correlations among the air pollutants. For example, the correlation between NO2 and CO stands at 0.652, between HCHO and CO is 0.583, and between HCHO and NO2 is 0.619. These robust and strong positive correlations suggest shared sources or influences among these air pollutants, indicating a closely intertwined photochemistry within the atmospheric composition of the Dehradun district. The lifetime of formaldehyde in the atmosphere is brief, lasting only a few hours, and ultimately transforming into carbon monoxide with a near-unity yield (Palmer et al.,56, Gaubert et al.,57). NOx results in the formation of OH radicals in the atmosphere which then react with various volatile organic compounds (VOCs) to produce HCHO. Furthermore, upon closer examination, we observe a noteworthy correlation between land surface temperature (LST) and the air pollutants HCHO, NO2, and CO. This underscores the influence of human activities or the expansion of built-up areas on the rise in temperature and the increase of air pollutant levels in the study region. Precipitation (PPT) shows a negative correlation with the atmospheric pollutants, highlighting the washout of these atmospheric species during the rainy season. In addition, PPT exhibits a positive correlation with the enhanced vegetation index (EVI), indicating the influence of precipitation on vegetation growth. Thus, these correlation values provide valuable insights into the interdependence among air pollutants and environmental factors in the Dehradun district.
Table 1: Correlation Matrix of Environmental Factors and Air Pollutants
Correlations | ||||||
CO | NO2 | HCHO | LST | EVI | PPT | |
CO | ||||||
NO2 | .652** | |||||
HCHO | .583** | .619** | ||||
LST | .621** | .441** | .530** | |||
EVI | .053** | -.061** | .041** | .174** | ||
PPT | .009 | -.165** | -.003 | .210** | .547** | |
**. Correlation is significant at the 0.01 level (2-tailed). | ||||||
Conclusions
Rapid urbanization in the Dehradun district has led to a significant rise in the built-up area from 1.4% to 8.9% over the course of two decades (2000–2019). This urban expansion has, in turn, resulted in the degraded air quality of the region. Spatial analysis reveals that these higher concentrations of air pollutants (NO2, HCHO, and CO) are primarily concentrated in the southern regions of the Dehradun district, where urban development is more prominent. Furthermore, over time, there has been a consistent increase in both the built-up area and the concentration of air pollutants, especially formaldehyde and nitrogen dioxide. Also, the temporal variations show that the air pollutant levels tend to peak during the summer months. The robust positive correlations between LST and these pollutants (correlation coefficient value between LST and CO is 0.621, LST and NO2 is 0.441, and LST and HCHO is 0.530) highlight the influence of anthropogenic activities on temperature rise. Additionally, there is a robust positive correlation among the various air pollutants, indicating shared sources or influences among them. This research underscores the significance of tackling the negative impacts of swift urbanization on both the Dehradun's air quality and the overall environmental health. It accentuates the essential need for deploying sustainable urban planning and management strategies in the region.
Acknowledgement
The authors express their gratitude to School of Environmental Sciences (SES), Jawaharlal Nehru University (JNU) for facilitating the execution of this study. They also wish to acknowledge the teams behind the TROPOMI Sentinel 5-p, OMI, LANDSAT 5 and LANDSAT 8, MOPITT, MODIS and CHIRPS (v2.0) for providing the freely available data. Additionally,one of the authors Sneha Dhankar received Senior Research Fellowship (RollNo.: 15045013, UGC-Ref. No.:3524/(NET-JAN 2017)) from the University Grants Commission (UGC), India,which was crucial in the successful completion of this study.
Funding Sources
Senior Research Fellowship UGC-Ref. No.:3524/(NET-JAN 2017)) from the University Grants Commission (UGC),
Conflict of Interest
The author(s) declares no conflict of interest.
Author contributions
Sneha Dhankar, Gayatri Singh and Krishan Kumar conceived the idea; Sneha Dhankar, Gayatri Singh designed and analysed the data; Sneha Dhankar, Gayatri Singh contributed materials/analysis tools; Sneha Dhankar and Gayatri Singh wrote the manuscript and Krishan Kumar edited the manuscript.
Data availability statement
The manuscript incorporates all datasets produced or examined throughout this research study. The raw data supporting the conclusions of this article will be made available by the authors, without undue reservation.
Ethics Approval Statement
Not Applicable
References
- Landsberg HE. The urban climate. Academic Press; 1981.
- Pandey P, Kumar D, Prakash A, Kumar K, Jain VK. A study of the summertime urban heat island over Delhi. Int J Sustain Sci Stud. 2009;1(1):27-34.
- Roth M, Oke TR, Emery WJ. Satellite-derived urban heat islands from three coastal cities and the utilization of such data in urban climatology. Int J Remote Sens. 1989;10(11):1699-1720. doi:10.1080/01431168908904002
- Nguyen QK, Trinh LH, Dao KH, Dang ND. Land Surface Temperature Dynamics In Dry Season 2015-2016 According To Landsat 8 Data In The South-East Region of Vietnam. Geogr Environ Sustain. 2019;12(1):75-87. doi:10.24057/2071-9388-2018-06
- Fuladlu K, Altan H. Examining land surface temperature and relations with the major air pollutants: A remote sensing research in case of Tehran. Urban Climate. 2021;(June). doi:10.1016/j.uclim.2021.100958
- Morabito M, Crisci A, Messeri A, et al. The impact of built-up surfaces on land surface temperatures in Italian urban areas. Sci Total Environ. 2016;551:317-326.
- Isa NA, Wan Mohd WMN, Salleh SA. The effects of built-up and green areas on the land surface temperature of the Kuala Lumpur City. Int Arch Photogramm Remote Sens Spatial Inf Sci. 2017;42:107-112.
- Mukherjee S, Joshi PK, Garg RD. Analysis of urban built-up areas and surface urban heat island using downscaled MODIS derived land surface temperature data. Geocarto Int. 2017;32(8):900-918.
- Pathak C, Chandra S, Maurya G, et al. The effects of land indices on thermal state in surface urban heat island formation: a case study on Agra City in India using remote sensing data (1992–2019). Earth Syst Environ. 2021;5:135-154.
- Lai LW, Cheng WL. Air quality influenced by urban heat island coupled with synoptic weather patterns. Sci Total Environ. 2009;407(8):2724-2733. doi:10.1016/j.scitotenv.2008.12.002
- Alseroury FA. The Effect of Pollutants on Land Surface Temperature Around Power Plant. Int J Mech Prod Eng. 2015;3:2320–2092.
- Ngarambe J, Joen SJ, Han CH, Yun GY. Exploring the relationship between particulate matter, CO, SO2, NO2, O3 and urban heat island in Seoul, Korea. J Hazard Mater. 2021;403(2):123615. doi:10.1016/j.jhazmat.2020.123615
- Kean AJ, Sawyer RF, Harley RA. A fuel-based assessment of off-road diesel engine emissions. J Air Waste Manage Assoc. 2000;50(11):1929–1939. doi:10.1080/10473289.2000.10464233
- Ghose MK, Majee SR. Sources of air pollution due to coal mining and their impacts in Jharia coalfield. Environ Int. 2000;26(1-2):81-85.
- Khare M, Nagendra SS. Vehicular Pollution. In: Artificial Neural Networks in Vehicular Pollution Modelling. Springer; 2007:7-24.
- Tabunschik V, Gorbunov R, Gorbunova T. Unveiling Air Pollution in Crimean Mountain Rivers: Analysis of Sentinel-5 Satellite Images Using Google Earth Engine (GEE). Remote Sensing. 2023;15(13):3364.
- Gautam S, Talatiya A, Patel M, Chabhadiya K, Pathak P. Personal exposure to air pollutants from winter season bonfires in rural areas of Gujarat, India. Exposure and Health. 2020;12(1):89-97.
- Brocco D, Fratarcangeli R, Lepore L, Petricca M, Ventrone I. Determination of aromatic hydrocarbons in urban air of Rome. Atmos Environ. 1997;31(4):557-566.
- Padilla CM, Kihal-Talantikite W, Vieira VM, et al. Air quality and social deprivation in four French metropolitan areas-A localized spatiotemporal environmental inequality analysis. Environ Res. 2014;134:315-324. doi:10.1016/j.envres.2014.07.017
- Wright N, Newell K, Chan KH, Gilbert S, Hacker A, Lu Y, ... & Kartsonaki C. Long-term ambient air pollution exposure and cardio-respiratory disease in China: findings from a prospective cohort study. Environ Health. 2023;22(1):1-11.
- Downey N, Emery C, Jung J, et al. Emission reductions and urban ozone responses under more stringent US standards. Atmos Environ. 2015;101:209-216. doi:10.1016/j.atmosenv.2014.11.018
- Abdel-Shafy HI, Mansour MS. A review on polycyclic aromatic hydrocarbons: source, environmental impact, effect on human health and remediation. Egypt J Petrol. 2016;25(1):107-123.
- Chakraborty D, Mondal NK. Estimation of nitrogen dioxide (NO2) due to burning of household biomass fuel and assessment of health risk among women in rural West Bengal. Curr World Environ. 2021;16(SI1):1-8.
- Aghazadeh F, Bageri S, Garajeh MK, et al. Spatial-temporal analysis of day-night time SUHI and its relationship between urban land use, NDVI, and air pollutants in Tehran metropolis. Appl Geomatics. 2023;15(3):697-718. doi:10.1007/s12518-023-00515-w
- Weng Q, Yang S. Urban Air Pollution Patterns, Land Use, and Thermal Landscape: An Examination of the Linkage Using GIS. Environ Monit Assess. 2006;117:463–489. doi:10.1007/s10661-006-0888-9
- Hereher ME. Climate Change during the Third Millennium—The Gulf Cooperation Council Countries. Sustainability. 2022;14(21):14181.
- Bonn B, Von Schneidemesser E, Andrich D, et al. BAERLIN2014 -The influence of land surface types on and the horizontal heterogeneity of air pollutant levels in Berlin. Atmos Chem Phys. 2016;16(12):7785–7811. doi:10.5194/acp-16-7785-2016
- ARAbI R, SHAHIdAn MF, Kamal MM, Jaafar MFZB, Rakhshandehroo M. Mitigating urban heat island through green roofs. Curr World Environ. 2015;10(1):918-927.
- Panda LL, Aggarwal RK, Bhardwaj DR. A review on air pollution tolerance index (APTI) and anticipated performance index (API). Curr World Environ. 2018;13(1):55.
- Ai H, Zhang X, Zhou Z. The impact of greenspace on air pollution: empirical evidence from China. Ecological Indicators. 2023;146:109881.
- Goyal G, et al. International journal of environment. Int J Environ. 2014;1(1):9–19. https://citeseerx.ist.psu.edu/viewdoc/download?doi=10.1.1.883.2659&rep=rep1&type=pdf
- Nautiyal G, Maithani S, Sharma A. Exploring the Relationship Between Spatio-temporal Land Cover Dynamics and Surface Temperature Over Dehradun Urban Agglomeration, India. J Indian Soc Remote Sens. 2021;49(6):1307–1318. doi:10.1007/s12524-021-01323-8
- Piyoosh AK, Ghosh SK. Analysis of land use land cover change using a new and existing spectral indices and its impact on normalized land surface temperature. Geocarto Int. 2020;37(8):2137–2159. doi:10.1080/10106049.2020.1815863
- Deep A, Pandey CP, Nandan H, et al. Evaluation of ambient air quality in Dehradun city during 2011–2014. J Earth Syst Sci. 2019;128(4):1–14. doi:10.1007/s12040-019-1092-y
- Roy S, Singha N. Analysis of ambient air quality based on exceedance factor and air quality index for Siliguri City, West Bengal. Curr World Environ. 2020;15(2):235.
- Kansal A, Subuddhi SP, Pandey P, et al. Investigating the Impression of National Clean Air Programme in Enhancement of Air Quality Characteristics for Non-attainment Cities of Uttarakhand. Aerosol Sci Eng. 2023:1-11.
- Dehradun Population,2023. n.d. https://doi.org/23-05-2023
- Anand Sharma O. P. Singh M. M. Saklani. Climate of Dehradun. Indian Meteorological Department,Government of India,Ministry of Earth Sciences. 2012. https://doi.org/2012
- Pakkattil A, Muhsin M, Varma MKR. COVID-19 lockdown: Effects on selected volatile organic compound (VOC) emissions over the major Indian metro cities. Urban Climate. 2021;37. doi:10.1016/j.uclim.2021.100838
- Stavrakou T, Müller JF, Bauwens M, et al. Atmospheric impacts of COVID-19 on NOx and VOC levels over China based on TROPOMI and IASI satellite data and modeling. Atmosphere. 2021;12(8). doi:10.3390/atmos12080946
- Veefkind JP, et al. TROPOMI on the ESA Sentinel-5 Precursor: A GMES mission for global observations of the atmospheric composition for climate, air quality and ozone layer applications. Remote Sens Environ. 2012;120:70–83. doi:10.1016/j.rse.2011.09.027
- De Smedt, I., Pinardi, G., Vigouroux, C., Compernolle, S., Bais, A., Benavent, N., Boersma, F., Chan, K. L., Donner, S., Eichmann, K. U., Hedelt, P., Hendrick, F., Irie, H., Kumar, V., Lambert, J. C., Langerock, B., Lerot, C., Liu, C., Loyola, D., … Van Roozendael, M.
- Levelt PF. TROPOMI on the ESA Sentinel-5 Precursor: A GMES mission for global observations of the atmospheric composition for climate, air quality and ozone layer applications. Remote Sens Environ. 2012;120:70–83. doi:10.1016/j.rse.2011.09.027.
- Millet DB, Jacob DJ, Boersma KF, et al. Spatial distribution of isoprene emissions from North America derived from formaldehyde column measurements by the OMI satellite sensor. J Geophys Res Atmos. 2008;113(2). doi:10.1029/2007JD008950
- Drummond JR, Zou J, Nichitiu F, et al. A review of 9-year performance and operation of the MOPITT instrument. Adv Sp Res. 2010;45:760e774.
- Deeter MN, et al. Operational carbon monoxide retrieval algorithm and selected results for the MOPITT instrument. J Geophys Res. 2003;108(D14):4399. http://dx.doi.org/10.1029/2002JD003186.
- Justice CO, Townshend JRG, Vermote EF, et al. An overview of MODIS Land data processing and product status. Remote Sens Environ. 2002;83:3–15. http://www.edc.usgs.gov/programs/sddm/modisdist/index.shtml
- Funk C, Peterson P, Landsfeld M, et al. The climate hazards infrared precipitation with stations - A new environmental record for monitoring extremes. Sci Data. 2015;2. doi:10.1038/sdata.2015.66
- Maithani S. A quantitative spatial model of urban sprawl and its application to Dehradun urban agglomeration, India. J Indian Soc Remote Sens. 2020;48(11):1583-1592.
- Ghude SD, Fadnavis S, Beig G, Polade SD, van der A RJ. Detection of surface emission hot spots, trends, and seasonal cycle from satellite-retrieved NO2 over India. J Geophys Res Atmos. 2008;113(20). https://doi.org/10.1029/2007JD009615
- Duncan BN, Lamsal LN, Thompson AM, Yoshida Y, Lu Z, Streets DG, Hurwitz MM, Pickering KE. A space?based, high?resolution view of notable changes in urban NOx pollution around the world (2005–2014). J Geophys Res Atmos. 2016;121(2):976–996. https://doi.org/10.1002/2015JD024121
- Millet DB, Jacob DJ, Boersma KF, Fu TM, Kurosu TP, Chance K, Heald CL, Guenther A. Spatial distribution of isoprene emissions from North America derived from formaldehyde column measurements by the OMI satellite sensor. J Geophys Res Atmos. 2008;113(2). https://doi.org/10.1029/2007JD008950
- Marais EA, Jacob DJ, Kurosu TP, Chance K, Murphy JG, Reeves C, Mills G, Casadio S, Millet DB, Barkley MP, Paulot F, Mao J. Isoprene emissions in Africa inferred from OMI observations of formaldehyde columns. Atmos Chem Phys. 2012;12(14):6219–6235. https://doi.org/10.5194/acp-12-6219-2012
- Vadrevu KP, Giglio L, Justice C. Satellite-based analysis of fire-carbon monoxide relationships from forest and agricultural residue burning (2003-2011). Atmos Environ. 2013;64:179–191. https://doi.org/10.1016/j.atmosenv.2012.09.055
- Girach IA, Nair PR. Carbon monoxide over Indian region as observed by MOPITT. Atmos Environ. 2014;99:599–609. https://doi.org/10.1016/j.atmosenv.2014.10.019
- Palmer PI, Jacob DJ, Jones DBA, Heald CL, Yantosca RM, Logan JA, Sachse GW, Streets DG. Inverting for emissions of carbon monoxide from Asia using aircraft observations over the western Pacific. J Geophys Res Atmos. 2003;108(D21). https://doi.org/10.1029/2003JD003397
- Gaubert B, Arellano AF, Barré J, Worden HM, Emmons LK, Tilmes S, Buchholz RR, Vitt F, Raeder K, Collins N, Anderson JL, Wiedinmyer C, Martinez Alonso S, Edwards DP, Andreae MO, Hannigan JW, Petri C, Strong K, Jones N. Toward a chemical reanalysis in a coupled chemistry?climate model: An evaluation of MOPITT CO assimilation and its impact on tropospheric composition. J Geophys Res Atmos. 2016;121(12):7310–7343. https://doi.org/10.1002/2016JD024863


