Land Use-Land Cover Changes and Associated Drivers: A case of Salooni Block of Chamba
Twinkle Vaid1
*
 and Sanjay Singh Pathania2
1
Department of Geography,
Himachal Pradesh University Shimla,
Himachal Pradesh
India
2
Department of Geography, Associate Professor,
Post Graduate Government Degree College,
Dharamshala,
Himachal Pradesh
India
Copy the following to cite this article:
Vaid T, Pathania S. Land Use-Land Cover Changes and Associated Drivers: A case of Salooni Block of Chamba. Curr World Environ 2024;19(1).
Copy the following to cite this URL:
Vaid T, Pathania S. Land Use-Land Cover Changes and Associated Drivers: A case of Salooni Block of Chamba. Curr World Environ 2024;19(1).
Citation Manager Publish History

Introduction
Land is a valuable natural resource that contributes significantly to the growth and survival of humans by providing them with food and shelter. The land use and land cover pattern of a region results from how humans have used natural and socioeconomic elements over time and space. Despite having diverse land uses, two pieces of land could have identical land cover. Therefore comprehending the natural landscape and how humans use it requires an understanding of LULC.1 There are very few landscapes on Earth that have not undergone major human influence in one form or another.2 The LULC changes have become significant concerns since they are largely unplanned and reflect in ecological issues as deforestation, soil erosion, landslides, loss of biodiversity, and modifications to hydrological systems, land degradation, and increased food insecurity.3 In this age of development, sustainability issues including protecting the environment, combating climate change, increasing food supply, and reducing energy usage are often addressed through visual representations of the landscape, such as LULC.4 The purpose of LULC dynamics has become essential in today's time, when everyone is concerned about the future of the planet and discussing consciously about the UN Sustainable Development Goals. The collecting and processing of data for the detection of LULC changes today highly depends on geospatial technology. Remotely sensed data can quickly deliver the right information. As a result, studying time-based changes in the LULC dynamics quickly provides more accuracy at a lower cost over a wide geographic area.5,6 In the state of Himachal Pradesh, crops and land use patterns have changed over time and it is still continuing in a rapid rate. In comparison to other Indian states, Himachal Pradesh has experienced a comparatively more severe growth of farming at the loss of forests.7 The alterations in Landscape is affecting the livelihoods of people in numerous ways. It is essential to maintain Land Use Land Cover sustainably for the livelihood of more than 100 million people living in the Himalayas as well as many more people living in the nearby Indo-Gangetic plains, as rapid erosion brought on by improper land-use practices in the Himalayan region affects the plains.8,9
The changes in land use over the time will help to understand the vulnerability and present situation of the land. Significant studies on the Land Use Change in Himachal Pradesh have been conducted in the past as well. One of the study focused on the Kullu Region and came to the conclusion that while tourism has boosted the region's economy, there is an abundance of pressure on its natural resources. 10 Another notable investigation into the Pangi Valley came to the conclusion that the region's biophysical characteristics are altering as a result of the continual construction of road networks in the vulnerable mountainous terrain.11 Chamba is one of the twelve districts of Himachal Pradesh where the population survives in most inhospitable terrains. The present study area, Salooni block of Chamba is a backward region with agriculture as their main sustenance activity. Thus, the present study attempts to quantify distinct LULC changes, evaluate the causes accountable for them, and identify the cause-and-effect links resulting from interactions between physical, economic, and social components in the study area.
Study Area
Salooni is one of the seven Community Development Blocks of Chamba district. At a height of 1829 metres, Salooni is surrounded by the Pir Panjal in the north and the Dhauladhar ranges in the south. The valley is located 56 kilometres away from Chamba provides magnificent sights of snow-capped mountains of Dhaula Dhar and Pir-Panjal
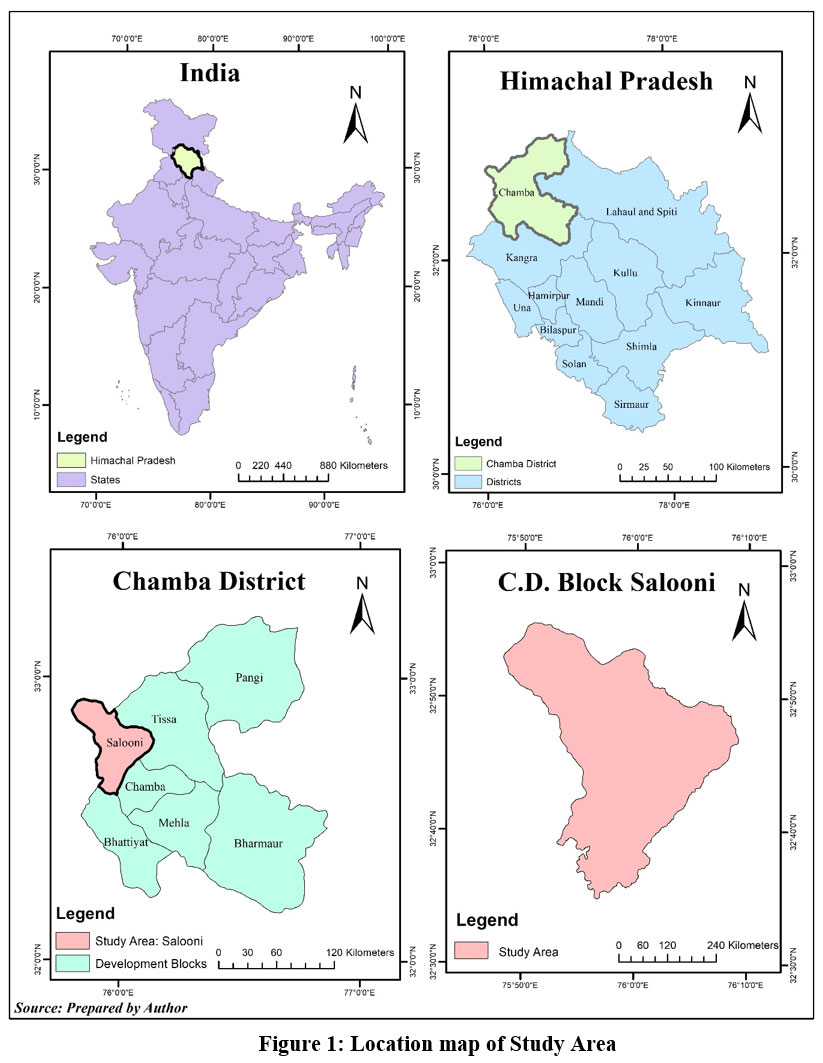 | Figure 1: Location map of Study Area.
|
The present study area of Community Development Block Salooni includes tehsil Salooni, sub tehsil Bhalai and parts of Churah tehsil. The coordinates of study area are 32°30'0'N - 33°00'0'N and 75°45'0''E – 76°15'0''E. It covers an area of 576.5 sq.kms with the total population of 81,556.12 There are 46 Gram Panchayats in total which further comprises 306 villages. Due to inhospitable terrain of the region many of the villages are uninhabited, only 233 villages have population residing in them. Due to the high altitude and difficult terrain of this mountainous region population has remained dependent on their natural resources for their livelihood. The valley is plentiful with natural flora and fauna which can prove as a boon for income generation for locals in the study area. With the changing times and government initiatives like road constructions, building of dams, infrastructural development for tourism sector has opened new avenues for the population here. Given that the population in the study area of Salooni depends on farming as a source of food and income, micro area farming can help the people in retaining their livelihood and also conserving the environment they live in.
Data Sources
For mapping Land-Use & Land-Cover of the study area secondary sources like Topographical Sheets, District Census Handbooks and Satellite imageries have been referred. The brief description of the datasets for multi-temporal satellite imageries and topographical sheets that was utilised have been listed in (table1). In order to comprehend how land use and land cover have changed over time in the study area, two Landsat imageries were extracted from United States Geological Survey (USGS). For the year 2002, Landsat-7 Enhanced Thematic Mapper (ETM+) of April month and for 2022, Landsat-8 Operational Land Imager (OLI) of April month with a spatial resolution of 30 m was used. In order to comprehend the ground truth and causes accountable for the change in twenty years, primary data was collected from Key Informants in study area. In order to collect data for the same, fifty people over the age of fifty were interviewed, since they have witnessed the changes during the course of their lives. The questions were designed to encompass the widest range of factors that could be responsible for changes in LULC in the area.
Table 1: Specifications of Data utilised.
Type | Data Type | Sensor | Date of Acquisition | Spatial Resolution (m) | Path/ | Cloud | Source |
Sateliite Imageries | Landsat 7 | ETM+ | 9th April 2002 | 30 | 147/38 | 4 | USGS- Online
|
Landsat 8 | OLI | 12th April 2022 | 30 | 147/38 | 3.5 | ||
Topographical Sheets | Number | Scale | Survey of India | ||||
43P/13, 43P/14, 52D/1, 52D/2 | 1:50000 | ||||||
Methodology
Figure 2 displays the whole methodology framework and data analysis. The precise methodology of the study is described further. Image processing and data analysis were carried out using remote sensing and GIS software, such as ERDAS Imagine 2014 and ArcGIS 10.3. The extracted satellite images have been analysed and processed for any atmospheric and radiometric rectifications. Afterwards, all the required six bands of respective images have been combined in ArcGIS for acquiring a composite map. Following image processing, signatures were distributed per pixel by classifying the land between 2002 and 2022 into seven categories. To distinguish one class from another, each was given a special identity and given a specified colour. Training samples had been determined by drawing a delimiting polygon around representative sites for each of the predefined LULC categories. LULC classification entails grouping every object into its appropriate category and arranging them all in a hierarchy to show how each object differs from the others.
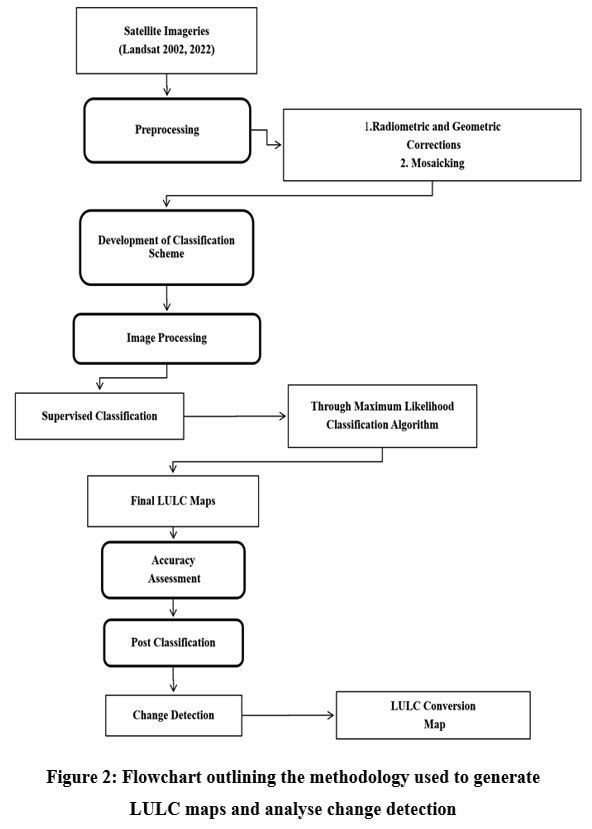 | Figure 2: Flowchart outlining the methodology used to generate LULC maps and analyse change detection.
|
For fulfilling the objective of the study undertaken, seven classes were chosen for the classification, which are: Agriculture, Barren Land, Built-Up, Forests, Pasture Land, Waterbody, Snow-Cover. After creating a classification system, the most popular image classification method, maximum likelihood classification, was utilised to map all the land use/cover classes. The pixels in the unknown class are assigned to a particular land use class where membership is most likely to occur using the maximum probability algorithm. Further, the findings obtained from the supervised classification were used to create the map layout. For getting the information about the area occupied by each class, the Field Calculator tool in ArcGIS is used.
The Accuracy Assessment for the 2022 image was achieved by using 280 GPS points from the field, 40 points for each of the class. The overall accuracy come about 84% and the kappa statistics for the same is 0.79. For 2002 image the accuracy assessment is performed by utilising points collected from Google Earth. It also includes 280 points across all the classified classes, giving an overall accuracy of 80% with kappa statistics of 0.76. The kappa score for the Land Use and Land Cover maps for 2002 and 2022 indicated a satisfactory level of agreement between the classified images and the referenced data. Change detection methodology was employed in the post-classification procedure to demonstrate the conversion within the LULC classes. Several change detection techniques, including image differencing, post classification change matrices, comparison techniques, and principal component analysis, have been developed over the past few decades.13 A transformation matrix was created using the change detection technique to show the distribution and degree of change in LULC classes. After all this, the transformation matrix was made using ArcGIS and each land cover value was examined in an Excel sheet to reveal the origin and destination of various land cover categories.
Following the analysis of the secondary data, a field survey was conducted to identify the factors influencing the LULC changes. During fieldwork, few of the drivers were comprehended through direct observation. And for detailed understanding, focused group discussions and interviews were carried out with elderly people. There was a wide range of individuals in the groups, including academicians, wage workers, farmers, and administrative officials. The primary consideration during the interview process was to choose individuals who had been living there for at least the last 30 years or more.
Results and Discussions
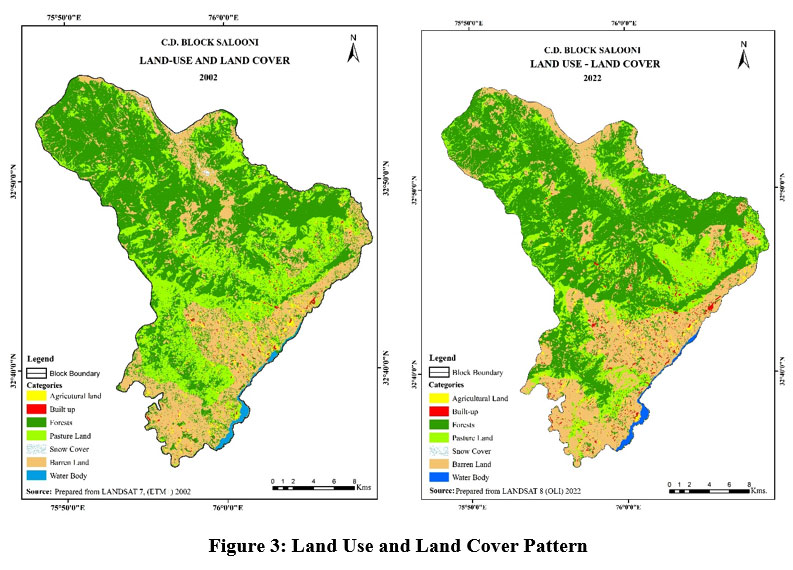
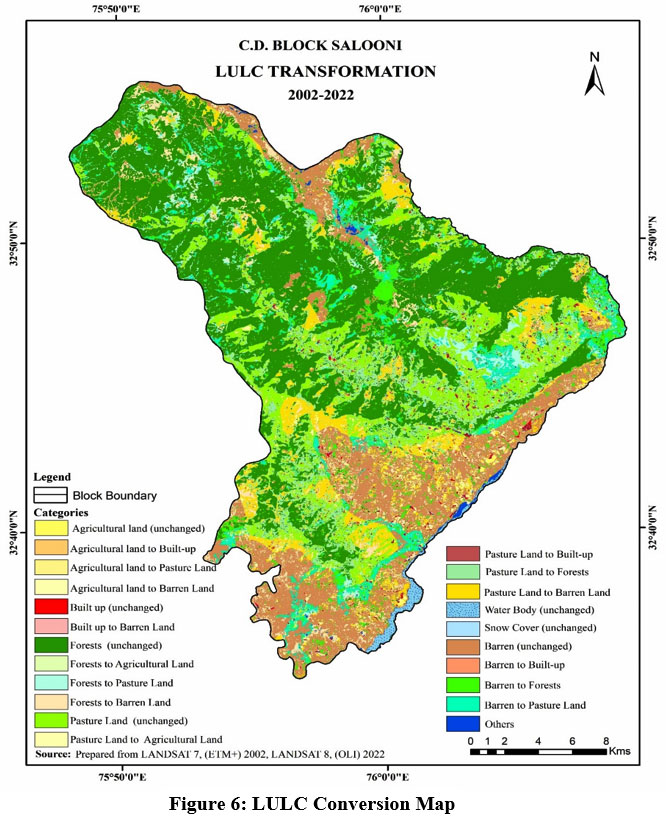
Land Use Land Cover Maps of 2002 and 2022 are presented in Fig. 3 to show the LULC pattern in study area. Further Fig. 6 shows the map of LULC transformation. And further description about the LULC pattern is provided below under different sub-headings.
Land use Cover Pattern in 2002
After the processing in ArcGIS, final LULC maps were prepared. Figure 3rd shows the land use classifications in the year 2002. According to the data, forests cover the most area, occupying a total of 271.7 km2, followed by barren land which comprises 24.8% of the entire land. Water body which includes Siul river, tributary of Ravi River comprises 3.99 km2 area. The area that has been covered under built-up throughout this time is only 3.8 km2, which amply illustrates the region's lack of infrastructure. The percentage change in population from 1991 to 2001 was only 16.2%, determined from the census data. In addition, there wasn't a lot of infrastructure advancement in the tourism sector. In terms of the total land area, agriculture only accounts for 9.1 km2 or 1.5% of the total land area. The region's rugged topography is primarily accountable for the small amount of land that is being cultivated. This can be improved by cultivating climatically appropriate crops to boost agricultural productivity and, in turn, improve people's livelihoods.
 | Figure 3: Land Use and Land Cover Pattern
|
Land use/Cover Pattern in 2022
Figure 3 provides an overall view of the land use in the recent year of 2022. Forest land covers 279 km2 area which shows that the area under forest is increased in comparison to the area in 2002. There may be multitude of reasons behind the same but it signifies a positive environmental development. It is evident from the data that built-up land has increased nearly 2.3 times since 2002. The population increase from 70,821 in 2001 to 81,556 in 2011 can be regarded as one of the reasons for the increase. As the 2021 census is yet to come, it will undoubtedly demonstrate the increase in population in these 20 years.
Table 2: Land Use and Land Cover Area.
| 2002 | 2022 | |
Sr. No. | LULC Classes | Area (km2) | Area (km2) |
1. | Agricultural Land | 9.1 (1.57) | 8.95 (1.55) |
2. | Barren Land | 143.26 (24.8) | 154.28 (26.76) |
3. | Built-Up | 3.8 (0.65) | 8.84 (1.53) |
4. | Forests | 271.74 (47.1) | 278.4 (48.29) |
5. | Pasture Land | 140.49 (24.3) | 118.55 (20.56) |
6. | Snow-cover | 0.75 (0.12) | 0.16 (0.1) |
7. | Water Body | 3.99 (0.69) | 4.06 (0.70) |
| Total | 576.5 (100) | 576.5 (100) |
Source: Landsat 7 ETM+ (2002) and Landsat 8 OLI (2022) Note: Values in parenthesis indicates area in percentage | |||
Land-Use/ Cover: Magnitude of Change
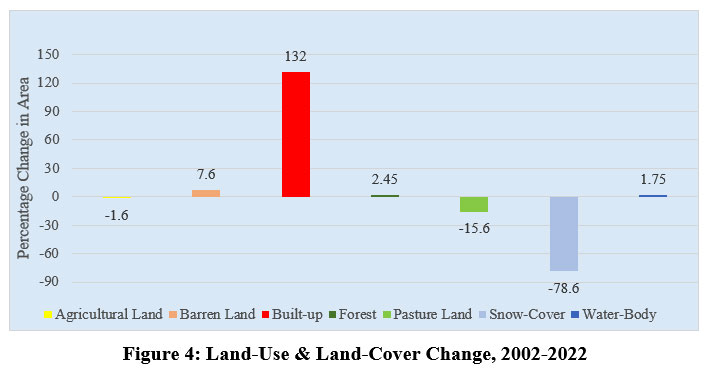
Fig 4 shows the intra class changes in Land-Use/ Land- Cover Categories throughout the course of two decades. It will help in understanding the magnitude of change in every class in this time period. As shown in figure 4 that the built-up area has significantly expanded to 132%. As is widely recognised, the strain of a growing population and rising demands has significantly accelerated the construction of infrastructure. It is noticeable that the area of the water body, forest, and barren land has increased to 1.75 percent, 2.45 percent, and 7.6% percent, respectively. The other classes of agriculture, pasture, and snow cover, on the other hand, have seen negative changes of 1.6%, -15.6%, and -78.6%. The increase and decrease in the percentage change could be caused by a wide range of factors which are further detailed below.
.jpg) | Figure 4: Land-Use and Land-Cover Change, 2002-2022
|
Land Use Change Detection
LULC maps of 2002 and 2022 are taken together to understand the changes in two decades. For understanding the changes in this time period a change matrix is made by comparing the areas covered under seven categories in both the years. The bar graphs shown in Figure 5 are reflecting the Percentage Change in LULC seven categories of landuse/cover. Forest land is taken twice. Snow cover needs to be put there.
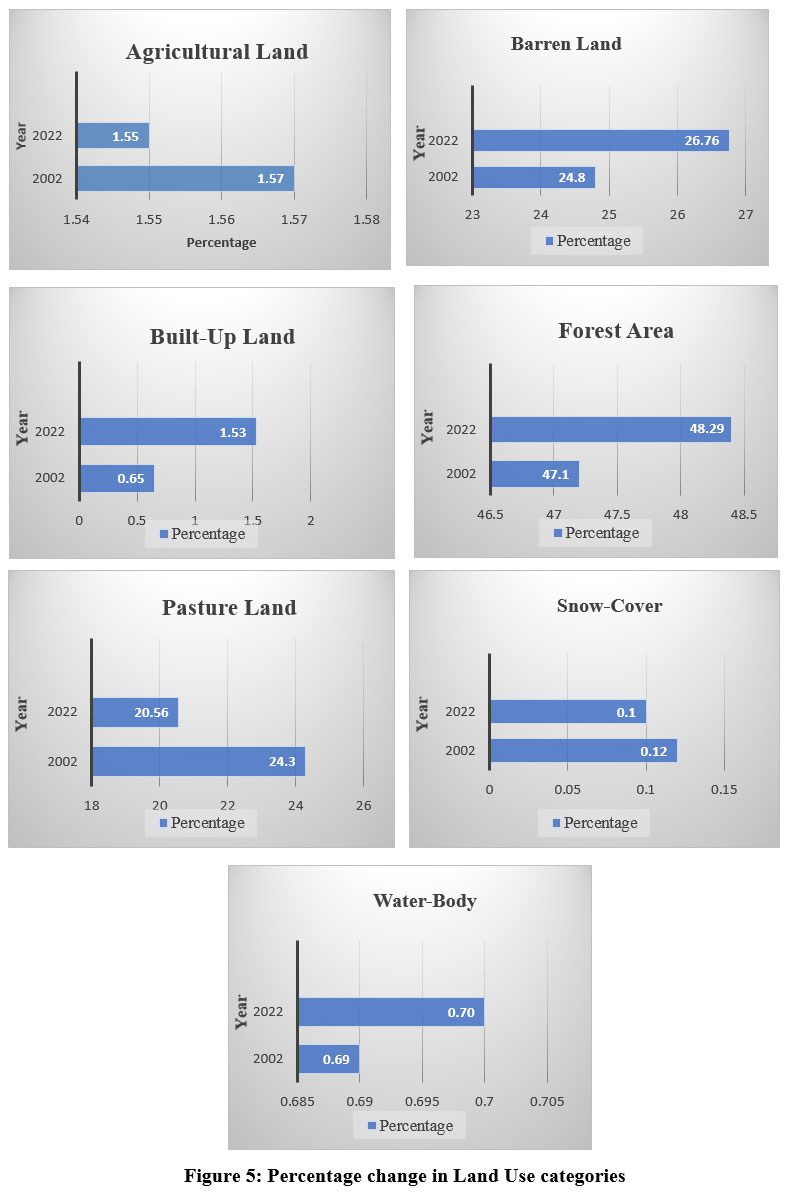 | Figure 5: Percentage change in Land Use categories.
|
Table (3) shows the transformation matrix. It shows a positive change in the forest land of almost 7km2 which can be considered as an appreciable trajectory. According to Indian States of Forest Report 2021, 14 the forest cover of whole Himachal Pradesh is 27.73% which is higher than the country’s average which is 24.62%. Therefore, it is obvious that afforestation efforts run by the government and non-governmental organisations are having a good impact in this area. Another explanation for the growth in forest land can be derived from the fact that since gas cylinders are now available to every household in villages, people are collecting lesser fuelwood, which is enabling the forest to grow at its own rate unimpeded. Since fewer people are keeping livestock in their homes, there is less need for people to gather fodder for their animals, allowing the forest to continue growing at its own pace. All these factors were found responsible for increase in forest area in the region.
 | Figure 6: LULC Conversion Map
|
When it comes to the region's agricultural activity, it has been inferred that it has decreased by 1 km2, which shows that people are engaging in other livelihood activities to generate money through a variety of prospects. It is clear from the changes in built-up land which has grown from 3.59 km2 to 8.87 km2that expanding population, rising demand, and infrastructure-related activities have all contributed to the growth. In the past 20 years, the area has seen an upsurge in tourist arrivals. As a result, there is an increased demand for hotels and other tourist-related facilities, which corresponds directly to the growth of built-up land. Likewise, when other categories like waterbody, snow cover, pasture land and wasteland has been investigated they don’t signify very extensive change. It reflects a healthy environment of the region.
Table 3: Land Use Land Cover transformation matrix (2002-2022).
Land Use Land Cover Class | Land Use Land Cover Class 2022 (Area in km2) | ||||||||
Agricultural Land | Built up | Forests | Pasture Land | Snow Cover | Water Body | Barren Land | Grand Total | ||
Land Use Class 2002 | Agricultural Land | 0.96 | 0.74 | 0.08 | 2.95 | 0 | 0 | 4.0 | 9.13 |
Built up | 0 | 2.19 | 0.25 | 0.58 | 0 | 0 | 0.75 | 3.82 | |
Forests | 1.53 | 0.76 | 213.28 | 27 | 0 | 0.17 | 29 | 271.74 | |
Pasture- Land | 3.66 | 3.03 | 38.76 | 61 | 0.01 | 0.03 | 34 | 140.49 | |
Snow-cover | 0 | 0 | 0 | 0 | 0.03 | 0 | 0.12 | 0.75 | |
Water Body | 0 | 0 | 0.085 | 0.02 | 0 | 3.48 | 0.41 | 3.99 | |
Barren Land | 2.75 | 2.12 | 26 | 27 | 0.076 | 0.38 | 85 | 143.32 | |
Grand Total | 8.95 | 8.89 | 278.4 | 118.55 | 0.16 | 4.06 | 154.28 | 576.5 | |
| Source: Landsat 7 (ETM+), Landsat 8 (OLI), USGS. | |||||||||
Land Use- Land Cover Change and its Drivers
While humans have been modifying the land for numerous years to satisfy all necessities, the extent and intensity of land use and land cover change are currently far greater than in the past. Changes in land use and land cover are being driven by these adjustments at the local, regional, and international levels. LULC changes results in global warming, soil degradation, biodiversity loss, hydrological changes, and loss of forest cover.15,16 Despite the fact that various natural phenomena like landslides, earthquakes, volcanic eruptions, and climatological events may significantly alter the planet Earth, these changes are mainly driven by human-induced activity.17 In any analysis of LULCC, authors highlighted the significance of two crucial phases. It entails first recognising the landscape change and then attributing it to a particular set of causing causes. 18 The analysis of LULC alterations, the demarcation and mapping of land covers, and the documenting of the driving forces are crucial for the management of natural resources in a sustainable way.19
Himalayas have been revered as the epicentre of human well-being since ancient times. Due to a variety of environmental, economic, and sociocultural causes, such as changes in infrastructure, agriculture, tourism, and other sectors, these regions are also experiencing changes in land use and cover. 20, 21, 22 Human related factors such as population growth.23,24 agricultural expansion25, urbanization26,27,28 and global market forces29,30 are among the known drivers of LULCC. In addition to these fundamental human-related factors, recent research has shown that LULCC is significantly driven by climate change vulnerability31,30,32,33. It is imperative to understand the consequences of land cover and land use on the local communities.34The local population, having lived in the area for a long time, is the one experiencing the changes and is therefore best suited to identify the causes of these changes.
The primary drivers leading to the LULC changes in the research area, as identified by the key informants, were broadly classified into three categories: socio-economic, environmental, and policy. To break down the socio-economic drivers include increasing population, construction of roads & dams, increasing tourism influx, changing livelihood patterns. The primary drivers behind LU/LC transition can be linked to the rising population's need for resources, which is a significant cause for concern given how the environment is changing.35 85% of respondents cited increased population pressure as the main cause of land use and land cover change. Due to the hilly terrain of the region, the slope is steep and there is less flat land available for the settlements. However, mountains are levelled to make way for structures in order to meet the wants and needs of the expanding population, which has a negative impact on the environment. While referring about the livelihood shift in the region, as the families are increasing and lands are fragmented the agricultural income is not sufficient for the survival of the family. As remarked by one of the respondents “Land is mother for me, I worship her and would love to cultivate it for my lifetime but I want my kids to study and pursue their career in academics then only they will be able to live good life”. The survey's findings suggest that people are diversifying their sources of income because they are concerned of the unpredictable nature of agriculture's return.
When examining environmental drivers, human-wildlife conflicts and climatic uncertainties have been identified as the main causes of LULC changes. The majority of respondents reported that due to rising number of monkeys and pigs in the agricultural fields people had stopped farming and the area had been left abandoned. The agricultural area is turning into wasteland as it hasn't been cultivated in years. According to the details provided by respondents, there hasn't been any apple production for the past two years due to insufficient rainfall and snowfall. Due to the fluctuating nature of the climate, December and January that require appropriate moisture remained dry, which had a major negative impact on productivity. In such circumstances people are left with no choice rather to shift to alternative livelihood options.
Moving on to the policy drivers which include Government programmes, policies and role of Non-Governmental Organisations. It is inferred that government and non-governmental organisations periodically carry out afforestation projects, resulting in the conversion of areas that were formerly wasteland into dense forests.
Conclusion
This research aims to comprehend the shifting patterns of land use and land cover in a fragile mountainous environment. With this, an effort has been made to understand how the locals are affected due to these changes. The findings show that land is under pressure from numerous human requirements and desires. However, a field survey revealed that individuals are becoming more conscious of their environment and uniting together to improve it. The positive change in forest land makes it quite evident. The majority of the population in this area depends on agriculture for their living, however the study shows that there has been a slight decline in agricultural land. Respondents claim that climatic uncertainties have forced them to alter their choice of livelihood. If this LU/LC trend persisted, it would have major negative effects on the livelihood of the local population as well as the environment and the economy. Therefore, it is crucial to take the proper actions to ensure the prudent use of natural resources and effective use of land. If locals are engaged and aware of the importance of the land, then the area will undoubtedly experience beneficial changes. Community participation can become one of the solutions to accelerating transformation.
Acknowledgement
The authors would like to thank teaching and non-teaching staff of the Department of Geography, Himachal Pradesh University, Shimla for their kind contribution. We are also thankful to all the locals who have given their valuable responses for the study to be completed.
Funding Sources
This work was supported by research grant given by UGC JRF scholarship (3264 NET/JRF 2018).
Conflict of Interest
The authors do not have any conflict of interest.
Authors’ Contribution
Dr. Sanjay Pathania’s contribution: My Supervisor has made the blueprint regarding the current research work and has guided me for the same and refined the final manuscript.
Twinkle Vaid’s contribution: I have worked on the framework decided by my supervisor and has made the graphs, maps and have interpreted and analysed the results.
Data Availability Statement
The manuscript incorporates all datasets produced or examined throughout this research study. All the data is reproduced through maps and graphs.
Ethics Approval Statement
Not Applicable
References
- Manonmani, R., Suganya, M. D., & G. Remote sensing and GIS application in change detection study in urban zone using multi temporal satellite. International Journal of Geomatics and Geosciences. 2010; 1(1), 60–65.
- Yang X. Change Detection Based on Remote Sensing Information Model and its Application on Coastal Line of Yellow River Delta. Earth Observation Research Center, Tokyo, China. 2001.
- Kumar, S., Singh, V., & Saroha, J. Interpretation of land use/land cover dynamics with the application of geospatial techniques in sarbari khad watershed of Himachal Pradesh, India. Geo Journal. 2022, https://doi.org/10.1007/s10708-022-10769-3
CrossRef - Vatsal, A., Brar, K. K., Vivek, V., & Irfan, M. Assessment of LULC changes in western himalayan mountain landscape: A case of Sainj river Valley, Himachal Pradesh (India). Current World Environment. 2023; 18(2), 775-785. https://doi.org/10.12944/cwe.18.2.26
CrossRef - Teklel K., Hedlund L. Land cover changes between 1958 and 1986 in kalu district, Southern Wello, Ethiopia, Mountain Resource Development. 2000;20 (1) 42–51
CrossRef - Asmamaw B.L., Mohammed A.A., Lulseged D.T. Land use/cover dynamics and their effects in the Gerado catchment, Northeastern Ethiopia. International Journal of Environmental Studies. 2014; 68 (6) 883–900.
- Melkania NP, Melkania U. Man and environment in Himachal Pradesh, India. In: Chadha SK (ed) Himachal Himalayas: ecology and environment. New Delhi: Today and Tomorrow’s Printers and Publishers; 1987: 81–99
- Ives, J. D., & Messerli, B. The himalayan dilemma: Reconciling development and conservatism. Population and Development Review. 1989; 15(4), 774. https://doi.org/10.2307/1972611
- Semwal, R., Nautiyal, S., Sen, K., Rana, U., Maikhuri, R., Rao, K., & Saxena, K. Patterns and ecological implications of agricultural land-use changes: A case study from central Himalaya, India. Agriculture, Ecosystems & Environment. 2004; 102(1), 81-92.
CrossRef - Negi, V., & Irfan, M. Land use/Cover mapping and change detection using remote sensing techniques: A case of upper Kullu Valley, Himachal Pradesh. Current World Environment. 2022; 17(2), 417-426. https://doi.org/10.12944/cwe.17.2.13
CrossRef - Chand, S., Brar, K. K., & Kumar, A. Land use/ cover change detection in high-altitude mountain landscapes: A case of Pangi Valley, western Himalaya (India). Current World Environment. 2022; 17(3), 743-755. https://doi.org/10.12944/cwe.17.3.21
CrossRef - Census of India 2011. Himachal Pradesh District Census Handbooks. Government of India. 2011.
- Lu, D., Mausel, P., Brondizio, E. and Moran, E. Change detection techniques. International Journal Of Remote sensing. 2004; 25(12), 2365-2401.
CrossRef - Press Information Bureau. India State of Forest Report 2021 https://static.pib.gov.in/WriteReadData/specificdocs/documents/2022/jan/doc20221207001.pdf. Published: 20 January 2022. Accessed: 23 July 2023
- Geist, H. J., & Lambin, E. F. Proximate Causes and Underlying Driving Forces of Tropical Deforestation: Tropical forests are disappearing as the result of many pressures, both local and regional, acting in various combinations in different geographical locations. BioScience. 2002; 52(2), 143–150.
CrossRef - Crutzen, P.J. The “Anthropocene”. In: Ehlers, E., Krafft, T. (eds) Earth System Science in the Anthropocene. Berlin, Heidelberg: Springer; 2006. https://doi.org/10.1007/3-540-26590-2_3
CrossRef - Harden, C.P. The human-landscape system: Challenges for geomorphologists. Physical Geography. 2014; 35(1): 76-89
CrossRef - Geist, H., McConnell, W., Lambin, E.F., Moran, E., Alves, D. & Rudel, T. Causes and trajectories of land-use/cover change. In Lambin, E.F. & Geist, H. Land-Use and Land-Cover Change: Local Process and Global Impacts. Berlin Heidelberg: Springer; 2006: 41-70
CrossRef - Katana S.J.S., Ucakuwun E.K., Munyao T.M. Detection and prediction of land cover changes in upper athi river catchment, Kenya: a strategy towards monitoring environmental changes, Greener Journal Environment Management Public Safety. 2013; 4 (2) 146–157.
CrossRef - Veith, C., & Shaw, J. Why invest in sustainable mountain development? FAO. 2011 https://www.fao.org/docrep/015/i2370e/i2370e.pdf
- NITI Aayog. A Summary Report Contributing to Sustainable Development in the Indian Himalayan Region, 2018
- Bashir, O., Bangroo, S. A., Guo, W., Meraj, G., T. Ayele, G., Naikoo, N. B., Shafai, S., Singh, P., Muslim, M., Taddese, H., Gani, I., &Rahman, S. U. Simulating spatiotemporal changes in Land Use and Land Cover of the North-Western Himalayan region using Markov Chain Analysis. Land. 2022; 11(12), 2276. https://doi.org/10.3390/land11122276
CrossRef - Geist, H., McConnell, W., Lambin, E.F., Moran, E., Alves, D. & Rudel, T. Causes and trajectories of land-use/cover change. In Land-Use and Land-Cover Change: Local Process and Global Impacts, edited by Lambin, E.F. & Geist, H. Berlin Heidelberg: Springer-Verlag. 2006 pp. 41-70
CrossRef - Meshesha, D. T., Tsunekawa, A., Tsubo, M., Ali, S. A., & Haregeweyn, N. Land-use change and its socio-environmental impact in Eastern Ethiopia’s Highland. Regional Environmental Change, 2014; 14(2), 757-768. https://doi.org/10.1007/s10113-013-0535-2
CrossRef - Mustard, J. F., Defries, R. S., Fisher, T., & Moran, E. Land-use and land-cover change pathways and impacts. Land Change Science, 2012; 411-429. https://doi.org/10.1007/978-1-4020-2562-4_24
CrossRef - D’Amour, C.B., Reitsma, F., Baiocchi, G., Barthel, S., Güneralp, B., Erb, K.H., Haberl, H., Creutzig, F. & Seto, K.C. Future urban land expansion and implications for global croplands. Proceedings of the National Academy of Sciences, 2017; 114(34): 8939-8944.
CrossRef - Wang YD, Wang T, Tsou MH, et al. Mapping dynamic urban land use patterns with crowdsourced geo-tagged social media (sina-weibo) and commercial points of interest collections in Beijing, China. Sustainability 2016; 8(11): 1202.https://doi.org/10.3390/su8111202
CrossRef - Yirsaw, E., Wu, W., Temesgen, H. & Bekele, B. Socioeconomic drivers of spatio-temporal land use/land cover changes in a rapidly urbanizing area of China, the Su-Xi-Chang Region. Applied Ecology and Environmental Research 2017; 15(4): 809-827.
CrossRef - Lambin, E. F., & Meyfroidt, P. Global land use change, economic globalization, and the looming land scarcity. Proceedings of the National Academy of Sciences, 2011; 108(9), 3465-3472. https://doi.org/10.1073/pnas.1100480108
CrossRef - Lambin, E. F., Geist, H. J., & Lepers, E. Dynamics of land-use and land-cover change in tropical regions. Annual Review of Environment and Resources, 2003; 28(1), 205-241. https://doi.org/10.1146/annurev.energy.28.050302.105459
CrossRef - Kindu, M., Schneider, T., Teketay, D., & Knoke, T. Drivers of land use/land cover changes in munessa-shashemene landscape of the south-central Highlands of Ethiopia. Environmental Monitoring and Assessment, 2015; 187(7). https://doi.org/10.1007/s10661-015-4671-7
CrossRef - Reid, R.S., Kruska, R.L., Muthui, N., Taye, A., Wotton, S.,Wilson, C.J. & Mulatu, W. Land-use and land-cover dynamics in response to changes in climatic, biological and socio-political forces: The case of southwestern Ethiopia. Landscape Ecol. 2000; 15(4): 339-355.
CrossRef - Zessner, M., Schönhart, M., Parajka, J., Trautvetter, H., Mitter, H., Kirchner, M., Hepp, G., Blaschke, A. P., Strenn, B., & Schmid, E. A novel integrated modelling framework to assess the impacts of climate and socio-economic drivers on land use and water quality. Science of The Total Environment, 2017; 579, 1137-1151. https://doi.org/10.1016/j.scitotenv.2016.11.092
CrossRef - Bahuguna YM, Rawat MSM, Juyal V, Gananarajan G. Antilithiatic effect of grains of Eleusine coracana, Saudi pharmaceutical Journal 2009; 17:182-88
- Cheruto, M. C., Kauti, M. K., Kisangau, P. D., & Kariuki, P. Assessment of land use and land cover change using GIS and remote sensing techniques: A case study of Makueni County, Kenya. Journal of Remote Sensing & GIS. 2016; 05(04). https://doi.org/10.4172/2469-4134.1000175
CrossRef


