Live Fuel Moisture Contents of Dominant Tree Species of Tropical Thorn Forest, Tamil Nadu
Johnson-Evitex Izayas
 and Muthulingam Udayakumar
*
and Muthulingam Udayakumar
*
1
Department of Plant Science,
Manonmaniam Sundaranar University,
Tirunelveli,
Tamil Nadu,
India
Copy the following to cite this article:
Udayakumar M, Evitex-Izayas J. Live Fuel Moisture Contents of Dominant Tree Species of Tropical Thorn Forest, Tamil Nadu. Curr World Environ 2024;19(1).
Copy the following to cite this URL:
Udayakumar M, Evitex-Izayas J. Live Fuel Moisture Contents of Dominant Tree Species of Tropical Thorn Forest, Tamil Nadu. Curr World Environ 2024;19(1).
Citation Manager Publish History

Introduction
Live fuel moisture content (LFMC) was defined as the water content of a leaf or shoot relative to its dry mass.1 The vegetation with high LFMC tends to have a low fire frequency, the water present in the plant tissue serves as a heat sink.2 It has been shown that the information on live fuel moisture content (LFMC) is useful for understanding the occurrence of wildland fire, fire behaviour and ecosystem health.3-5 Recently, Yebra et al. (2019)4 published a Globe-LFMC database, which comprises 1,61,717 on-field measurements from 1383 sampling points located in 11 countries. Wildfires widely occur in tropical and subtropical biomes where resources for the fire are available throughout the year, whereas wildfires are less frequent in resource-poor ecosystems such as deserts.6 The resources such as dead and live biomasses, suitable weather and climatic conditions, ignition through lightning or human activities are basic needs for a successful wildfire event.7 It has been observed that man-made fires are common during the peak dry season in Indian dry tropical forests, there are relationships between fire events and environmental factors (rainfall, temperature and relative humidity).8 The global dry tropical forests experience two to ten months of dry periods annually9, the frequency of fires is high during the dry period in which LFMC is generally low.10 Weather condition of the habitat and an array of biochemical mechanisms affect moisture and dry matter contents of plant tissue.11 Among the countries of the global south, India has been recognized as the second most vulnerable countries prone to forest fires.12 The state of Tamil Nadu has been recognized as a moderately fire-prone forest area.13 Throughout the world, forest fires damage a sum of 400 million hectares of forests annually.14 There are about 31000 forest fires occurred in India during 2018.15 Information on live fuel moisture contents of Indian plants and ecosystems are scarce, thus, the current study was intended to find LFMC of dominant tree species flourishing in tropical thorn forest ecosystem, one of the neglected ecosystems in India.
Materials and Methods
Study area
The tropical thorn forest system has been classified under the Greater Deccan-Sri Lankan forests & dry lands (IM8) bioregion (https://www.oneearth.org/ecoregions/deccan-thorn-scrub-forests/). Forests of this bioregion possess low-canopied vegetation, trees with thorns and short stature.16 Earlier, this bioregion had dry deciduous forests, due to human activities most of them have been converted into agricultural farms and low-lying scrubby vegetation.17 A sum of 4000 km2 of this bioregion have been declared as protected areas.18 The present investigation was done in a Reserve Forest (“Uthumalai Reserve Forest, URF”) located in a southern district of Tamil Nadu, namely Tirunelveli. The study area was categorised as a reserve forest by the Government of Tamil Nadu. The current study concentrated on ten dominant tree species of the tropical thorn forest ecosystem recorded by Evitex-Izayas and Udayakumar (2021)19. The ten dominant tree species constituted 94.17% of tree community, while remaining 16 species formed just 5.83%.19
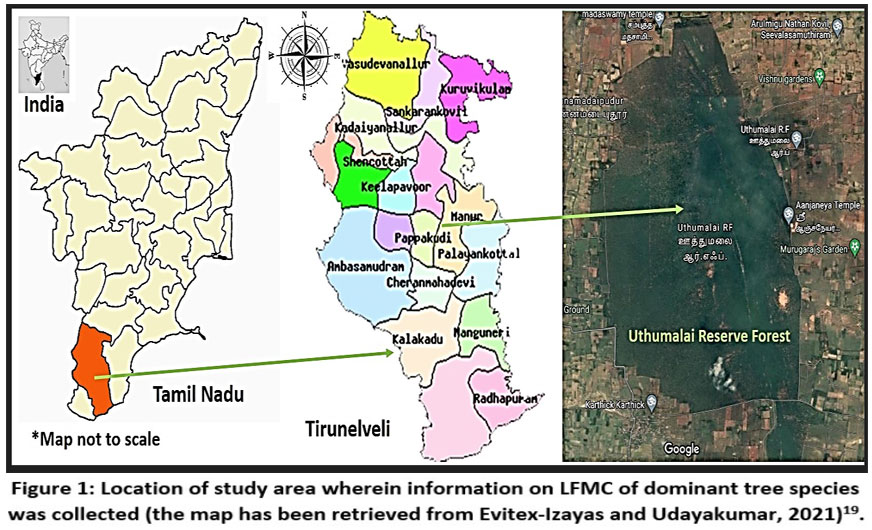 | Figure 1: Location of study area wherein information on LFMC of dominant tree species was collected (the map has been retrieved from Evitex-Izayas and Udayakumar, 2021)19.
|
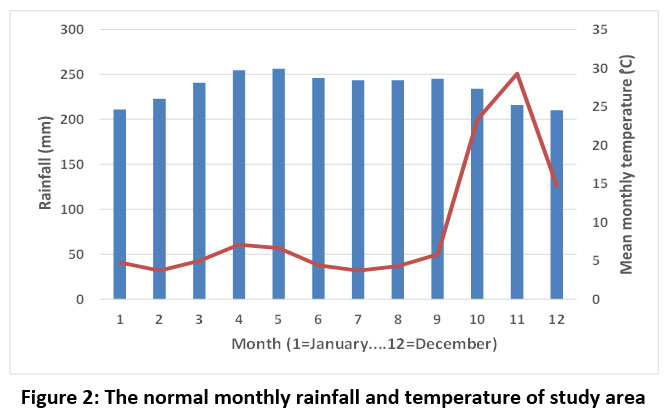
November is the wettest month in Tirunelveli (average 251 mm, average of 21 years), while the least rainfall is recorded during February and July (average 32 mm). The study area receives a sum of 968 mm annually. The mean monthly temperature was highest during May (29.9 °C), whereas the lowest mean monthly temperature was recorded in December (24.5 °C). The relative humidity was high in November (80.06%), whilst it was low in March (61.51%) (https://en.climatedata.org/asia/india/tamil-nadu/tirunelveli-2784/#climate-graph) (Figure 2).
 | Figure 2: The normal monthly rainfall and temperature of study area.
|
Field sampling
Collection of samples directly from the field and gravimetric analyses at the laboratory are considered the most direct ways for the estimation of LFMC. For each tree species, five to ten small terminal twigs (<10mm diameter) from five individuals were collected using a sharp knife. Plant samples were collected last week of every month for a year period (January to December 2021). The fresh mass of collected samples weighed in a digital balance (0.001g accuracy). Plant samples were kept in a hot-air oven at 70 °C for seventy-two hours, then the dried-out plant samples were reweighed and their dry mass noted. Finally, the LFMC was calculated as follows.

The fire behaviour of trees was recorded as per the guidelines of Pollet and Brown (2007)20. They categorized plants into seven classes based on live fuel moisture values. LFMC ranged from 181% and above exhibit very low fire behaviour; 151% to 180% show low fire behaviour; 126% to 150% with moderate fire behaviour; 101% to 125% high fire behaviour; 75% to 100% extreme fire behaviour; and, <74% advanced fire behaviour. Statistical analyses are carried out using freely available online tools (https://www.statskingdom.com/index.html).
Results
Live fuel moisture contents of trees
The mean live fuel moisture values showed that all the dominant tree species of tropical thorn forests possess high fire behaviour (LFMC values ranged from 101% to 125%) (Table 1). The LFMC values of trees varied across the months. Invariably, all the recorded species had the minimum LFMC during May (the peak summer) and maximum in November (the wettest period of the year) (Figure 3).
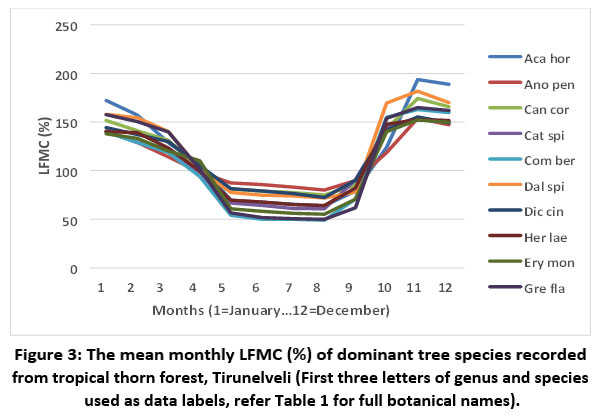 | Figure 3: The mean monthly LFMC (%) of dominant tree species recorded from tropical thorn forest, Tirunelveli (First three letters of genus and species used as data labels, refer Table 1 for full botanical names).
|
Among ten species, three had extreme fire behaviour values (75% to 100%), seven showed advanced fire behaviour values (<74%) during the peak summer. During the wettest month (November) eight species had low fire behaviour (151% to 180%), while two species, Acacia horrida and Dalbergia spinosa showed very low fire behaviour (>181%) (Table 1).
Table 1: The mean, maximum and minimum live fuel moisture contents recorded from dominant tree species of tropical thorn forest, Tirunelveli, India.
No | Botanical name (Family) | LFMC (mean±SD) | LFMC (minimum) | LFMC (maximum) |
1 | Acacia horrida (L.) Willd. (Mimosaceae) | 117.92±50.09 | 63.78 | 193.62 |
2 | Anogeissus pendula Edgew. (Combretaceae) | 110.81±26.89 | 80.19 | 153.93 |
3 | Canthium coromandelicum (Burm.f.) Alston (Rubiaceae) | 117.27±37.66 | 75.12 | 174.29 |
4 | Catunaregam spinosa (Thunb.) Tirveng. (Rubiaceae) | 106.87±37.41 | 60.89 | 154.52 |
5 | Commiphora berryi (Arn.) Engl. (Burseraceae) | 102.87±46.52 | 49.18 | 162.98 |
6 | Dalbergia spinosa Roxb. (Papilionaceae) | 120.92±44.88 | 71.84 | 181.66 |
7 | Dichrostachys cinerea (L.) Wight & Arn. (Mimosaceae) | 113.56±32.26 | 72.37 | 155.19 |
8 | Ehretia laevis Roxb. (Boraginaceae) | 108.68±37.25 | 64.28 | 152.48 |
9 | Erythroxylum monogynum Roxb. (Erythroxylaceae) | 103.72±40.18 | 55.19 | 152.25 |
10 | Grewia flavescens Juss. (Tiliaceae) | 108.62±50.52 | 50.04 | 164.85 |
Relationships among LFMC and environmental factors
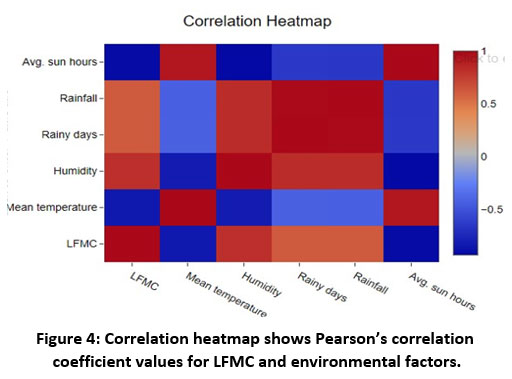
The LFMC had negative relationships with the average sun hours (r = -0.9196; p < 0.05) and mean monthly temperature (r = 0.8377; p < 0.05). On the other hand, the LFMC had positive correlations with mean monthly rainfall (r = 0.6204; p < 0.05), number of rainy days in a month (r = 0.6176; p < 0.05), and average humidity (r = -0.8163; p<0.05) (Figure 4).
.jpg) | Figure 4: Correlation heatmap shows Pearson’s correlation coefficient values for LFMC and environmental factors.
|
Discussion
The tree species had the uppermost LFMC in the wettest month and the lowermost in the peak summer. Earlier, many researchers found the same patterns across the countries and ecosystems. For instance, Nolan et al. (2022)21 noted the relationship between LFMC and seasons in Australian forests. Pellizzaro et al. (2007)22 found the patterns in a range of shrubs in Mediterranean basin. Bianchi and Defosse (2015)23 found the relationship in forest species of Andean Patagonia, Argentina.
The mean LFMC (111.10±6.15%) recorded in this study is corroborated with studies conducted across the world. The global mean LFMC was 106.07% (range 0.21% to 549.21%). Further, the global database showed that just 4.41% of the total plots had <100% mean LFMC values. Among forest types, the deciduous shrubland had the lowest mean LFMC (50.73%, range 20.27% to 129%), while mosaic herbaceous cover, tree and shrub had the highest average LFMC (141.25%, range 76% to 300%). Of 11 countries, three viz., Argentina, France and Spain had a mean LFMC <100%, whilst, eight countries viz., Australia, China, Italy, South Africa, Senegal, Tunisia, UK, USA recorded the mean LFMC as >100%.1 Further, the average LFMC was 152% for forest species in Andean Patagonia, Argentina,23 while it was <100% for USA’s shrubland species (81.75%; range, 66.59 to 137.46%).24
The tropical thorn forest had the lowest LFMC (70.56±11.28%) during the peak summer. In general, the dry seasons are suitable for the occurrence of wildfire events4. Notably, Pellizzaro et al. (2007)22 found biomasses with LFMC values of 70 to 100% had the least ignition delay with dominant shrubs of Mediterranean basin. They also found species growing in highly seasonal areas had lower ignition delay in summer and higher ignition delay in winter. Plant physiological and biochemical studies demonstrated the link between tissue water mass, dry mass and LFMC.25 Qi et al., (2014)26 demonstrated a strong link between season and LFMC in higher plants. LFMC of tree species closely associated with tissue age and phenology.27
Conclusions
Most of the dominant species in the study area had advanced fire behaviour during the peak summer and low fire behaviour during the wettest season. The LFMC had a close relationship with environmental factors viz., temperature, rainfall, humidity, sun hours and rainy days. Information on variations of LFMC of a range of plant species, ecosystems and forest types are essential for the better understanding of fire ecology and prediction of fire frequency. This study concentrated on a limited number of species, further studies with large number of species are necessary to understand the fire ecology of tropical thorn forests.
Acknowledgement
The authors are thankful to the DFO, Tirunelveli for granting the permission to carry out the study.
Conflict of Interest
The authors declare no conflict of interest
Funding Sources
The authors thank the Science and Engineering Research Board, Ministry of Science and Technology, New Delhi, Government of India for funding this study through a Core Research Grant (CRG/2019/003148).
Data Availability Statement
The manuscript incorporates all datasets produced or examined throughout this research study.
Ethics Approval Statement
This study does not involve experiments on animals or human subjects.
References
- Yebra M, Dennison P. E, Chuvieco E, Riaño D, Zylstra P, Hunt-Jr E. R, Danson F. M, Qi Y, Jurdao S. A global review of remote sensing of live fuel moisture content for fire danger assessment: Moving towards operational products. Remote Sens Environ. 2013; 136:455–468.
CrossRef - Rossa C. G, Veloso R, Fernandes P. M. A laboratory-based quantification of the effect of live fuel moisture content on fire spread rate. Int J Wildland Fire. 2016; 25(5):569–573.
CrossRef - Nolan R. H, Boer M. M, Resco de Dios V, Caccamo G, Bradstock R. A. Large-scale, dynamic transformations in fuel moisture drive wildfire activity across southeastern Australia. Geophy Res Lett. 2016; 43(9):4229–4238.
CrossRef - Yebra M, Scortechini G, Badi A, Beget M. E, Boer M. M, Bradstock R, Chuvieco E, Danson F.M, Dennison P, Resco de Dios V, Di Bella C. M. Globe-LFMC, a global plant water status database for vegetation ecophysiology and wildfire applications. Sci Data. 2019; 6(1):155.
CrossRef - Vinodkumar V, Dharssi I, Yebra M, Fox-Hughes P. Continental-scale prediction of live fuel moisture content using soil moisture information. Agric For Meteorol. 2021; 307:108503.
CrossRef - Krawchuk M. A, Moritz M. A. Constraints on global fire activity vary across a resource gradient. Ecology. 2011; 92(1):121–132.
CrossRef - Krawchuk M. A, Moritz M. A, Parisien M. A, Van Dorn J, Hayhoe K. Global pyrogeography: the current and future distribution of wildfire. PLoS ONE. 2009; 4:e5102.
CrossRef - Mondal N, Sukumar R. Characterising weather patterns associated with fire in a seasonally dry tropical forest in southern India. Int J Wildland Fire. 2014; 23(2):196– 201.
CrossRef - Murphy P. G, Lugo A. E. Ecology of tropical dry forests. Ann Rev Ecol Syst. 1986; 17(1):67–88.
CrossRef - Williams R. J, Gill A. M, Moore P. H. R. Seasonal changes in fire behaviour in a tropical savanna in northern Australia. Int J Wildland Fire. 1998; 8(4):227–239.
CrossRef - Turner N. C. (1981). Techniques and experimental approaches for the measurement of plant water status. Plant Soil. 1981; 58(1-3):339-366.
CrossRef - Reddy C. S, Bird N. G, Sreelakshmi S, Manikandan T. M, Asra M, Krishna P. H, Jha C. S, Rao P. V. N, Diwakar P. G. Identification and Characterization of Spatio-temporal Hotspots of Forest Fires in South Asia. Environ Monit Assess. 2019; 191(3):1–17.
CrossRef - Mohanty A, Mithal V. Managing Forest Fires in a Changing Climate. New Delhi: Council on Energy, Environment and Water; 2022.
- Artés T, Oom D, de Rigo D, Houston T. D, Maianti P, Libertà G, San-MiguelAyanz J. A Global Wildfire Dataset for The Analysis of Fire Regimes and Fire Behaviour. Sci Data. 2019; 6:296.
CrossRef - MoEFCC. Annual Report 2018–19. Ministry of Environment, Forest and Climate Change, New Delhi; 2019.
- McKinnon J. The Forests of Thailand; Strike Up the Ban?. In: McCaskill D. Kampe K (eds.), Development or Domestication? Indigenous Peoples of Southeast Asia. Chiang Mai: Silkworm Books; 1997:117–131.
- Rawat G. S, Babu M. M. Ecological status of forests in and around protected areas of Andhra Pradesh. A report on Andhra Pradesh (World Bank) Forestry Project. Dehradun: Wildlife Institute of India: 1995:85.
- WCMC. A global directory of tropical montane cloud forests. In: Aldrich M, Billington C, Edwards M, Laidlaw R. (eds.). Cambridge: United Kingdom: 1997:268.
- Evitex-Izayas J, Udayakumar M. 2021. Density, diversity and community composition of trees in tropical thorn forest, peninsular India. Curr Bot. 2021; 12:138–145.
CrossRef - Pollet J, Brown A. Fuel Moisture Sampling Guide; Salt Lake City, UT, USA; Bureau of Land Management, Utah State Office; 2007.
- Nolan R. H, Foster B, Griebel A, Choat B, Medlyn B. E, Yebra M, Younes N, Boer M. M. Drought-related leaf functional traits control spatial and temporal dynamics of live fuel moisture content. Agric For Meteorol, 2022; 319:108941.
CrossRef - Pellizzaro G, Duce P, Ventura A, Zara P. Seasonal variations of live moisture content and ignitability in shrubs of the Mediterranean Basin. Int J Wildland Fire. 2007; 16(5):633–641.
CrossRef - Bianchi L. O, Defossé G. E. Live fuel moisture content and leaf ignition of forest species in Andean Patagonia, Argentina. Int J Wildland Fire. 2015; 24(3):340–348.
CrossRef - Lai G, Quan X, Yebra M, He B. Model-driven estimation of closed and open shrublands live fuel moisture content. GISci Remote Sens. 2022; 59(1):1837–1856.
CrossRef - Qi Y, Jolly W. M, Dennison P. E, Kropp RC. Seasonal relationships between foliar moisture content, heat content and biochemistry of lodgepole line and big sagebrush foliage. Int J Wildland Fire. 2016; 25(5):574–578.
CrossRef - Qi Y, Dennison P. E, Jolly W. M, Kropp R. C, Brewer S. C. Spectroscopic analysis of seasonal changes in live fuel moisture content and leaf dry mass. Remote Sens Environ. 2014; 150:198–206.
CrossRef - Jolly W. M, Hadlow A. M, Huguet K. De-coupling seasonal changes in water content and dry matter to predict live conifer foliar moisture content. Int J Wildland Fire. 2014; 23(4):480–489.
CrossRef


