Mapping long-term Transformation of Wetlands and Annual Rainfall Variability in Madhubani District (1975-2022).
Sonu Kumar Das1
*
 and Manu Raj Sharma2
1
University Department of Geography,
L N Mithila University,
Darbhanga,
Bihar
India
2
University Department of Geography,
Advanced Research Centre, L N Mithila University,
Darbhanga,
Bihar
India
Copy the following to cite this article:
Das S. K, Sharma M. R. Mapping long-term Transformation of Wetlands and Annual Rainfall Variability in Madhubani District (1975-2022). Curr World Environ 2024;19(1).
Copy the following to cite this URL:
Das S. K, Sharma M. R. Mapping long-term Transformation of Wetlands and Annual Rainfall Variability in Madhubani District (1975-2022). Curr World Environ 2024;19(1).
Citation Manager Publish History

Introduction
Large tracts of marshy ground, bog, fen, or water that have developed naturally or as a result of human activity are referred to be wetlands. Wetlands contain freshwater, brackish water, saltwater, and occasionally even parts of oceanic habitats. The water may be moving or stationary. 1–3 These are intrinsic ecosystems or habitats for specific group of plants and animals where presence or absence of water and its saturation level determines their formation, processes and other characteristics. 4–8 These are of great importance to man and nature as it purifies water, reduce flood, stores water, prevents soil erosion and supports varied bio-diversities. 3,4,6,8–10 Numerous plant and animal species that are vital to the ecological system use it as a habitat. Though wetlands have numerous advantages, they are often perceived as a breeding ground for mosquitoes that transmits diseases to humans. 11 The importance of wetlands is recognized in the Millennium Ecosystem Assessment (MEA) for ecosystems and human well-being. It also serves as a contextual framework for the "wise use" concept outlined in the Ramsar Convention.12 In addition to being useful in reducing floods, 11,13,14 wetlands can serve as a reservoir for water, retaining peak runoff after significant precipitation. 15 Their dynamic character, which encompasses a range of salinities and fluctuates from stagnant to flowing water, emphasizes their adaptability, resilience, and multifunctionality in sustaining biological diversity and hierarchical ecological processes. A thorough examination of wetlands necessitates the collecting of field data on their physio-chemical characteristics as well as the application of contemporary geospatial technology to comprehend their fluvial-hydrological characteristics.
Geospatial technology development and application for wetlands health monitoring was promoted by the Ramsar Convention.16 The identification of different land cover types, such as water, natural vegetation, and soil surfaces, is made easier by multispectral sensors (MSS), which allow for data collection with spectral resolution in visible and infrared (IR) wavelengths. 17,18 Multispectral datasets like Landsat-8 and IRS MSS (LISS-III + LISS-II) are widely utilized for distinctive assessment of wetlands based on reflectivity. 2,19,20 Multispectral datasets like as Landsat-8 and Sentinel 1-2 have been thoroughly analyzed in a number of studies to investigate their potential for spectral signature-based soil, water, and vegetation differentiation. 19 According to their research, the shortwave infra-red (SWIR) bands showed segregation and were useful in certain situations, such as differentiating the shallow water class. However, the red (R) and near-infrared (NIR) bands are best suited for classifying wetlands. 21,22 Many indices were similarly developed for different purposes such as NDWI (Normalized Difference Water Index) to identify water bodies 23–25 and NDVI (Normalized Difference Vegetation Index) for vegetation 26,27 or to monitor the restoration of abandoned quarries. 2,22,28 In contrast, some research mapped the open water bodies in the study region using a ratio metric known as the "Modified Normalized Difference Water Index (MNDWI)".20,22
In both terrestrial and marine environments, wetlands function as incredibly rich and diverse ecosystems that demonstrate the interconnectedness of land and water. These regions are distinguished by complex hydro-chemical and ecological systems in a variety of land compositions that are essential to the planet's cycles of water, nitrogen, and carbon. 29–31 There are about 2493 wetlands of international significance (Ramsar Sites) on the territories of 172 countries across the world, covering about 257 million hectares (ha), which accounts for about 21% of the global wetland area. In all, 75 wetlands from this list of Ramsar sites will be located in India in 2023. According to the Ramsar sites in India (2023), 26 new sites were added in 2022. These sites include the Pallikaranai Marsh Reserve Forest & Pichavaram Mangrove, the Sakhya Sagar in Madhya Pradesh, the Karikili Bird Sanctuary in Tamil Nadu, and the Pala wetland in Mizoram. The Ramsar Sites encompass around 4.6% of the world's total land area. In India, Tamil Nadu has the most Ramsar sites—14 total. The National Wetlands Conservation Programme (NWCP) has recognized 115 wetlands regions in India, including Kusheshwarasthan (Darbhanga), Baraila Wetland (Vaishali), and Kabar Tal (Begusarai).
Table 1: Wetlands types in Bihar and Madhubani
S. No | Types of Wetlands | Significance | Bihar | Madhubani | ||
Area (ha) | Area (%) | Area (ha) | Area (%) | |||
1 | River/Stream | Controlling water flow, removing pollutants, and providing a home for a variety of aquatic animals. | 298408 | 74 | 4645 | 86.5 |
2 | Natural waterlogged | Behave like sponges, soaking up extra water when it rains a much. | 34878 | 8.7 | 135 | 2.5 |
3 |
Lakes/Ponds | aquatic species' habitats, drinking water sources, recreational opportunities, and groundwater recharge sources. | 20281 | 5 | 407 | 7.6 |
4 |
Ox-bow lakes | Hotspots for biodiversity, sedimentation, and nutrient cycling | 16172 | 4 | 159 | 3 |
5 | Others | Recreation, culture, and sequestration of carbon. | 33470 | 8.3 | 21 | 0.4 |
| Total |
| 403209 | 100 | 5367 | 100 |
Source: National Wetland Atlas of Bihar (2010)
Bihar is a hydrologically diverse state with large wetland area (estimated to be 403209 ha) accounting for 4.40 percent of total geographic area (Table 1). The most common types of wetlands in this area are rivers and streams, which make up over 74% of the total wetlands (2.98 lakh ha). These are followed by naturally occurring waterlogged areas (0.35 lakh ha), lakes and ponds (0.2 lakh ha), and oxbow lakes/cut-off meanders (0.2 lakh ha). In Bihar, inland natural wetlands make up around 92% of the overall wetland extent, with man-made wetlands making up the remaining 3.50%. 32 In Madhubani district, total wetland area is estimated to be 5367 ha, which is around 2.5 percent of total geographical area. The largest wetlands in this area include rivers or streams (4645 ha), oxbow lakes or cut-off meanders (159 ha), tanks or ponds (407 ha), and naturally waterlogged areas (135 ha). 32
Wetlands of north Bihar are mainly fed by Indian summer monsoonal rainfall brought by annual streams consisting of Adhwara group of streams, Baghmati, Kosi, Gandak and Burhi Gandak. Under the effect of decreasing annual rainfall and as a result of development activities in the region and caging of rivers through construction of embankments, these wetlands are undergoing rapid transformation to other land uses. Thus, this paper attempts to identify and assess spatial-temporal transformation of wetlands and future implications caused by their degradation in floodplain areas of Madhubani district of North Bihar.
Study Area
Madhubani district is situated between latitudes 25°59’ to 26°39’ N and longitudes 85°43’ to 86°42’ E in state Bihar in India (Map 1). It forms an international boundary with Nepal in the north, Sitamarhi district on the west, Darbhanga district on the south and Supaul district on the east. From nearly north to almost south, the ground slopes. It is drained by major rivers like Kosi, Tiljuga, Bhuthi-Balan, Kamla-Balan, Kamla and Dhauns which after originating from Nepal Himalayas flow down south into Mithila Plains.
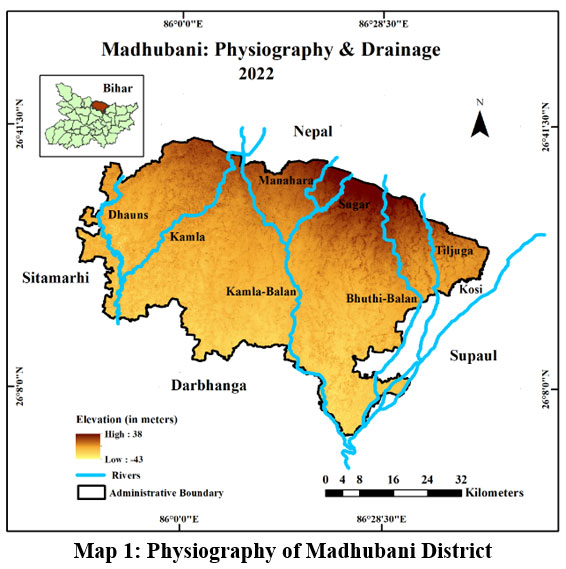 | Map 1: Physiography of Madhubani District
|
Source: Prepared by the authors
The topography of these plains consists of alluvium transported by rivers from Nepal as sediment loads. Madhubani experiences sub-tropical monsoon type climate (Cwa) due to its nearness to both Bay of Bengal and Himalayan mountains. The subtropical climate experiences great variation with temperatures ranging between 42°C during summers to significantly cold temperatures below 4°C during winters. 33 Madhubani is the rainiest district of Bihar with an annual average rainfall above 1100-1200 mm (IMD Annual Report 2021). Here both terrestrial and aquatic vegetation is found. The major aquatic plants include foxnut (Euryale ferox), water hyacinth (Eichhornia crassipes), water chestnuts (Trapa bispinosa), lotus (Nelumbo nucifera), blue water lily (Nympha eanouchali), duck lettuce (Ottelia alismoides), and water moss (Salvinia natans), etc. 34 The major terrestrial plants include bamboo (Bambusa vulgaris), rosewood (Dalberigia sissoo), mango (Mangifera indica), peepal (Ficus religiosa) etc.
The total geographical area of Madhubani district is 3501 square kilometres that supports a population of 44.8 lakhs. The density of the population is high (1282 persons per square kilometre). Out of the total population, 96.4% of population lives in rural regions while rest 3.6% lives in urban regions of the district. Here literacy level is at 58.62 percent which is fairly lower than Bihar state’s average of 61.8 percent and much lower than national average of 74.04 percent. 35
Objectives
Three objectives have been selected for this study:
To identify and map wetlands of Madhubani district on the basis of their catchment area.
To assess spatial-temporal changes in wetlands in the study area.
To study effect of rainfall variations on morphology of wetlands.
Data Sources and Methodology
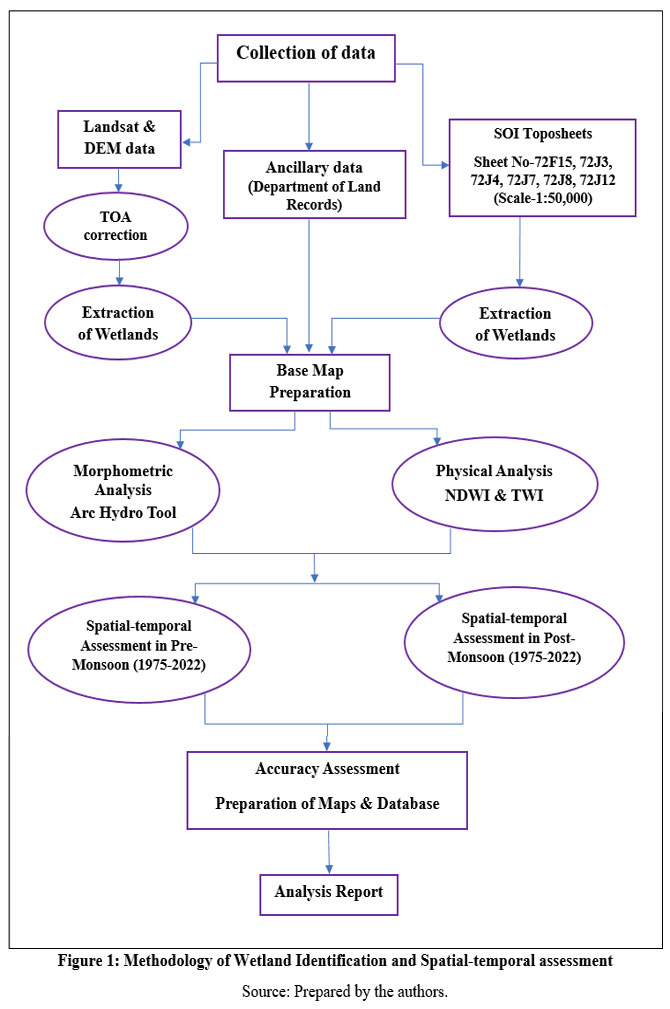
Satellites with different spectral, spatial, and temporal resolution provides huge amount of primary data on regular in which are used for wetland-based studies. 30 For the present study data from different sources such as scanned toposheets from Survey of India (SOI), satellite imageries from Landsat series and other ancillary data were collected for extraction of natural and man-made wetlands (Figure 1). Landsat data (4-9) for the period 1975 to 2022 were acquired from United States of Geological Survey (USGS). A pre-processing technique of atmospheric correction has been done on all satellite imageries to enhance their quality and remove atmospheric effects. For the classification of different wetlands, they were segregated on the basis of their catchment areas and drainage. The network of streams in the study area were generated using Arc Hydro tool in ArcGIS-Pro environment. Different steps involved in delineation of different catchment areas in Madhubani using USGS-DEM is represented with the help of flowchart (Figure 2). The Mann-Kendall test was performed to assess the significance of the long-term trend in the Madhubani rainfall data using Sen's slope estimator. 36–39
.jpg) | Figure 1: Methodology of Wetland Identification and Spatial-temporal assessment.
|
Source: Prepared by the authors.
A key component of a thorough assessment of wetlands is the morphometric analysis, which allows for the quantitative assessment of a range of physical features, including size, shape, and elevation. These features are essential for comprehending hydrological dynamics, habitat suitability, and natural landscape transformations within these complex ecosystems. The study uses two indices, the Topographic Wetness Index (TWI) and the Normalized Difference Wetness Index (NDWI), for physical analysis through the use of Arc Hydro tool and morphometric analysis for the purpose of assessing changes in wetlands over time and space (Table 2). The Topographic Wetness Index (TWI), which assesses the influence of the local slope-upslope drainage region on topography, aids in the identification of wetlands based on comparable criteria. 17,18,21,24,31,40 Because of the extensive upslope that contributes to the catchment area and the ability to collect huge volumes of water, wetlands typically occur at elevated TWI values. In the meantime, the local slope is smaller than the surrounding one, which helps retain water. Two indices utilized in this investigation are described in Table 2, along with the formulas used to calculate them.
Table 2: Indices utilization for Wetlands Assessment
Sl. No. | Indices | Description | Equations |
1 |
TWI | By using a depression-less DEM (Digital Elevation Model) without sinks, ? reflects the local upslope area draining through a specific point per net contour length. In the DEM, the steepest downslope direction corresponds to the local slope, represented by ?. |
TWI = In [ |
2 |
NDWI | The NDWI has a value between -1.0 and 1.0. Positive NDWI values are used to classify wet areas, whilst negative values are used to identify dry areas. |
NDWI= |
.png) ]
].png)
Source: Compiled by the authors.
Although the Normalized Difference Wetness Index (NDWI) is a commonly used technique for extracting water features from Landsat imagery, it occasionally contains erroneous results from built-up areas and urban structures. 23 Given that gravity and the local terrain play a crucial role in regulating surface water movement, these factors can also be used to identify wetlands based on the soil's hydraulic behaviour, flow paths, and convergence. 3,18,42–44 Accuracy assessment was performed through ground truthing and estimation of Kappa coefficient. 20,45
Six toposheets of open map series (72F/15, 72J/12, 72J/3, 72J/4, 72J/7 and 72J/8) of Madhubani district have been procured from Survey of India (SOI) to identify different types of wetlands in the study area. Old land records at block level as ancillary data have also been used to identify extent of major wetlands in Madhubani.
Results and Discussion
Hydrological profile of Wetlands (TWI)
This paper utilizes objective method of identification and assessment of changes in wetlands in Madhubani. The study also provides a discussion on rainfall variations, changing status of wetlands in Madhubani district (pre-monsoon and post-monsoon) and their transformation during the period 1975 to 2022.
The hydrological investigations help us to identify the catchment characteristics, water recharge and discharge boundaries, and water storage capacities within wetland areas. This analysis of wetlands begins with the delineation of catchment areas within the river basins. Arc Hydro tool has been used to comprehend the hydrological characteristics of Madhubani district. The process of identification of catchment areas and drainage patterns of Madhubani has been represented with the help of flow chart (Figure 2).
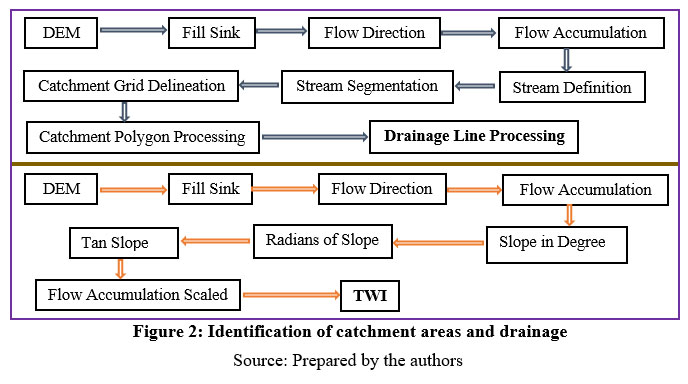 | Figure 2: Identification of catchment areas and drainage
|
Source: Prepared by the authors
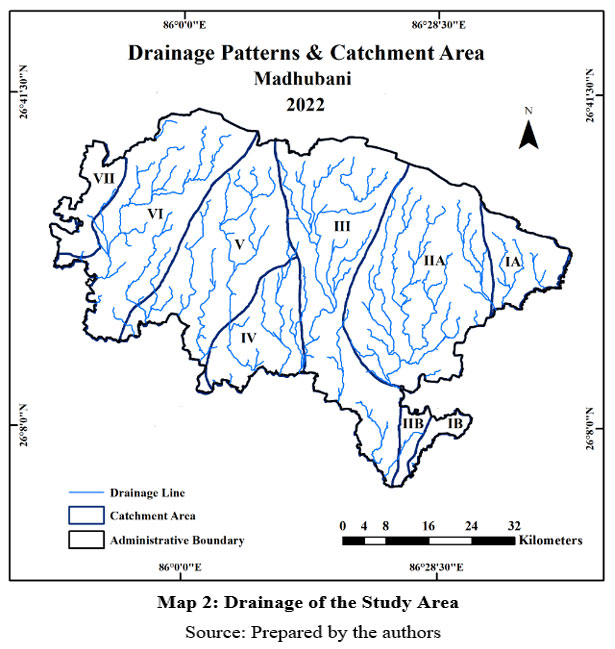
The analysis finds presence of seven major catchment areas formed by rivers Kosi, Tiljuga, Bhuthi-Balan, Kamla-Balan, Kamla and Dhauns. They are labelled using roman numerals (as I-VII) for ease of understanding. Only the slope of river Kosi in catchment area IA-IB flanks from north-east to south-west while in all other catchment it dips in north to south direction.
The analysis finds that Kamla-Balan has the largest river catchment area followed by Kosi, Tiljuga, Bhuthi-Balan, Kamla-Balan, Kamla, Dhauns and rivers of Adhawara group. Catchment area (VII) of river Dhauns is smallest in the west whereas catchment area of river Kamla (IV, V, VI) and Balan (IIA, IIB) are the largest in the east (Map 2). The Kamla River traverses the blocks of Madhepur, Rajnagar, Jaynagar, Babubarhi, Khajauli, Jhanjharpur, Lakhnaur, and Andhrathadhi. Khutauna, Phulparas, and Ghoghardiha are all traversed by Bhuthi Balan. The Adhawara group's minor rivers pass via Bisfi, Madhwapur, and Benipatti. These rivers are regarded as the district's nerve centers since they breathe life into wetlands. These rivers frequently experience severe flooding during the monsoon, which results in a significant loss of life and property.
.jpg) | Map 2: of the Study Area.
|
Source: Prepared by the authors
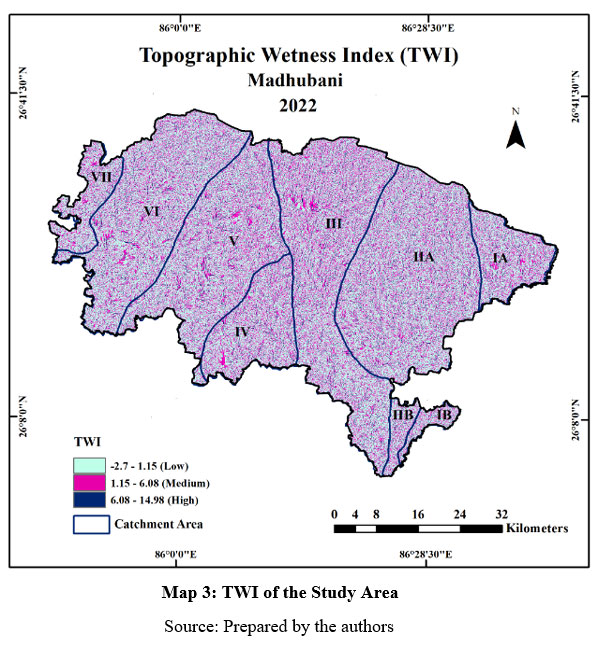
Arc Hydro Tool also helps in calculation of Topographic Wetness Index (TWI) which is a terrain-based hydrological index used to assess the wetness or moisture conditions of a region. 40 It is widely used in field of environmental studies to understand the spatial distribution of water on the land surface (Figure 2). The TWI takes into consideration of the fact that topography influences the accumulation and redistribution of water depending on the slope and upslope contributing areas of a particular region. It is also useful in modelling and assessment of soil moisture, surface runoff, and the occurrence of wetlands or areas prone to flooding. Its values are presented in a logarithmic scale, which means higher values of TWI indicate wet regions, while lower values represent dry regions. Wetlands usually have poor drainage and thus tend to have higher TWI values. 24 For the present study, the value of TWI ranged between -2.7 to 14.98 (Map 3). Heavy wetness has been found in the middle part of catchment area of river Bhuthi-Balan and Kamla-Balan (III, IV and IV) and west of river Kamla (VI) (Map 3). Lower southern catchment areas of river Kamla (VI) has higher wetness compared to its northern parts, while catchment area of river Dhauns (VII) and west of Kosi (IA-IB) display moderate level of wetness.
 | Map 3: TWI of the Study Area.
|
Source: Prepared by the authors
Overall, it was found that there is fair amount of wetness in every catchment area of Madhubani and no prominent dry areas could be found anywhere. This has been attributed to heavy monsoonal rainfall in the Terai region and resultant annual flooding that distributes water evenly across Madhubani.
Rainfall variations and changes in morphology of Wetlands:
Wetlands play an important role in biodiversity conservation, flood control, purification of water, and carbon sequestration. Understanding and monitoring of changes in wetland morphology caused due to erosion and sedimentation, subsidence, precipitation pattern and variability, and several anthropogenic factors are essential for effective conservation and management efforts. The total amount of precipitation received and its distribution has a great bearing on the spatial-temporal extent and quality of water in wetlands. Madhubani receives a fairly good amount of rainfall i.e., 1138 millimetres from southwest monsoons and western disturbances. Sen's slope estimator and the Mann Kendall trend detection test give a decent indication of the interannual precipitation behaviour and trend of rainfall. 33,37,38 During the period 1901-2022 it was found that annual total rainfall is decreasing at a significant rate (Figure 3). The precipitation patterns were recorded as highly variable on inter-annual and inter-seasonal scale.
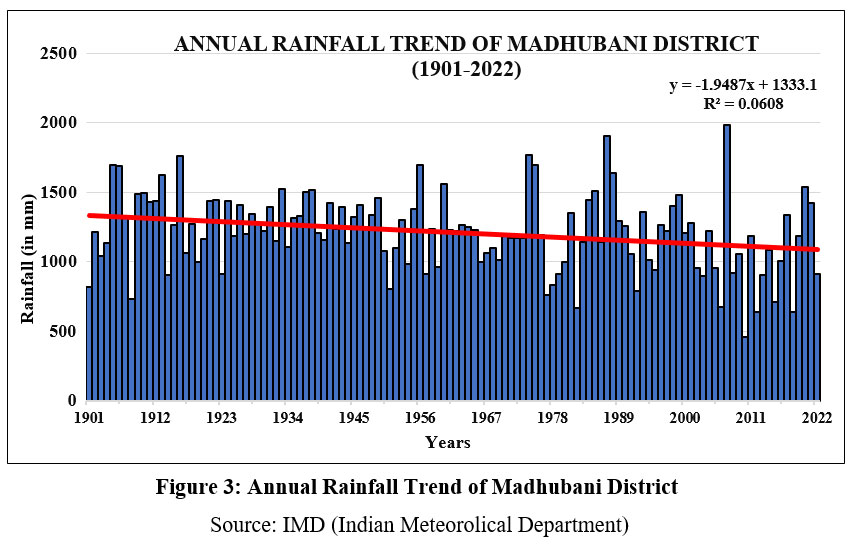 | Figure 3: Annual Rainfall Trend of Madhubani District.
|
Source: IMD (Indian Meteorolical Department)
Table 3: Annual and Seasonal Rainfall Trend in Madhubani
| Sl. No | Season | Mann Kendall Test | Sen’s slope (mm/year) | Trend |
1 | Winter | -1.52 | -0.05 | Non-Significant Decrease |
2 | Summer | -0.51 | -0.08 | Non-Significant Decrease |
3 | Monsoon | -2.91 | -2.09 | Significant Decrease |
4 | Post-Monsoon | -2.06 | -0.20 | Significant Decrease |
5. | Annual | -3.21 | -2.57 | Significant Decrease |
Source: Computed by the authors
During the study period, the annual rainfall trend has decreased at a rate of -2.57 mm/year annually. Significant decreasing rate has also been recorded for monsoons (-2.09 mm/year) and post-monsoons (-0.20 mm/year). Rainfall has also been recorded as decreasing during winters and summers but this change is non-significant (Table 3). 33 This decreasing rainfall specially during monsoons and post-monsoons will have serious implications on the areal extent, water depth, and quality of water in wetlands.
 | Map 4: Spatial Distribution of Morphological Changes in Wetlands (1975-2022)
|
Source: Prepared by the authors
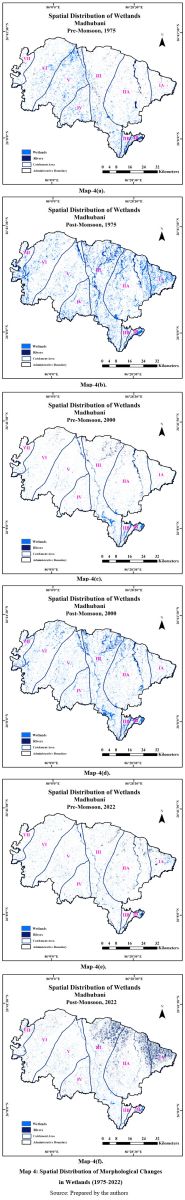
For the morphological assessment of the wetlands, a widely used technique called “unsupervised classification” has been identify and employed to classify wetlands in the study area. The classification method selects training samples with some prior knowledge obtained from topographic sheets and land records, and then classifies satellite image for identification of density and distribution of wetlands. The accuracy of the training sets was verified through Kappa Coefficient and ground truthing on field visits. The overall accuracy is 93.47% with Kappa coefficient of 0.94.
The morphological changes of wetlands in Madhubani district during pre-monsoon and post-monsoon from 1975 to 2022 has been shown in map 4. In 1975 during pre-monsoon the wetlands were found highly concentrated in the lower parts of catchment area IIB, IV and V, whereas in catchment area IA and IIA, the density of wetlands was sparse (Map 4a). The wetland extent was calculated to be about 3.6% of total geographic area (Table 4). It was found that the presence of wetland was significantly high in west of Kamla in the central and southern parts of Madhubani. During post-monsoon in 1975, high concentration of wetland has been found in the northern parts of catchment area IA, IIA and southern parts recorded as catchment areas VII, while the concentration of wetland in catchment areas V and VI was sparse (Map 4b). The wetlands distributions were high during monsoons i.e., 281 square kilometres i.e., 8% of total geographic area (Table 4).
Table. 4: Seasonal and Annual change in Wetlands.
Years | Pre-monsoon | Post-monsoon | ||
Area of Wetlands (sq. km) | Percent of Total area (%) | Area of Wetlands (sq. km) | Percent of Total area (%) | |
1975 | 126 | 3.6 | 281 | 8.0 |
2000 | 109 | 3.1 | 253 | 7.2 |
2022 | 75 | 2.1 | 224 | 6.4 |
Total Change | 51 | 1.5% | 57 | 1.6% |
Source: Computed by the authors
After two and half decades, the areal extent of wetlands was found as reduced, where it decreased to 3.1 % during pre-monsoons, and 7.2% during post-monsoons (Table 4). In the year 2000 during pre-monsoon (Map 4c), wetlands were fewer concentration in catchment areas IA and IIA where heavy concentrations were located in catchment areas IB, IIB and III of river Kamla-Balan and Bhuthi-Balan doab while it was found as sparse in all other areas. In map 4(d) during post-monsoon 2000, maximum wetland concentration was found in catchment area IIA and IIB and uniformly distributed throughout the northern parts of catchment areas III, V and VI. During the period 1975 to 2000, the main reason attributed for this transformation of wetlands is the sudden rise in anthropogenic activities, transformation of wetlands into other land uses such as agriculture and built ups along with subsequent decrease in total annual rainfall. In the recent past in the year 2022, changes in area extent of wetlands were drastic as during pre-monsoon the total geographic area reduced to 2.1% while during post-monsoon it declined to 6.4% of the total geographic area (Table 4). During pre-monsoon the spatial concentration of wetlands were significantly less in lower parts of catchment area IA and IIA (Map 4e). While during post-monsoon in 2022 the concentrations of wetlands were detected predominantly high only in the upper parts of the catchment areas IA, IIA and III (Map 4f). During the period 2000 to 2022, the areal extent of wetlands has decreased by 1.5% during both pre-monsoon and post-monsoon seasons. The transformation of wetlands resulted in emergence of large dry areas during pre-monsoon period, which could be attributed to declining trend of summer rainfall in the Madhubani district.
Hydrological changes in Wetlands:
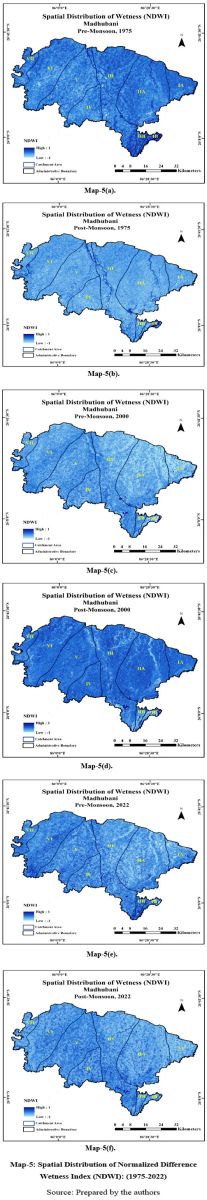
The impact of rainfall variations, urban development, and changes in land use patterns result in hydrological modifications in wetlands. Hydrological alterations within a study region are commonly evaluated by quantifying the degree of wetness present in the area. This study analysis wetness using the computation of a derived index, namely NDWI, to define the hydrological characteristics of wetlands (depicted in Maps 5a to 5f). Using satellite imagery, the Normalized Difference Water Index (NDWI) is used to identify the presence of water bodies and monitor changes in the total water content. It is particularly useful for differentiating between different land use/land cover groups, such as bare soil, vegetation, and agricultural, and water bodies. The underlying principle is that water absorbs light in the visible infrared and near-infrared (NIR) sections of the electromagnetic spectrum, while vegetation and soil reflect more light in the NIR region.
In Map 5a, a substantial number of water bodies are evident in the lower regions of catchment areas IB and IIB, whereas their presence is lesser in the centrally located catchment areas. This signifies presence of large extent of water bodies in the lower portions of the Kamla and Kosi doab. Map 5b displays more distinct water bodies in the southwest section of catchment area VI and the lower section of catchment area III during the post-monsoon period of 1975,
 | Map 5: Spatial Distribution of Normalized Difference Wetness Index (NDWI): (1975-2022)
|
Source: Prepared by the authors
with other areas exhibit a more evenly distributed presence of water bodies. During pre-monsoon (2000) map shows a heavily distributed presence of water bodies in the lower parts of catchment areas III, V, VI, and while fewer water bodies were identified in the northern regions of Madhubani (Map 5c). During the post-monsoon phase (2000), extensive coverage is observed in the lower areas of catchment area III, contrasting with a regular distribution in other catchment areas (Map 5d).
In the pre-monsoon period of 2022, large water bodies are distinct in the lower sections of catchment areas IIB and VI, whereas their presence appears sparse in the northern catchments of Madhubani (Map 5e). While during post-monsoon (2022), a considerable number of water bodies were identified in the lower parts of catchment area III, whereas fewer number of water bodies were confirmed across the remaining study area. Over the period spanning from 1975 to 2022, notable fluctuations were observed in NDWI values, with significant reductions in the presence of wetlands and an increase in extent of dry regions. Substantial changes were recorded in the lower doab of Kamla and Kosi, as well as the western and northern parts of Madhubani district where built ups structured have grown during the study period. This change is confirmed and highly correlated with the decreasing trend of annual rainfall in Madhubani district that led to land use transformation in the district.
Summary and Conclusion
The long-term hydrological investigations conducted in this study aimed to analyse various aspects of wetlands in Madhubani district, including catchment characteristics, effect of rainfall trends and variability, and urbanisation. Resulting morphological changes in the analysis included delineating catchment areas within river basins using the Arc Hydro tool. The study identified seven major rivers and their catchment areas: Kosi, Tiljuga, Balan, Kamla, and Dhauns. With Kamla-Balan having the biggest catchment area, these rivers are significant to the hydrology of the area. The study also employed the TWI to assess the wetness conditions of the landscape and explained about the distribution of water on land surface. The values of TWI ranged between -2.7 to 14.98, indicating varying wetness levels across the district. High values of TWI were found in the middle part of doab Bhuthi-Balan and Kamla-Balan and west of river Kamla while lower values of TWI were recorded in northern part of Madhubani district.
Using unsupervised classification techniques, the study identified wetlands in Madhubani district and examined their distribution during pre-monsoon and post-monsoon periods for the period 1975 to 2022. The study finds significant changes in the extent and density of wetlands, with factors such as anthropogenic activities, land use changes, and declining rainfall contributing to these transformations. The study found that during 1975-2022 wetland areas have decreased from 3.6 % to 2.1% of total geographic area in pre-monsoon season, while in post monsoon it decreased from 8.0% to 6.4% respectively. There is a decrease in annual total rainfall, especially during monsoons and post-monsoons, which has negative implications for wetland area, depth, and water quality. NDWI was used to track hydrological changes in wetlands, that highlighted reductions in the net area of water bodies and rise in area of dry regions. These changes were particularly prominent in the lower doab of Kamla and Kosi rivers, and the western and northern parts of Madhubani district.
In conclusion, this comprehensive study provided valuable insights into the hydrological characteristics and changes in wetlands within Madhubani district. It highlighted the importance of factors such as catchment areas, wetness indices, and hydrological changes which govern the state and dynamics of wetland ecosystems. The report suggests that appropriate action be taken by the state and local governments to stop further loss of the wetland area and work toward restoring it to its former level of health.
Acknowledgements
Authors acknowledge National Wetland Atlas of Bihar, 2010 (NWAB) for status of Wetland in Bihar, Survey of India online portal for toposheets and India Meteorological Department (IMD), Patna for providing latest meteorological data.
Funding sources
Senior Research Fellowship of National Testing Agency UGC scheme (JRF No. 82-44/2020 (SA-III)) was received for this work.
Conflict of Interest
The authors have not declared any conflict of interest.
Author’s Contribution
The authors confirm contribution to the paper as follows: study conception and design: 1st author (Sonu Kumar Das) and 2nd author (Manu Raj Sharma); Data collection: 1st author; analysis and interpretation of results: 2nd author; Both authors draft manuscript preparation and reviewed the results and approved the final version of the manuscript.
Data Availability Statement
In this study data from different sources such as scanned toposheets from Survey of India (SOI), satellite imageries from Landsat series and other ancillary data were collected for extraction of natural and man-made wetlands. Landsat data (4-9) for the period 1975 to 2022 were acquired from United States of Geological Survey (USGS). Annual rainfall data of the study area for the period 1901 to 2022 were acquired from Indian Meteorological Department (IMD), Patna.
Ethics approval statement
No experiments were conducted on humans or animals in this study.
References
- Balak Yadav S. Wetland environment problems and management of Bihar. ~ 81 ~ International Journal of Geography. 2020;2(2):81-83. http://www.geojournal.net/
- Salimi S, Almuktar S, Scholz M. Impact of climate change on wetland ecosystems: A critical review of experimental wetlands. Journal of Environmental Management. 2021;286. doi: 10.1016/j.jenvman.2021.112160
CrossRef - Pradeepraju N, Nagaraju D, Sudeep S. Suitable Site Selections for Artificial Recharge Structure in Bandalli Watershed. Chamaraja Nagar District, Karnataka, India Using Remote Sensing, and GIS Techniques. Current World Environment. 2022;17(3):727-742. doi:10.12944/cwe.17.3.20
CrossRef - SP Shaw CF. Wetlands of the United States: their extent and their value to waterfowl and other wildlife. Published online 1971:1-65.
- Mitsch WJ, Gosselink JG. The value of wetlands: importance of scale and landscape setting. Ecological Economics. 2000;35(1):25-33. doi:10.1016/S0921-8009(00)00165-8
CrossRef - Zoltai SC, Vitt DH. Canadian wetlands: Environmental gradients and classification. Vegetation. 1995;118(1-2):131-137. doi:10.1007/BF00045195
CrossRef - Rebelo LM, Finlayson CM, Nagabhatla N. Remote sensing and GIS for wetland inventory, mapping and change analysis. Journal of Environmental Management. 2009;90(7):2144-2153. doi: 10.1016/j.jenvman.2007.06.027
CrossRef - Cavallo C, Papa MN, Gargiulo M, Palau-Salvador G, Vezza P, Ruello G. Continuous monitoring of the flooding dynamics in the albufera wetland (Spain) by landsat-8 and sentinel-2 datasets. Remote Sensing. 2021;13(17). doi:10.3390/rs13173525
CrossRef - Berhanu M, Suryabhagavan KV, Korme T. Wetland mapping and evaluating the impacts on hydrology, using geospatial techniques: a case of Geba Watershed, Southwest Ethiopia. Geological Ecology Landscapes. 2023;7(4):293-310. doi:10.1080/24749508.2021.1953744
CrossRef - Ar. Gautami Bura. Study of Wetlands and its Importance in a City. Int J Res Anal Rev. Published online March 2024.
- Kathiresan K, Rajendran N. Coastal mangrove forests mitigated tsunami. Estuary Coast Shelf Science. 2005;65(3):601-606. doi: 10.1016/j.ecss.2005.06.022
CrossRef - Singh A S. Public Perception of Wetlands: A case study of Pallikarnai Wetlands. Electronic International Interdisciplinary Research Journal (EIIRJ) 2015; 39-48.
CrossRef - Bullock A, Acreman M. The role of wetlands in the hydrological cycle. Hydrology and Earth System Sciences. 2003;7(3):358-389. doi:10.5194/hess-7-358-2003
CrossRef - Tao W, Bays J, Meyer D, Smardon R, Levy Z. Constructed Wetlands for Treatment of Combined Sewer Overflow in the US: A Review of Design Challenges and Application Status. Water. 2014;6(11):3362-3385. doi:10.3390/w6113362
CrossRef - Khalifeh F, Abbasi M, Riyahi B. Flood monitoring using NDWI and MNDWI spectral indices: A case study of Aghqala flood-2019, Golestan Province, Iran. In: International Archives of the Photogrammetry, Remote Sensing and Spatial Information Sciences - ISPRS Archives. Vol 42; 2019:605-607. doi:10.5194/isprs-archives-XLII-4-W18-605-2019
CrossRef - Ramachandra TV, Asulabha KS, Jaishanker R. Editorial Wetlands for human well-being. Journal of Environmental Biology. 2024;45(2):i-iv. doi:10.22438/jeb/45/2/Editorial
CrossRef - Kaplan G, Avdan U. Mapping and Monitoring of Wetlands using Sentinel-2 Satellite Imagery. ISPRS Annals of the Photogrammetry, Remote Sensing and Spatial Information Sciences. Vol 4. Copernicus GmbH; 2017:271-277. doi:10.5194/isprs-annals-IV-4-W4-271-2017
CrossRef - Merwade V. Watershed and Stream Network Delineation using Arc Hydro Tools. School of Civil Engineering, Purdue University;2012.
- Amani M, Salehi B, Mahdavi S, Brisco B. Spectral analysis of wetlands using multi-source optical satellite imagery. ISPRS Journal of Photogrammetry Remote Sensing. 2018; 144:119-136. doi: 10.1016/j.isprsjprs.2018.07.005
CrossRef - Aslam A, Ahmad T, Ranjan RK. Differential responses of hydro chemical factors and LULC changes on the spatial and temporal hydro geochemistry of the eco-sensitive Baraila wetland, Bihar, India. Environmental Science and Pollution Research. 2023;30(13):39223-39245. doi:10.1007/s11356-022-25005-1
CrossRef - Pernollet CA, Guelmami A, Green AJ, et al. A comparison of wintering duck numbers among European rice production areas with contrasting flooding regimes. Biological Conservation. 2015; 186:214-224. doi: 10.1016/j.biocon.2015.03.019
CrossRef - Szabó S, Gácsi Z, Balázs B. Specific features of NDVI, NDWI and MNDWI as reflected in land cover categories. Landscape & Environment. 2016;10(3-4):194-202. doi:10.21120/le/10/3-4/13
CrossRef - McFeeters SK. The use of the Normalized Difference Water Index (NDWI) in the delineation of open water features. International Journal of Remote Sensing. 1996;17(7):1425-1432. doi:10.1080/01431169608948714
CrossRef - Bian L, Melesse AM, Leon AS, Verma V, Yin Z. A deterministic topographic wetland index based on lidar-derived DEM for delineating open-water wetlands. Water (Switzerland). 2021;13(18). doi:10.3390/w13182487
CrossRef - Laonamsai J, Julphunthong P, Saprathet T, et al. Utilizing NDWI, MNDWI, SAVI, WRI, and AWEI for Estimating Erosion and Deposition in Ping River in Thailand. Hydrology. 2023;10(3):70. doi:10.3390/hydrology10030070
CrossRef - Rousse jr, J.W. Haas, R.H. Schell, J.A. & Deering D.W. Monitoring the vernal advancement and retrogradation (green wave effect) of natural vegetation. NASA-CR. 1973;132982.
- Debanshi S, Pal S. Wetland delineation simulation and prediction in deltaic landscape. Ecological Indicators. 2020; 108:105757. doi: 10.1016/j.ecolind.2019.105757
CrossRef - Cutaia L, Massacci P, Roselli I. Analysis of Landsat 5 TM Images for Monitoring the State of Restoration of Abandoned Quarries. International Journal of Surface Mining, Reclamation & Environment. 2004;18(2):122-134. doi:10.1080/13895260412331295385
CrossRef - Paul A. Keddy. Wetland Ecology: Principles and Conservation. Cambridge University Press, Cambridge & New York; 2011; 66(1):103-104.
- Villa JA, Bernal B. Carbon sequestration in wetlands, from science to practice: An overview of the biogeochemical process, measurement methods, and policy framework. Ecological Engineer. 2018; 114:115-128. doi: 10.1016/j.ecoleng.2017.06.037
CrossRef - Tao M, Guan L, Jing Z, et al. Enhanced denitrification and power generation of municipal wastewater treatment plants (WWTPs) effluents with biomass in microbial fuel cell coupled with constructed wetland. Science of the Total Environment. 2020; 709:136159. doi: 10.1016/j.scitotenv.2019.136159
CrossRef - National Wetland Atlas of Bihar. Ministry of Environment Forestry. Published online 2010:1-240.
- Sharma MR, Priya S. Long-Term Assessment of Precipitation Behaviour in Bihar (1901-2021): Patterns, Trends and Observed Variability. 2023;18.
CrossRef - O’Hare MT, Aguiar FC, Asaeda T, et al. Plants in aquatic ecosystems: current trends and future directions. Hydrobiologia. 2018;812(1):1-11. doi:10.1007/s10750-017-3190-7
CrossRef - Census 2011. District Hand Book Census 2011 in Bihar.; 2011.
CrossRef - H. Theil. A rank-invariant method of linear and polynomial regression analysis. Proceeding of the Royal Netherlands Academy of Sciences. 1950;53(3 & 4):386-392.
CrossRef - Sen PK. Estimates of the Regression Coefficient Based on Kendall’s Tau. Journal of the American Statistical Association. 1968;63(324):1379-1389. doi:10.1080/01621459.1968.10480934
CrossRef - Kendall MG. Rank Correlation Method. Charles Griffin. 1975;4e.
- Sharma MR, Chandel VBS, Brar KK. Markers of Climate Change: Analysing Extreme Temperature Indices Over the Himalayan Mountains and Adjoining Punjab Plains. Mountain Landscapes in Transition; 2022:149-161. doi:10.1007/978-3-030-702380_2
- Beven K. Runoff Production and Flood Frequency in Catchments of Order n: An Alternative Approach. Scale Problems in Hydrology; 1986:107-131. doi:10.1007/97894-009-4678-1_6
CrossRef - Ashraf M, Nawaz R. A Comparison of Change Detection Analyses Using Different Band Algebras for Baraila Wetland with Nasa’s Multi-Temporal Landsat Dataset. Journal of Geographic Information System. 2015;07(01):1-19. doi:10.4236/jgis.2015.71001
CrossRef - Infascelli R, Faugno S, Pindozzi S, Boccia L, Merot P. Testing Different Topographic Indexes to Predict Wetlands Distribution. Procedia Environmental Sciences. 2013; 19:733-746. doi: 10.1016/j.proenv.2013.06.082
CrossRef - Bel Fekih B.S, Khebour A.F, Chaabane B. Tools and Indicators for Integrated Wetland Monitoring. Case of Hergla Wetland-Tunisia. European Academic Research; 2020. www.euacademic.org
- Alawadi WA, Raheem Zaha, Yaseen DA. Use of remote sensing techniques to assess water storage variations and flood-related inflows for the Hawizeh wetland. Environment Monitoring Assessment. 2023;195(10):1246. doi:10.1007/s10661-023-11838-x
CrossRef - Landscape M, Case A, River S. Assessment of LULC Changes in Western Himalayan Himachal Pradesh (India). Environmental Sustainability and Applications; 2023;18.


