Morphometric Analysis of Umtung River Basin using GIS and Remote Sensing
Jonestar Lyngdoh Nonglait

1
Department of Geography,
Union Christian College,
North Eastern Hills University,
Umiam Khwan,
India
Copy the following to cite this article:
Nonglait J. L. Morphometric Analysis of Umtung River Basin using GIS and Remote Sensing. Curr World Environ 2025;20(1).
Copy the following to cite this URL:
Nonglait J. L. Morphometric Analysis of Umtung River Basin using GIS and Remote Sensing. Curr World Environ 2025;20(1).
Citation Manager Publish History

Introduction
Rivers play an integral role in maintaining balance in the ecosystem and shaping the earth’s surfaces, which give rise to different types of topography, natural vegetation and climate. Because of the substantial changes in land use over the past 20 years brought about by developmental activities that negatively affect the river system’s natural cycle, basin hydrology analysis is a crucial study in which various materials, techniques and instruments are employed to comprehend the hydrological resource.1
River basin represents as one of the fundamental units of study in fluvial geomorphology.2-4 A river basin encompasses the land area bounded by a watershed, separated by the ridge point which act as a water divide where water from river and its tributaries within the watershed converges towards a central outlet. The movement of runoff water within this region is influenced by its distinctive configurations and arrangement.5 Slope, geological characteristics, geomorphic processes, and the temperature of the basin area across geological time all have a major effect on the basin's shape and pattern.6-7
“Each river is fed by numerous tributaries from different direction adjusting according to the topography of the area before joining the main trunk of the river, on the process it creates valley, make adjustment along its path”.8 For nearly 150 years, Playfair’s law was quoted without any attempt to test it quantitatively.9 Horton laid the foundation in analysis the morphometric of drainage basin which further elaborated by Strahler.10-11 Morphometry techniques entail quantifying and analysing the configuration, dimensions and features of the basin area and its landforms. These studies encompass various aspects such as area elevation, morphology, size, slope and the outlines of watersheds.12-13 From the different calculated drainage elements, that involve stream ordering, basin area, basin perimeter, stream length of drainage channels, texture ratio, drainage density, bifurcation ratio, stream frequency, basin relief, relief ratio, ruggedness number, etc. 14–16, morphometric analysis could be assessed and examined.17
GIS tools have been further reinforced and made more effective in the computation of various hydro morphometric parameters by the development of remote sensing technology and the simple and free access to high-quality data resources, such as the Digital Elevation Model (DEM). 7,12,16, 18-21
With most of the river flowing in area where there are lots of anthropogenic activities, shrinking of river are contributed mainly by deforestation, expansion of agricultural activities and climate change, therefore, it is important to understand the river morphology, which give us a much-needed data for watershed and river catchment planning programme.
Study Area
The Umtung river basin is located in the State of Meghalaya, India, at latitude 920 3' 36.36'' N and longitude 250 39' 42.12'' E. It spans three districts: Ri-Bhoi, East Khasi Hills, and Jaintia Hills. The river travels 0.05 km in the Jaintia Hills, 9.65 km in the East Khasi Hills, and 25.01 km in Ri-Bhoi. The drainage basin is 224.91 km² in size. The river is bounded to the north by Umiam river and to the south by the Umkhen river. The major tributaries of the Umtung River are Umket, Wahkut, Umsarang, Umlew, UmSo, and Klew. The river flows in the northeast direction and later joins the river Umkhen, passing through Jaintia Hills before eventually entering the State of Assam.
Materials and Methods
The broad methodology adopted to achieve the objectives includes several steps. Remotely sensed DEM is downloaded from Bhuban NRSC, Open-source satellite imagery, Cartosat-1 with 30 M DEM resolution. The geospatial tool in QGIS software version 3.16 is employed to generate basin areas and extract stream networks from the DEM file. To understand the basin hydrology, morphometric techniques are used to calculate, evaluate, and analyse the different drainage basin aspects using geoprocessing tools (ArcMap 10.8).
Using the Horton (1945) method6 for basin length, stream length, mean stream length, stream length ratio, basin perimeter, drainage density, stream frequency, texture ratio, form factors, and length of overflow, and Strahler (1964)2 for the hierarchical method of stream ordering, a number of parameters were measured. Bifurcation ratio, sinuosity index, elongation ratio, constant channel maintenance, basin relief, relief ratio, and ruggedness number (Rn) were all calculated using Schumm's (1956) method30. The circulatory ratio was calculated using Miller's (1953)4 technique. The outcomes are provided in Tables 1, 2, and 3.)
Results
Table 1: linear morphometry morphometric parameters of Umtung river drainage basin
Linear Parameters | Results |
Order | 1-5 |
Number | 255 |
Total stream length (km) | 302.73 |
Mean stream length (km) | |
Mean length of first order stream (L'1) | 0.75 |
Mean length of second order stream (L'2) | 1.61 |
Mean length of third order stream (L'3) | 5.78 |
Mean length of fourth order stream (L'4) | 9.75 |
Mean length of fifth order stream (L'5) | 12.23 |
Bifurcation ratio (Rb) | 4.03 |
Stream length ratio (rl) | 2.17 |
Sinuosity Index (Si) | 1.32 |
Table 2: Basin and areal morphometric parameters of Umtung river drainage basin.
Areal aspects of the basin | Results |
Area (A) | 224.91 km2 |
Length (lb) | 24.32 Km |
Perimeter (P) | 147.04 Km |
Drainage density (De) | 1.34 per/ km2 |
Stream frequency (Fs) | 1.13 per/ km2 |
Texture ratio (Dt) | 1.73 |
Form factor (Rf) | 0.38 |
Elongation ratio (Re) | 0.39 |
Circulatory ratio (Rc) | 0.13 |
Length of overland flow (Lg) | 0.67 |
Constant channel maintenance(C) | 0.75 |
Table 3 Relief Aspect
Relief aspect parameters | Results |
Basin relief (R) | 872 |
Relief ratio (Rr) | 35.85 |
Ruggedness number (Rn) | 1.18 |
Discussion
Analysis of morphometric parameters is done by quantifying different morphometric data which help us to understand the relationship between landforms evolution, it types and drainage characteristics.22 The study relied heavily on geo-spatial data, however there are certain limitation with lack of ground truth verification, particularly in identifying the types of rock formation, soil types, vegetation and their classification. These gaps in data verification may affect the accuracy of the hydrological analysis, as such factors play a critical role in understanding water flow, infiltration rates and overall watershed dynamics in the Umtung Basin
Linear Aspect
The one-dimensional features of the drainage network that involve the mean stream length, bifurcation ratio, stream length ratio, stream length, and hierarchical order of streams are studied by the linear aspect.
Stream Ordering
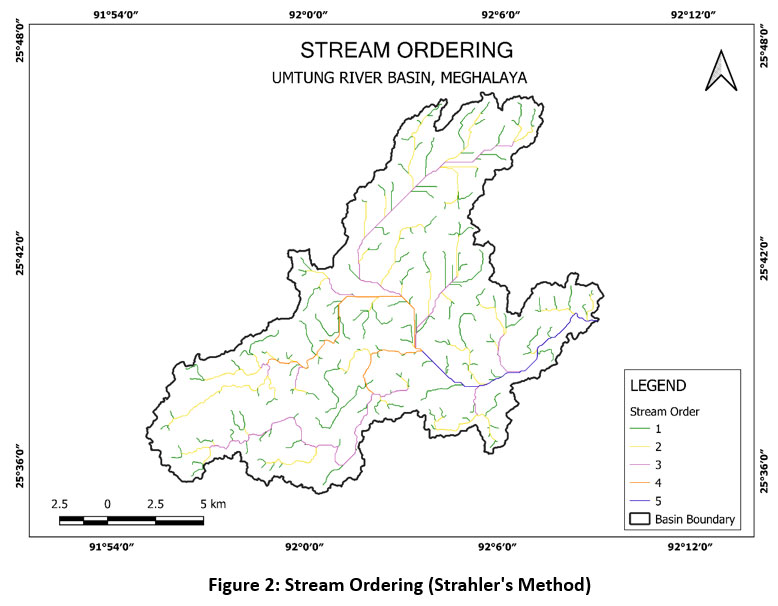
To understand how stable the river in the watershed is, Strahler stream ordering was used which is the most common and widely accepted method which shows a slightly modified way of stream ordering from Horton (1945) where, “all fingertip affluents are regarded as first order and when two first order tributaries confluent forming the second order stream”,2, 23-25 the same concept was later devised by Milton and Ollier (1965).26 The Observation from Table 1 indicated that the river has up to 5th order of stream (Figure 2). There are 195, 49, 08, 02 and 01 number of streams for 1st, 2nd, 3rd, 4th and 5th order respectively, a total number of 255 streams. First order makes up 76.50 percent, second order 19.21 percent, third order 3.13 percent, fourth order 0.78 percent and fifth order 0.39 percent respectively.
Stream numbers
As per Horton’s law the relation of stream ordering and stream number shows approximately an inverse geometric series implies “that the stream number declines exponentially as the stream order increase .6, 24, 27,31 There are 255 streams in all. With an elevation in stream order, Table 1 displays a deviation and fewer streams. The best fit model to describe the relationship between stream order and number” is shown in Figure 1 with R2 = 0.6883.
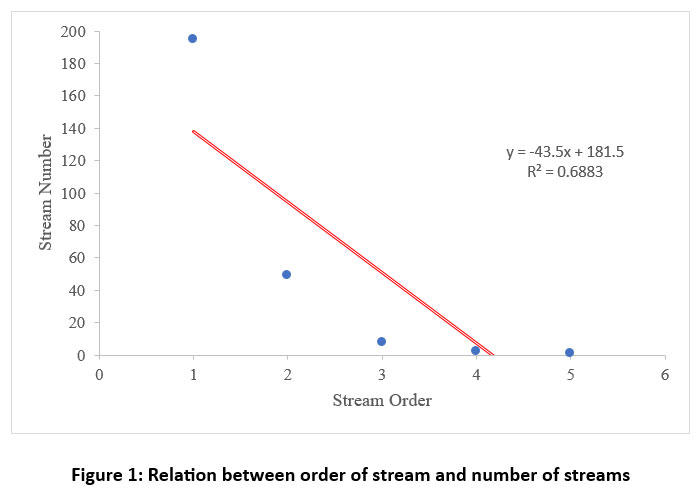 | Figure 1: Relation between order of stream and number of streams
|
 |
|
Stream Length (lu)
Using Horton’s Law of stream length (lu), the basin obtained a lu value of 302.73 km (Table 1) which do not form a perfect geometric series. The diagram from (Figure 3) indicates a strong relationship with R2= 0.9007 between length of stream and ordering or stream, where higher the order its length decreases. First order has the longest stream and as the order increases their length increases. Length of stream across different orders indicates erosion and combined influence of geologic and slope on an area.6,31 Longer streams typically suggest flatter terrain and more resistant lithological compositions. Conversely, shorter streams indicate steeper slopes and less resistant lithology.
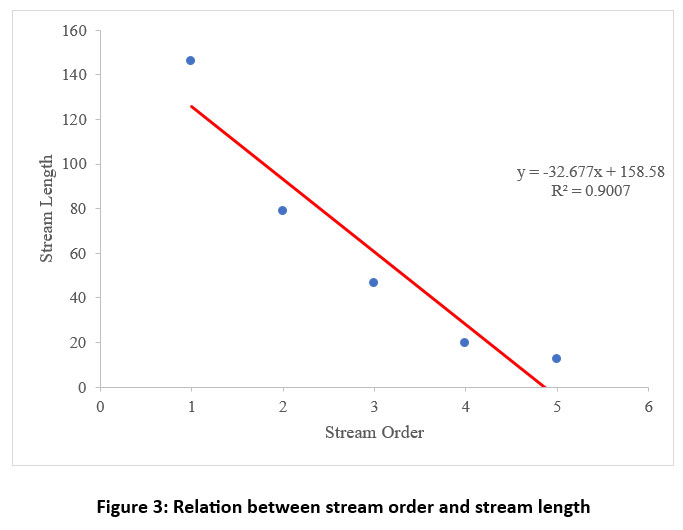 | Figure 3: Relation between stream order and stream length
|
Mean stream length (L')
Toward understanding the dimension, physical structure of the drainage network and its capacity to grow as more tributaries join the main channels in the network, L' is calculated using Horton’s (1945)6 formula. Strahler (1964) characterised mean stream length as an important property of a surface drainage network system. It is observed from Table 1 that there is an increase from 0.75 km in the 1st order to 12.23 km in the 5th order, whereas the value between 1st and 2nd order are close and there is a big gap between 2nd to 4th and 5th order. Higher slope within the first and second order stream are the reason for smaller length of stream.31
Stream length ratio (rl)
“rl tends to be uniform throughout the sequence order” (Horton 1945)6. The length ratio (Table 2) of rl 2nd/1st (2.15), rl 3rd/2nd (3.59), rl 4th/3rd (1.69) and rl 4th & 5th (1.26), with a rl of 2.17. The results suggest that with the gradual increase of 3.59 in 3rd and 2nd order and a slower decrease to 1.69 and 1.26 in the 4th and 5th order shows that the watershed has moderate slope, moderate erosion and mature landscape. These changes are also due to the differences in slope and topographic.28
Bifurcation ratio (Rb)
It is the ratio of total stream number of the given order to its next lower order.6,25,29-30 According to Strahler (1964) range of bifurcation ratio4, Rb values (Table 1) ranging from 2 (4th/5th) to 6.13 (2nd/3rd), this shows a moderate to high complexity especially in the higher order stream segments, suggesting a well-developed, dissected and interconnected drainage network with numerous tributaries. According to R.E Horton 1945 classification of Rb values,6 Umtung basin have a mean Rb (4.03) which revealed that it is situated in the mountainous area. These variation in ratios revealed that the rivers respond differently to geological structure and climatic conditions. In regions with a high bifurcation ratio such as mountainous or highly dissected areas with steep terrain and numerous tributaries, the river system may efficiently drain excess water during heavy rainfall which can reduce the risk of flood.
Sinuosity Index
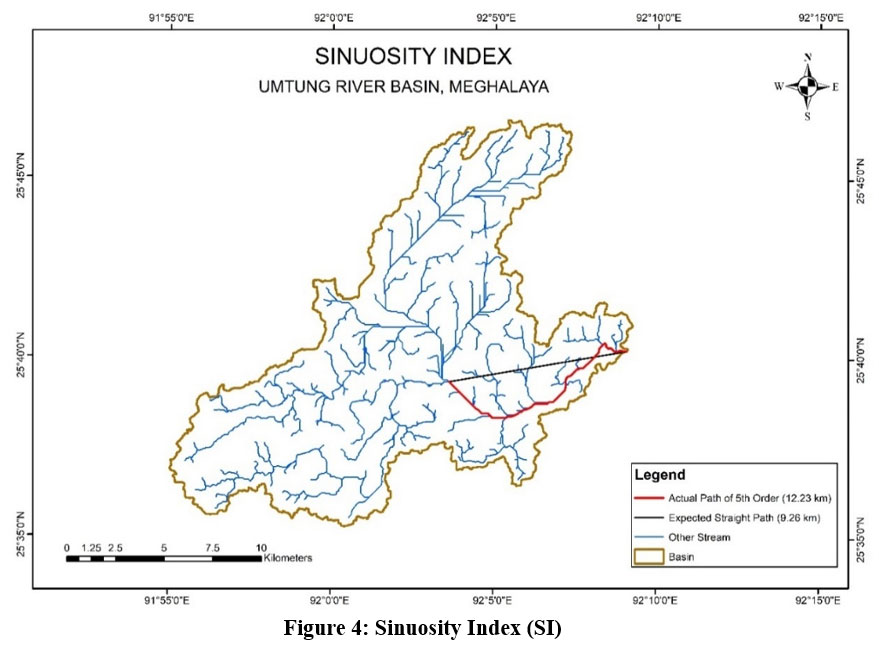
Leopold and Wolman claim that these three types of river networks—straight, sinuous, and meandering—are based on the sinuosity index.32 S.A. Schumm defines channel sinuosity as a means to find out how much the river shifts from its original course than the expected path and length from the source to mouth. The sinuosity of a straight stream is 1.0, and it increases as the stream deviates from a straight path.30. Sinuosity index (SI) of 1.32 indicate a moderately sinuous channel which deviates from a straight-line path by 32% Table 1 & Figure 4 suggesting some degree of curvature and slightly meandering stream with few variations in flow velocity and sediment transport, typical of gentle slope and mature landscape complementing the results of stream length ratio.
 |
|
Areal aspect
Drainage density (De)
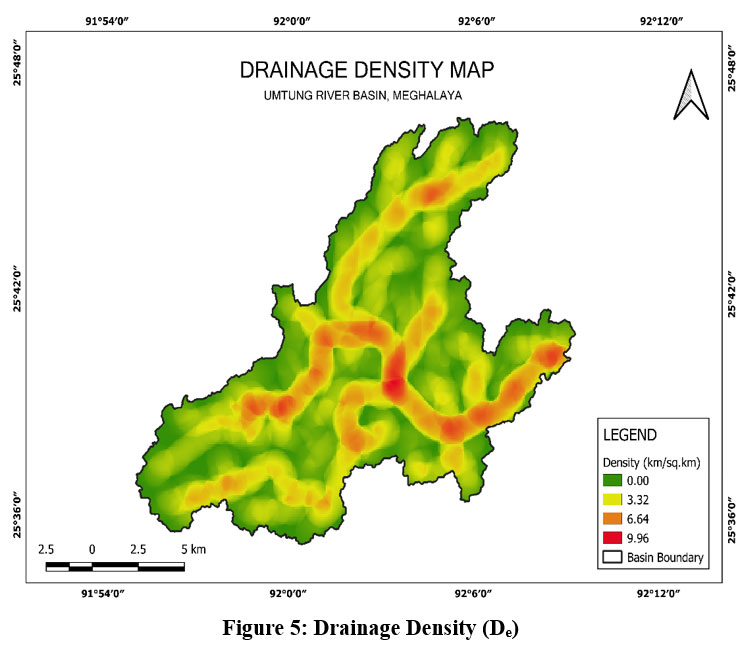
It is an important evaluation in understanding the geologic structure of an area in relation of how well-drained and poorly drained, which in turn affect the permeability and infiltration capacity, Horton suggested that there are several factors controlling drainage density. 6, 31-32 The results reveal a low De of 1.34 km/km2, as the stream is widely spaced having gentle slope, good infiltration and high vegetation covers.25 However, the drainage density in the basin is not consistent within the range of class from 0 to 9.96 km/km2 (Figure 5), where maximum area is within 3.32 km/km2, there are area within the drainage basin which have a moderate density and high density. This shows the influence of lithology on the drainage density of the basin.31 Higher density increases runoff and high risk of flood during heavy rainfall which occur mostly on the main branch and higher order of stream.
 |
|
Texture ratio (Dt)
Dt is calculated as the ratio of the basin's circumference to the total length of all streams from each order. Climate, precipitation, rock composition, topography and stage of development are important factors that control the texture ratio where basin infiltration stand as the single most significant factor controlling texture.6 The basin has a very coarse texture of 1.73 (Table 2) indicating a stable hydrological system with moderately infiltration capacity which is not too fast and not too slow in accordance with Horton about the positive relationship between density, frequency and texture.31
 |
|
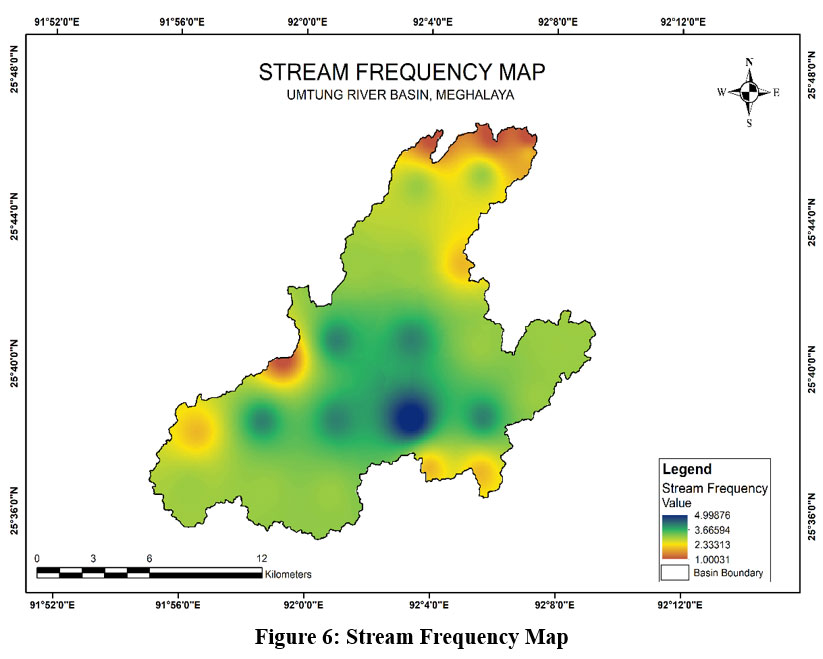
Stream frequency (Fs)
Regardless of order divided by the area, it is based on the number of streams per unit area. 33 Fs is mostly controlled by several natural factors such as topography, geology, soil permeability and vegetation but it may not be directly dependent to drainage density.6,33 Umtung drainage basin has a moderate to low Fs 1.13 stream/km2 (Table 2 & Figure 6) which indicated permeability, runoff and gentle sloping. There is a variation of stream frequency in the drainage basin which varies from moderate to low. Figure 7 show that a density and frequency data are positively correlated where all variability in frequency can be explained with linear relationship with density.
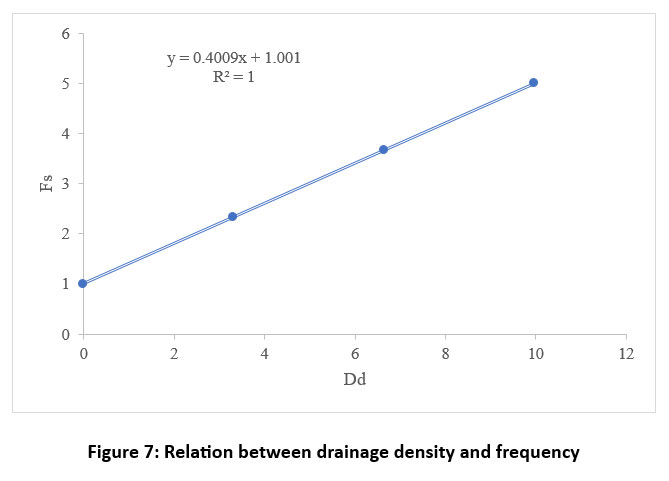 | Figure 7: Relation between drainage density and frequency
|
Form factor (Rf)
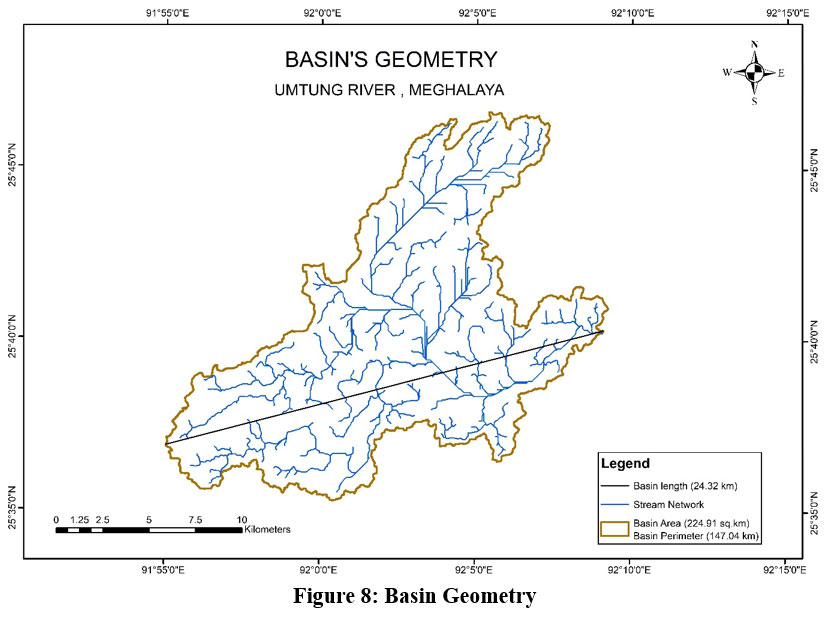
As per Horton (1932), form factor is the ratio of the drainage basin's width to length, which is determined by Rf=A/(lb)².33 Form factor value of 1 indicate basin shape which are round and circular, elongated have values of 0 to less than. This basin has a value of 0.38 (Table 2) indicating an elongated shape and low peak flows for longer duration34 as depicted in Figure 8. Elongated form basin has a more stable and predictable flow pattern which is more manageable flood management and soil conservation.
Elongation ratio (Re)
The Re is utilized for interpreting the drainage basin's form. The diameter of a circle with the same area as the basin and the basin's longest length are employed to compute this ratio29. Elongation and shape range35 classify <0.5 as more elongated, “elongated between 0.5 and 0.7, Less elongated between 0.7 and 0.8, Oval between 0.8 and 0.9, and circular between 0.9 and 0.1. A” small drainage basin with a length greater than its breadth and a quicker rate of water discharge during periods of heavy rainfall that impact erosion is indicated by the elongated ratio of 0.39 (Table 2).
Circulatory ratio (Rc)
Miller “(1953) employed circularity, which is impacted by the lithological features of the watershed, to compare the surface area of the watershed to the size of a circle with the same perimeter as the watershed. The Rc value of the basin is 0.13 (Table 2) which according to Miller’s classification refer to a dendritic pattern that is common in regions which has gentle slopes and also implies that the basin is at the initial stage of development1
 |
|
Length of overland flow (Lg)
According to Horton, Lg is the amount of time that water flows over the ground before its accumulation into distinct stream channels.6 One important independent variable that has a big impact on drainage basins' hydrological and physiographic evolution is Lg6. This basin's Lg value is 0.67 (Table 2), indicating that 0.67 kilometers must pass before the precipitation enters the main canal. More surface runoff enters the stream when the overland flow is shorter.36
Constant channel maintenance (CCM)
To measure watershed erodibility Schumm Constant of channel maintenance is used to find out area in the watershed or drainage basin to support and maintain a certain length of river or stream.29 The property utilized to define overland flow is CCM, which is the inverse of drainage density.29 The CCM value of 0.75 suggests a gradual infiltration, permeability of the materials, lower surface runoff, and fairly good vegetal cover.36
Relief aspect
Basin relief (R)
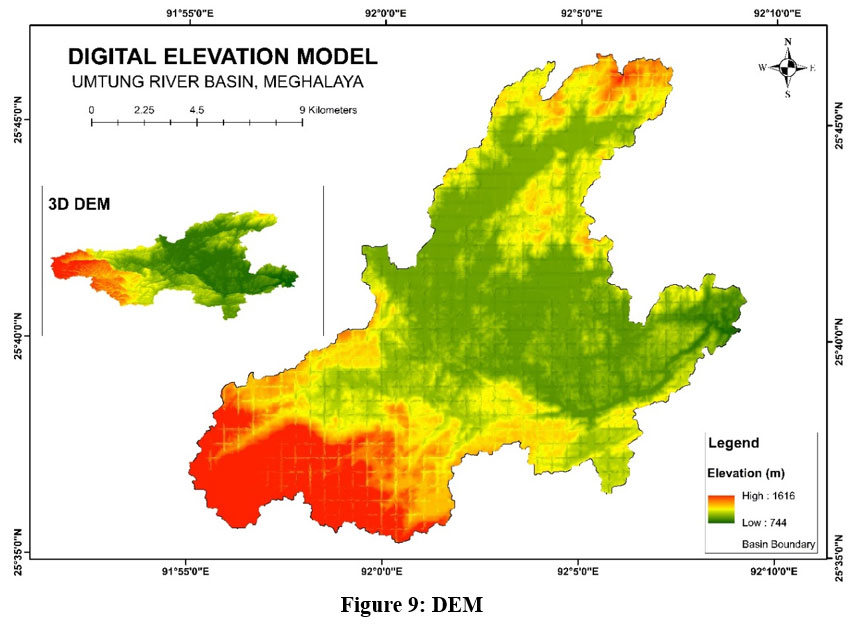
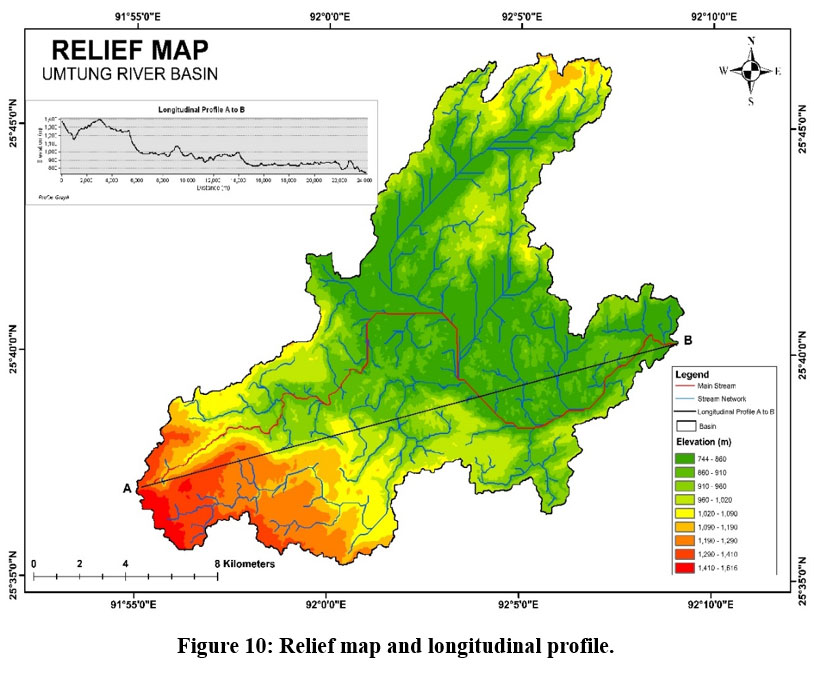
Understanding the basin's hydrological morphology, which is influenced by the land's structure, composition, and drainage properties, requires an understanding of its relief. The findings will have an impact on the river basin's erosional phases.36 The R and H (Figure 9, 10) values are 1616 and 744, respectively, where the R is 872 (Table 3). The basin represents high relief, indicating youthful stage in the evolution of the river with pronounced variations in elevation within the basin and at the early stage in the cycle of erosion as per the W M Davis 1899, affected by differential erosion.
Relief ratio (Rr)
A dimensionless ratio called the relief ratio provides a useful evaluation of the watershed's gradient characteristics by comparing the height of the basin to its length. 29. It displays the drainage basin's overall slope and associated deterioration processes29. The Rr value is 35.85 (Table 3), showing low ratio, which suggests a basin with gentle slope and relatively uniform terrain, where the difference in elevation is not pronounced compared to its horizontal extent.
Ruggedness number (Rn)
The Rn, which can be expressed in kilometers, can be computed by multiplying the drainage density by the basin elevation.29. It incorporates both the length and gradient of slope; when slope is both long as well as steep, the values are higher4. Higher Rn values (> 1) (Table 4) indicate more elongated basins with steeper slopes, enhancing erosional forces due to increased water flow velocity.
 |
|
Hypsometric Curve
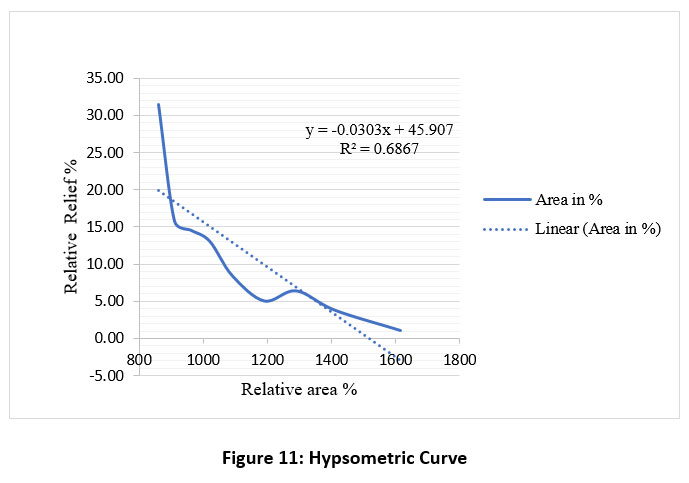
The hypsometric curve (Figure 11) indicates a mature landscape with concave slope characterized by valleys or basins at lower elevations and hilly or plateau terrain at higher elevations, where erosion and tectonic forces have shaped the topography over geological time scales. R2=0.6867 (Figure 11) suggest a reasonably good fit linear model, as elevation increases, the percentage of total area below that elevation decreases. The future landscape may experience increased erosion in lower elevations, more frequent flooding and sediment accumulation in rivers. Higher elevations may erode or flatten over time and vegetation could shift towards species suited for wetter, lowland conditions.
 |
|
 | Figure 11: Hypsometric Curve
|
Conclusion
The study of the Umtung River drainage basin reveals a well-structured, moderately complex watershed with distinct geomorphological and hydrological characteristics. The basin features a stream network that reaches up to the 5th order, with a significant dominance of 1st-order streams. As stream order increases, stream length and mean stream length decrease, suggesting a mature landscape with moderate slope and erosion. The basin's shifting drainage patterns and increasing network complexity as tributaries merge into main channels are shown by the examination of mean stream length, length ratios, and bifurcation ratios. The basin's moderate stream frequency (1.13 streams/km2) and low drainage density (1.34km/km2) indicate healthy plant cover and soil permeability, which support steady runoff and infiltration processes.
Morphologically, the basin is elongated with a form factor of 0.38, which allows for more predictable hydrological behaviour and longer flow durations, which allow better flood management, soil conservation and ecosystem development. The low circulatory ratio (0.13) points to a dendritic drainage pattern, typical of areas with gentle slopes. The basin’s high relief (872 meters) and youthful erosional stage are reflected in its ruggedness number (1.18) and relief ratio (35.85), though the relatively gentle terrain suggests slow erosion and uniform development. The hypsometric curve is concave and reveals another evidence of a landforms with varying heights and continuous erosion.
The Umtung River drainage basin study reveals a stable hydrological system with low flood risks, moderate erosion rates and good vegetation cover, making it suitable for sustainable land and water management. Its predictable hydrological behaviour, low circulatory ratio and stable runoff suggest effective flood management and water resource development for agriculture and irrigation. The basin’s balanced ecosystem offers opportunities for conservation, while its gentle slopes and mature topography support infrastructure planning with minimal environmental impact. Overall, the basin is well-positioned for sustainable soil conservation, ecosystem preservation and long-term development.
Acknowledgement
The author acknowledges the Principal of UCC, Umiam Khwan, Meghalaya, India for providing infrastructural & financial support through the In-House Minor Research Project.
Funding Sources
The author received funding from Union Christian College, Umiam Khwan, Meghalaya, In-House research grant (UCC/MRP/2023/04 Dated 20th October 2023) to undertake the research project.
Conflict of Interest
The authors do not have any conflict of interest
Data availability Statement
The manuscript incorporates all datasets produced or examined throughout this research study
Ethical Statement
This research did not involve human participants, animal subjects, or any material that requires ethical approval.
Informed Consent Statement
This study did not involve human participants and therefore informed consent was not required.
Permission to reproduce material from other sources
Not Applicable
Author Contributions
The sole author was responsible for the entire research work done
References
- Bogale A. Morphometric analysis of a drainage basin using geographical information system in Gilgel Abay watershed, Lake Tana Basin, upper Blue Nile Basin, Ethiopia. Appl Water Sci. 2021;11(1):122. doi:10.1007/s13201-021-01447-9.
CrossRef - Chorley RJ. Introduction to Physical Hydrology (Collected Works of Richard J. Chorley). Vol 5. Routledge; 2019:37-59.
CrossRef - Gregory KJ, Walling DE. Field Measurements in the Drainage Basin. Geography. 1971;56(4):277-292. Available at: http://www.jstor.org/stable/40567599. Accessed on June 11, 2024.
- Shekar RP, Mathew A. Morphometric Analysis of Watersheds: A Comprehensive Review of Data Sources, Quality, and Geospatial Techniques. Watershed Ecol Environ. 2023;6:1-9. doi:10.1016/j.wsee.2023.12.001.
CrossRef - Onosemuode C, Adetimirin O, Aboderin O. Hydrological Analysis of Onitsha North East Drainage Basin Using Geoinformatics Techniques. World Appl Sci J. 2010;11:1297-1302.
- Horton RE. Erosional development of streams and their drainage basins; hydrophysical approach to quantitative morphology. Geol Soc Am Bull. 1945;56:275-370.
CrossRef - Singh S, Kanhaiya S, Singh A, Chaubey K. Drainage network characteristics of the Ghaghghar River Basin (GRB), Son Valley, India. Geol Ecol Landsc. 2018;3:1-9. doi:10.1080/24749508.2018.1525670.
CrossRef - Playfair J. Illustrations of the Huttonian theory of the earth. Cadell and Davies; 1802. Available at: https://www.biodiversitylibrary.org/item/107595. Accessed on June 11, 2024.
CrossRef - Bloom AL. Geomorphology: A Systematic Analysis of Late Cenozoic Landforms. 3rd ed. 1998.
- Mudashiru RB, Olawuyi MY, Amototo IO, Oyelakin MA. Morphometric Analysis of Asa and Oyun River Basins, North Central Nigeria Using Geographical Information System. Am J Civ Eng. 2017;5(6):379-393. doi:10.11648/j.ajce.20170506.20.
CrossRef - Rahman Joy MA, Upaul S, Fatema K, Amin FM Rezvi. Application of GIS and remote sensing in morphometric analysis of river basin at the south-western part of the great Ganges delta, Bangladesh. Hydrol Res. 2023;54(6):739-755. doi:10.2166/nh.2023.087.
CrossRef - Asfaw D, Workineh G. Quantitative analysis of morphometry on Ribb and Gumara watersheds: Implications for soil and water conservation. Int Soil Water Conserv Res. 2019;7(2):150-157. doi:10.1016/j.iswcr.2019.02.003.
CrossRef - Kanhaiya S, Singh S, Singh CK, Srivastava V, Patra A. Geomorphic Evolution of the Dongar River Basin, Son Valley, Central India. Geol Ecol Landsc. 2019;10:1558019. doi:10.1080/24749508.2018.1558019.
CrossRef - Kumar R, Kumar S, Lohani AK, Nema RK, Singh RD. Evaluation of geomorphological characteristics of a catchment using GIS. GIS India. 2000;9:13-17.
- Nag S, Chakraborty S. Influence of rock types and structures in the development of drainage network in hard rock area. J Indian Soc Remote Sens. 2003;31:25-35. doi:10.1007/BF03030749.
CrossRef - Soni S. Assessment of morphometric characteristics of Chakrar watershed in Madhya Pradesh India using geospatial technique. Appl Water Sci. 2016;7:10.1007/s13201-016-0395-2.
CrossRef - Adhikari S. Morphometric Analysis of a Drainage Basin: A Study of Ghatganga River, Bajhang District, Nepal. The Geographic Base. 2020;7:127-144. doi:10.3126/tgb.v7i0.34280.
CrossRef - Chatterjee S, Krishna AK, Sharma A. Geospatial assessment of soil erosion vulnerability at watershed level in some sections of the Upper Subarnarekha River basin, Jharkhand, India. Environ Earth Sci. 2013;71:2439-2449. doi:10.1007/s12665-013-2439-3.
CrossRef - Parakandi A, Kalladithodi N, Shimna P, Thottungal D. Quantitative Analysis of Geomorphology and Flow Pattern Analysis of Muvattupuzha River Basin Using Geographic Information System. Aquatic Procedia. 2015;4:609-616. doi:10.1016/j.aqpro.2015.02.079.
CrossRef - Jha A, Gupta NC, Dey B. Morphometric Analysis of Gandak River Drainage Basin Using Geographic Information System (GIS) and SRTM-DEM. Salud Cienc Tecnol. 2022;2(S2):189. doi:10.56294/saludcyt2022189.
CrossRef - Obeidat M, Awawdeh M, Al?Hantouli F. Morphometric analysis and prioritisation of watersheds for flood risk management in Wadi Easal Basin (WEB), Jordan, using geospatial technologies. J Flood Risk Manag. 2021;14:12711. doi:10.1111/jfr3.12711.
CrossRef - Shekar RP, Mathew A. Morphometric Analysis of Watersheds: A Comprehensive Review of Data Sources, Quality, and Geospatial Techniques. Watershed Ecol Environ. 2023;6:1-9. doi:10.1016/j.wsee.2023.12.001.
CrossRef - Ranalli G, Scheidegger AE. Topological significance of stream labelling methods. Hydrol Sci J. 1968;13(4):77-85. doi:10.1080/02626666809493628.
CrossRef - Scheidegger AE. Horton's Law of Stream Numbers. Water Resour Res. 1968;4:655-658.
CrossRef - Strahler AN. Quantitative analysis of watershed geomorphology. Eos Trans Am Geophys Union. 1957;38:913-920.
CrossRef - Milton LE, Ollier CD. A code for labelling streams, basins, and junctions in a drainage net. J Hydrol. 1965;3:66-68.
CrossRef - Werner C. Horton's law of stream numbers for topologically random channel networks. Can Geogr. 1970;14(1):57-66.
CrossRef - Prabhakaran A, Raj J. Drainage morphometric analysis for assessing form and processes of the watersheds of Pachamalai hills and its adjoining, Central Tamil Nadu, India. Appl Water Sci. 2018;8:10.1007/s13201-018-0646-5.
CrossRef - Schumm SA. Evolution of drainage systems and slopes in Badlands at Perth Amboy, New Jersey. Geol Soc Am Bull. 1956;67:597-646.
CrossRef - Schumm SA. Sinuosity of Alluvial Rivers on the Great Plains. U.S. Geol Surv. 1963;74:1089-1100.
CrossRef - Leopold LB, Wolman MG. River channel patterns: braided, meandering and straight. US Geol Surv. 1957;282-B:39-84.
CrossRef - Horton RE. Drainage basin characteristics. Trans Am Geophys Un. 1932;13:350-361.
CrossRef - Ramzan Dar R. Tourism and Management of Wetland Ecosystems in Kashmir Valley. Department of Geography, Aligarh Muslim University; 2016. Available at: http://hdl.handle.net/10603/186099. Accessed on December 20, 2024.
- Pareta K, Pareta U. Quantitative morphometric analysis of a watershed of Yamuna basin, India using ASTER (DEM) data and GIS. Int J Geomatics Geosci. 2011;2:1-8.
- Rathinagiri S, Raj J, Sivasankar V, Akhila P, Omine K. Geo-spatial technique-based approach on drainage morphometric analysis at Kalrayan Hills, Tamil Nadu, India. Appl Water Sci. 2019;9:10.1007/s13201-019-0899-7.
CrossRef - Mahala A. The significance of morphometric analysis to understand the hydrological and morphological characteristics in two different morpho-climatic settings. Appl Water Sci. 2020;10:10.1007/s13201-019-1118-2.
CrossRef


