A comparative study of water quality parameters of ground water among the three regions of Kalol taluka, Gujarat
M. C. Shah1 * , P. G. Shilpkar2 , V. R. Patel1 , D. N. Upadhyay1 and H. K. Patel1
1
Department of Chemistry,
Gujarat Vidyapith,
Sadra,
382 320
Gandhinagar
India
2
Biogas Research and Extension Centre,
Gujarat Vidyapith,
Sadra,
382 320
Gandhinagar
India
http://dx.doi.org/10.12944/CWE.1.2.10
A study of water quality parameters of ground water of North, Central and South regions of Kalol Taluka in Gandhinagar district of Gujarat state, India have been carried out during May-2006. The observed values of various physico-chemical parameters of water samples were compared with standard recommended by World Health Organization (WHO). The analysis of variance (ANOVA) and t-test have been applied for the comparative study of water quality parameters among various regions of Kalol Taluka. The variance was found significant at 1% level of significance in case of Electrical Conductivity, Magnesium Hardness, Chloride Content and at 5% level of significance in case of pH, Total Dissolved Solids, Total Hardness, Chemical Oxygen Demand among the water samples of above three regions of Kalol Taluka. Established order of water quality of various regions of Kalol Taluka is North Kalol>Central Kalol>South Kalol.
Copy the following to cite this article:
vol1no2/CWEVO1NO2P153-160.pdf Shah M.C, Shilpkar P.G, Patel V.R, Upadhyay D.N, Patel H.K, Kansara J.C. A comparative study of water quality parameters of ground water among the three regions of Kalol taluka, Gujarat. Curr World Environ 2006;(1):153-160 DOI:http://dx.doi.org/10.12944/CWE.1.2.10
Copy the following to cite this URL:
Shah M.C, Shilpkar P.G, Patel V.R, Upadhyay D.N, Patel H.K, Kansara J.C. A comparative study of water quality parameters of ground water among the three regions of Kalol taluka, Gujarat. Curr World Environ 2006;(1):153-160. Available from: http://www.cwejournal.org?p=223/
Download article (pdf)
Citation Manager
Publish History
Introduction
Water is the basic necessity of life, not only for human beings, but also for plants and animals. Scientists estimate that water covers nearly three fourth of earth’s surface in the form of oceans, rivers, lakes, snow, glaciers and ground water. Though this seems an inordinately huge amount; in actual fact, less than one percent is fresh and usable found in lakes, ponds, rivers and ground water. There are some ways in which bodies of water get polluted; discharge of untreated domestic sewage into water ways; discharge of industrial effluents; discharge of agriculture wastes into water way; use of pesticides, herbicides, fungicides and weedicides which seep into ground water; discharge of fertilizer residues as run-off from farm lands into water ways.
Studies of physico-chemical characteristics of ground water or drinking water of various villages of various talukas in Gujrat State have been carried out by various workers.1-3 Kalol Taluka is famous for industrial estate in Gandhinagar district of Gujarat sate, India. Borewell water is generally used for drinking and other domestic purpose in Kalol Taluka. So, we carried out a study of physico-chemical parameters of bore-well water of North, Central and South regions of Kalol Taluka and data were analyzed statistically using coefficient of variance (%CV), analysis of variance (ANOVA) and t-test.
Material and Methods
Water samples were collected from bore wells of thirty-nine villages of Kalol Taluka during May-2006. Thirteen villages of each region of Kalol Taluka (North, Central, South) were selected for water sampling (Fig. 1 and Table-1). Samples were collected in polythene bottles and analyzed for various physico-chemical parameters as per standard procedures described in APHA.4
Table - 1: Name of villages used for sampling of Kalol Taluka
| North Region | Central Region | South Region |
| Veda | Nava | Piyaj |
| Jamla | Golthara | Ram Nangar |
| Vagosana | Kantha | Sherisa |
| Dhendhu | Nardipur | Jaspur |
| Khoraj dabhi | Dingucha | Bhoyan Moti |
| Paliyad | Mokshasan | Dantali |
| Soja | Pansar | Khatraj |
| Nadari | Dhamasan | Jethlaj |
| Amaja | Isand | Jethlaj |
| Balva | Chhatral | Santej |
| Mubarakpur | Kalol | Ranchhodpura |
| Aluva | Arsodiya | Rancharda |
| Limbodra | Borisana | Labakaman |
(Table-2). The analyzed data were compared with standard values recommended by World Health Organization (WHO).
AR grade reagents and double distilled water were used for reagents preparation. The statistical analysis such as mean, standard deviation (SD) and coefficient of variance (%CV) of experimental data were carried out. Analysis of variance (ANOVA) and t-test were also determined for comparison among the water quality parameters of ground water of North, Central and South regions of Kalol Taluka as per the methods described by Rangaswami.5
Table -2: Methods used for analysis of quality parameters for water sample
| Parameters studied | Methods used |
| pH | Recorded by pH meter |
| Electrical Conductivity (EC) | Measured by conductivity meter |
| Total Dissolved Solids(TDS) | Evaporation method |
| Total Alkalinity (TA) | Neutralising with standard HCl |
| Total Hardness (TH) | EDTA titration |
| Calcium Hardness (CaH) | EDTA titration |
| Magnesium Hardness (MgH) | Calculations |
| Chloride(Cl) | Mohr’s methods |
| Fluoride (F) | Alizarin spectro photometric method |
| Sulphate (SO42) | Gravimetric method |
| Sodium (Na+) | Flame Photometric method |
| Potassium (K+) | Flame Photometric method |
| Dissolved Oxygen (DO) | Modified winkler’s methods |
| Biochemical Oxygen Demand (BOD) | Modified winkler’s methods |
| Chemical Oxygen Demand (COD) | Titrated with an excess of K2Cr2O7 |
Results and Discussion
The pH value of drinking water is an important index of acidity or alkalinity. A number of mineral and organic matter interact with one another to give the resultant pH value of the sample. Eye irritation and exacerbation of skin disorders have been associated with pH values greater than 11.6 The pH value of water samples of North, Central and South region of Kalol ranged form 7.49 to 8.34, 7.41 to 8.02 and 7.60 to 8.87 respectively. It shows that the water is slightly alkaline in nature. These values are within the prescribed limit given by WHO. Statistical analysis shows that the lowest (%CV=2.22) and highest (%CV=4.02) value of % CV for pH were found in Central and South regions, respectively (Table -3).
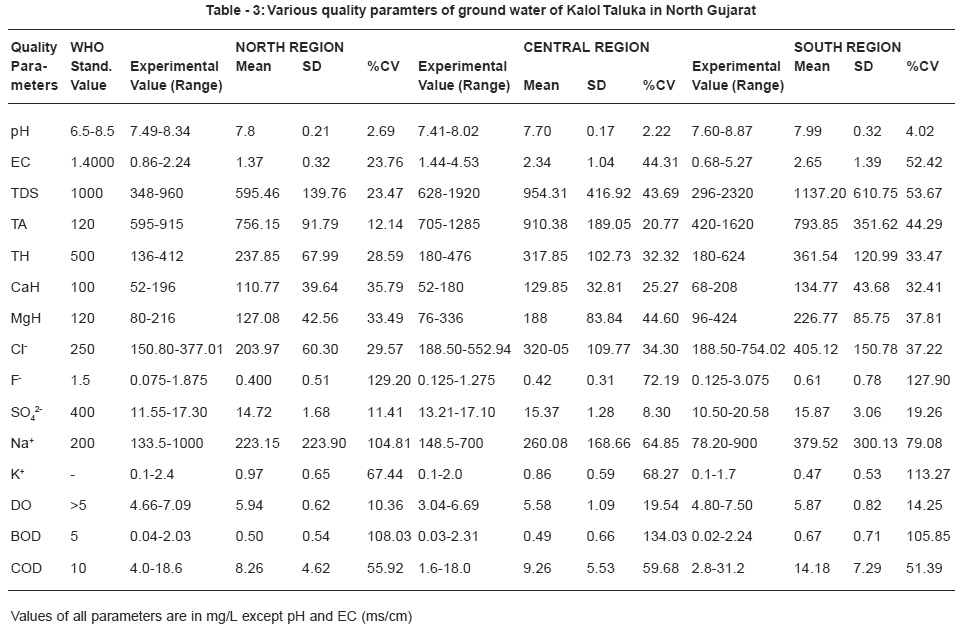 |
Table - 3: Various quality paramters of ground water of Kalol Taluka in North Gujarat Click here to view table |
Electrical conductivity of water is directly related to the concentration of ionized substances in water. Electrical conductivity values of water samples of North, Central and South region of Kalol Taluka ranged from 0.86 to 2.24 ms/cm, 1.44 to 4.53 ms/cm and 0.68 to 5.27 ms/cm, respectively. 31% water samples of North Kalol region, 100% water of Central Kalol region and 92% water samples of South Kalol region showed higher electrical conductivity values than that of prescribed permissible limit given by WHO. The minimum variance value (%CV=23.76) was found in North regions and maximum variance value (%CV=52.42) was found in South region of Kalol Taluka (Table-3).
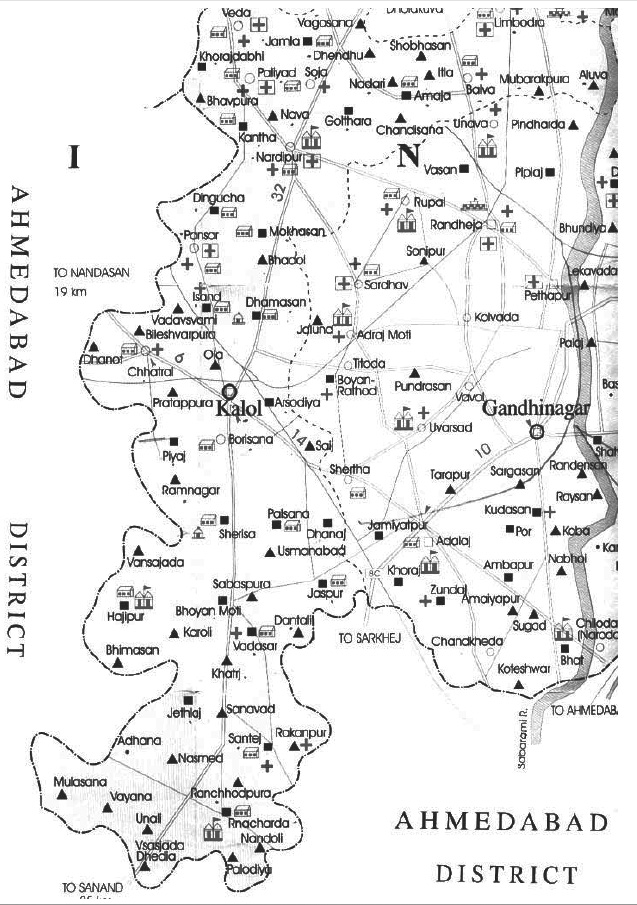 |
Click here to view map |
Tota! Dissolved solids (TDS) comprise inorganic salts (principally calcium, magnesium, potassium, sodium, bicarbonates, chlorides and sulphates) and small amounts of organic matter that are dissolved in water. TDS value of water samples of North Kalol region ranged from 378 to 960 mg/L. They are with in the permissible limit as per WHO. It indicates that these water samples have to tolerable concentration of soluble salts. TDS value of water samples of Central and South region of Kalol Taluka ranged form 628 to 1920 mg/L and 296 to 2320 mg/L, respectively. 31% water samples of Central region and 46% water samples of South region had higher value of TDS that that of prescribed limit given by WHO. It decreases palability and may cause gastrointestinal irritation. The sequences of %CV values of TDS for water samples of all regions is North Kalol (%CV=23.47)
The total alkalinity value of water samples ranged between 595 to 915 mg/L, 705 to 1285 mg/ L and 420 to 1620 mg/L for North, Central and South region of Kalol Taluka. Respectively. Water samples of all regions were found exceed values of total alkalinity with compare to guideline value by WHO. So found alkalinity point of view quality of water samples of all regions is poor. Highest variance (%CV=44.29) showed in total alkalinity value of water samples of South region and lowest variance 0&CV=12.14 showed in water samples in water of North region of Kalol Taluka (Table-3).
Table - 4: F Value of various quality parameters of ground water of all regions
of Kalol Taluka in North Gujarat
| Quality parameters | F-Value |
| pH | 4.65* |
| Electrical Conductivity | 5.61** |
| Total Dissolved Solids | 5.24* |
| Total Alkalinity | 1.5 |
| Total Hardness | 5.15* |
| Calcium Hardness | 1.38 |
| Magnesium Hardness | 6.08** |
| Chloride | 10.35** |
| Fluoride | 0.56 |
| Sulphate | 0.93 |
| Sodium | 1.5 |
| Potassium | 2.55 |
| Dissolved Oxygen | 0.6 |
| Biochemical Oxygen Demand | 0.33 |
| Chemical Oxygen Demand | 3.73* |
*Significant at 5% level of significance ** Significant at 1% level of significance
The hard water is not suitable for domestic use in washing, cleaning and laundering. It is undesirable due to the information of heat retarding insulating scales in the boilers and other heat exchanges equipments.7 The total hardness value of water samples of North, Central and South regions ranged fro 136 to 412 mg/L, 180 to 476 mg/ L and 180 to 624 mg/L, respectively. Total hardness value of all water samples were showed with in the permissible limit as per WHO except 15% water sample of South region of Kalol Taluka. Samples of North region showed lowest variance (%CV=28.59) and of South regions showed highest variance (%CV=33.47) for total hardness value among all regions of Kalol Taluka (Table-3).
The Calcium hardness value of water samples of North, Central and South region of Kalol Taluka ranged from 52 to 196 mg/L, 52 to 180 mg/ Lm and 68 to 208 mg/L, of South region were showed higher calcium hardness values with compare to standard values prescribed by WHO. The value of %CV of calcium hardness of water samples is lowest (%CV=25.27) for Central region and highest (%CV=35.79) for North region among the all studied regions (Table-3). The Magnesium hardness values of water samples ranged form 80 to 216 mg/L, 76 to 336 mg/L and 96 to 424 mg/L for North, Central and South region of Kalol Taluka, respectively. 23%, 54% and 69% water samples showed higher value of magnesium harness for North, Central and South region, respectively, as per WHO. The highest value of %CV (%CV = 44.60) found in water samples of central region and lowest value (%CV=33.49) in North region for magnesium hardness (Table-3).
Excessive chloride concentrations increase rates of corrosion of metals in the distribution system. This can lead to increased concentration of metal in the supply.6 The chloride content of water samples of North, Central and South region of Kalol Taluka ranged form 150.80 to 377.01 mg/L, 188.50 to 552.94 mg/L and 188.50 to 754.02 mg/L, respectively. 15% water samples of North region, 77% of Central region and 85% of South region showed exceed values of chloride content that that of permissible limit as prescribed by WHO. The sequence of %CV values of chloride content values of water samples is North Kalol (%CV=29.57)8-11 The fluoride content of water samples of North, Central and South region of Kalol Taluka ranged form 0.0075 to 1.875 mg/L, 0.125 to 1.275 mg/L and 0.125 to 3.075 mg/L, respectively. 7.69% water samples of both regions except Central region showed exceed value of fluoride content that that of permissible limit as prescribed by WHO. The sequence of CV values of fluoride content for water sample of all regions is Central Kalol (%CV=72.19)
Table - 5: Difference of mean value of various quality parameters of ground
water among the various regions of Kalol Taluka in North Gujarat
| Quality parameter | Difference of mean value between two regions | ||
| Region | North | Central | |
| pH | Central | 0.1 | - |
| South | 0.19* | 0.29** | |
| EC | Central | 0.97* | - |
| South | 1.28** | 0.31 | |
| TDS | Central | 358.85* | - |
| South | 542.46** | 183.61 | |
| TH | Central | 80* | - |
| South | 123.69** | 43.69 | |
| MgH | Central | 60.92* | - |
| South | 99.69** | 38.77 | |
| Chloride | Central | 116.08* | - |
| South | 201.15 | 85.07 | |
| COD | Central | 1 | - |
| South | 5.92 | 4.95* | |
*Significant at 5% level of significance ** Significant at 1% level of significance
Catharsis, dehydration and gastrointestinal irritation show in humans due to high concentration of sulphate in drinking water.12 All water samples of Kalol Taluka showed sulphate content ranged form 10.50 to 20.58 mg/L, which is within the prescribed value of WHO. The value of %CV of sulphate content of water samples is lowest for Central region and highest for South region among the all regions of Kalol Taluka (Table-3).
At lower concentrations, sodium in drinking water have to adverse effects on health. According to National Academy of Sciences,13 the higher concentrations of sodium can be related to cardiovascular diseases and in women toxemia associated with pregnancy. Sodium may be of concern in the persons having abnormal sodium metabolism besides, high concentration of sodium associated with chlorides and sulphates make the water salty and renders in unpalatable. The sodium content of water sample of North, Central and South regions of Kalol Taluka ranged form 133.5 to 1000 mg/L, 148.5 to 700 mg/L and 78.20 to 900mg/L, respectively. 7.60%, 38.46% and 46.15% water samples showed higher values of sodium for North, Central and South region, respectively, as per WHO. Samples of Central region showed lowest variance (%CV=64.85) and of North region showed highest variance (%CV=104.81) for sodium content among all regions of Kalol Taluka (Table-3).
Dissolved oxygen (DO) is oxygen gas (O2) that is dissolved in water. DO is as very important indicator of water for its quality. Oxygen removes from the water by respiration of aquatic living thins and decomposition of organic matter.14 Dissolved oxygen content of water samples of North, Central and South regions ranged from 4.66 to 7.09 mg/L, 3.04 to 6.69 mg/L and 4.80 to 7.50 mg/L, respectively. 7.69% water samples of North region, 23.08% of Central region and 15.38% of South region showed lower value of DO that of permissible limit prescribed by WHO. The sequence of %CV values of dissolved oxygen value of water samples is Central Kalol (%CV = 19.54)>South Kalol (%CV=14.25)>North Kalol (%CV=10.36) (Table-3).
Biochemical oxygen demand (BOD) of water samples of North, Central and south regions ranged from 0.04 to 2.03 mg/L, 0.03 to 2.31 mg/L and 0.02 to 2.24 mg/L, respectively. These values are within the prescribed values by WHO. The value of %CV of BOD of water samples is lowest (%CV=10.585) for South regions and highest (%CV = 134.03) for Central region among all the studied region (Table-3). Chemical oxygen demand (COD) of water samples of North, Central and south region ranged from 4.0 to 18.6 mg/L, 1.6 to 18.0 mg/L and 2.8 to 31.2 mg/L, respectively. 30.77% water samples of North region, 38.46% of Central region and 76.92% of South region showed exceed value of COD than that of permissible limit prescribed by WHO. The highest value of %CV (%CV=59.68) found in water samples of Central region and lowest value (%CV=51.39) in south region for COD value (Table-3).] Since no prescribed standards are suggested by WHO for potassium content for drinking purpose. So, no comparison can be made from observed values.
Table-4 shows that the variance is significant at 1% level of significance in case of electrical conductivity, magnesium hardness and chloride content and at 5% level of significance in case of pH, total dissolved solids, total hardness and chemical oxygen demand, respectively among the water samples of three regions of Kalol Taluka.
Table-5 reveals that the difference of mean value of EC, TDS, TH and MgH are significant at 1% level of significance for North-South region and at 5% level of significance for North-Central region. The difference of mean value of pH is significant at 5% level of significance for Central-South region and at 1% level of significance for Central-South region. The difference of mean values of COD is significant at 5% level of significance for North-South and Central-South regions. The difference of mean value of chloride content is significant of 1% level significance for North-Central region.
Conclusions
As per the various water quality parameters studied it can be concluded that the order of water quality of various regions of Kalol Taluka is North Kalol>Central Kalol > South Kalol.
References
- Bhoi D.K., Raj D.S., Mehta Y.M., Chauhan M.B. and Machhar M.T., Phyico-Chemical Analysis of Bore Wells Drinking water of Nadiad Territory, Asian J. Chem. (2005) 17(1), 404-408.
- Pandit B.R. and Oza F., Ground Water Analysis of Bhavnagar City during Monsoon Season, Int J. Bioscience Reporter, (2004) 2(2), 232-234.
- Joshi J.D, Vora J.J., Sharma, S.S., Patel N., Kothari O. Salvi, K., Potable Water Characteristics of Patan (West) Region, Int. Chem. Sci., (2004) 2(3), 337-344.
- APHA, Standard Methods for the Examinations of Water and Waste Water, 18th edition, American Public Health Association, Washington, EC, (1992).
- Rangaswami R., A Text Book of Agriculture Statistics, New Age International Publishers Ltd. New Delhi (1995).
- WHO, The Guideline for Drinking Water Recommendation, World Health Organization, Geneva (2002).
- Trivedy R.K. and Goel P.K., Chemical and Biological Methods for Water Pollutions Studies, Environmental Publications, Karad, India (1986).
- Desai V.J., Saxena D.K. Bhavar B.S. and Kantharia S. L., Epidemiological Study of Dental Fluorosis in Tribals Residing near Fluorospar Mines, Fluoride (1988) 21(3), 142-148.
- Maithani P.B., Gujar R., Banerjee R., Balaji B.R., Ramchandran S. and Singh R. Anomalous Fluoride in Ground Water from Western Part of Sirohi District. Rajasthan and its Crippling Effect on Human Health, Curr. Sci., (1998) 74(2), 773-777
- Sangha J.K and Bal S.K., Diatery Factors Affecting the Fluoride Toxicity in the Fluoridated Area of Rural Punjab, J. Hum. Ecol., (1998) 9(2), 159-162.
- Sarala Kumari D. and Rao P.R. Endemic Fluorosis in the Madras Presidency Indian J. Med. Res., (1993) 25, 553-558.
- Maiti S.K., Handbook of Methods in Environmental Studies ABD Publishers, Jaipur, India (2004).
- National Academy of Science, Drinking Water and Health, Fedeal Register, (1977) 43(132), 35764.
- Brunson Martin W., Gerg Lutz C. and Durborow Robert M., Algae Blooms in Commercial Fish Production ponds, Southern Regional Aqaculture Centre publication No. 466 (1994).


