Assessment of water quality near Chopan River, Raghogarh, District Guna, (M.P.)
Megha Rai1 * and R.M. Shrivastava1
http://dx.doi.org/10.12944/CWE.1.2.22
The study of the contamination level of drinking water used and effect of fertilizer industry of aquatic biota in Raghogarh was conducted at 6 stations in Chopan River and 4 stations of surrounding tube wells in year (2004). In the water samples, temperature, pH, conductivity, TDS, hardness, calcium, Magnesium, DO chloride, free ammonia-N were evaluated through analysis. Ii is found that the values of total dissolved solids and free ammonia-N are higher. Total dissolved solids in excessive causes laxative effect, whereas increase in ammonia cause decrease in pH ultimately it is harmful to life, irrigation and drinking purpose.
Copy the following to cite this article:
Rai M, Shrivastava R.M. Assessment of water quality near Chopan River, Raghogarh, District Guna, (M.P.). Curr World Environ 2006;1(2):213-216 DOI:http://dx.doi.org/10.12944/CWE.1.2.22
Copy the following to cite this URL:
Rai M, Shrivastava R.M. Assessment of water quality near Chopan River, Raghogarh, District Guna, (M.P.). Curr World Environ 2006;1(2):213-216. Available from: http://www.cwejournal.org/?p=1047
Download article (pdf)
Citation Manager
Publish History
Introduction
Water is one of the most important commodities which man has exploited than any other resources for the sustenance of his life. Most of our demands for water is fulfilled by rainwater which gets deposited in surface and ground water resources. Though, water is continuously purified by evaporation and precipitations, pollution of water has emerged as one of the most significant environmental problems of recent times. The cause of such a situation is many but the quality of water is deteriorated day by day due to rapid increase in urbanization and industrialization.1
Some of the major adverse effect have arised from construction of reservoirs, surface water irrigation, deforestation, industrial and urban waste disposal.
Water quality deterioration has made potable water resources scarcer and endangered for plant and animal life.2 In the present work, various water samples of tube wells and river water of Raghogarh Tehsil has been analyzed.
The impact of fertilizer industry on different stations at the factory is engaged in the production of urea i.e. nitrogenous fertilizer from natural gas. The wastes form fertilizer industries can also be a rich source of nutrients causing eutrophication.3
Many authors4-8 have studied the physicochemical characterization of groundwater and surface water of different parts of the worlds. The objective of present study was to determine the quality of water supplied to the rural community in order to estimate the health implications.
Experimental
Water samples were collected for three seasons i.e., summer, rainy and winter. Sample with in the 10 kms. from fertilizers industries were collected from ten stations, out of these 10, four are tubewells and six stations are on Chopan River. Water samples were collected in polythene bags from various stations. Analyses for Physicochemical parameter were done by following method described in the literature.9-10 Hardness is determined by EDTA-titrimetric methods, chloride by Mohr’s methods, DO by Winkler’s method and free ammonia by Nesslerization method.
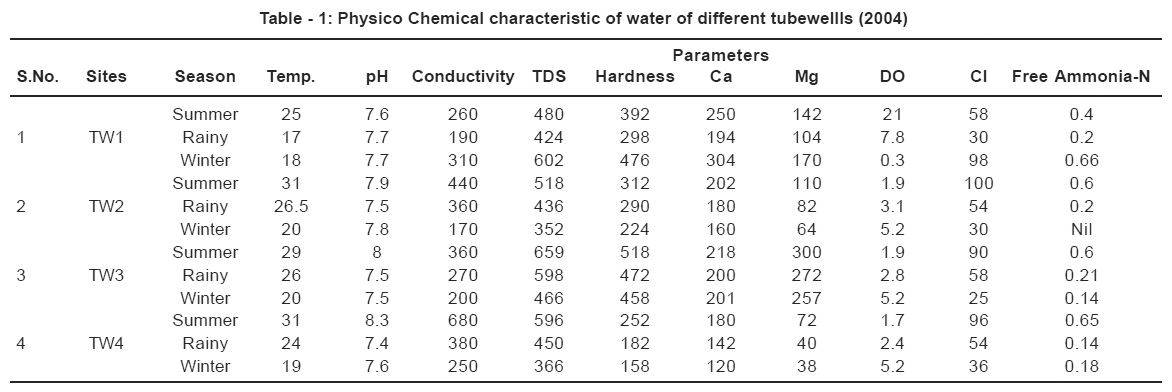 |
Table - 1: Physico Chemical characteristic of water of different tubewellls (2004) Click kere to view table |
Results and Discussion
All the metabolic and physiological activities and life processes of aquatic organisms are generally influenced by temperature. It accelerates chemical reactions.
In the present study the temperature in tube well is ranged form 17°C to 31°C and in river water it was noticed in the range of 18.5°C to 32.5°C. The temperature was recorded at the sites only.
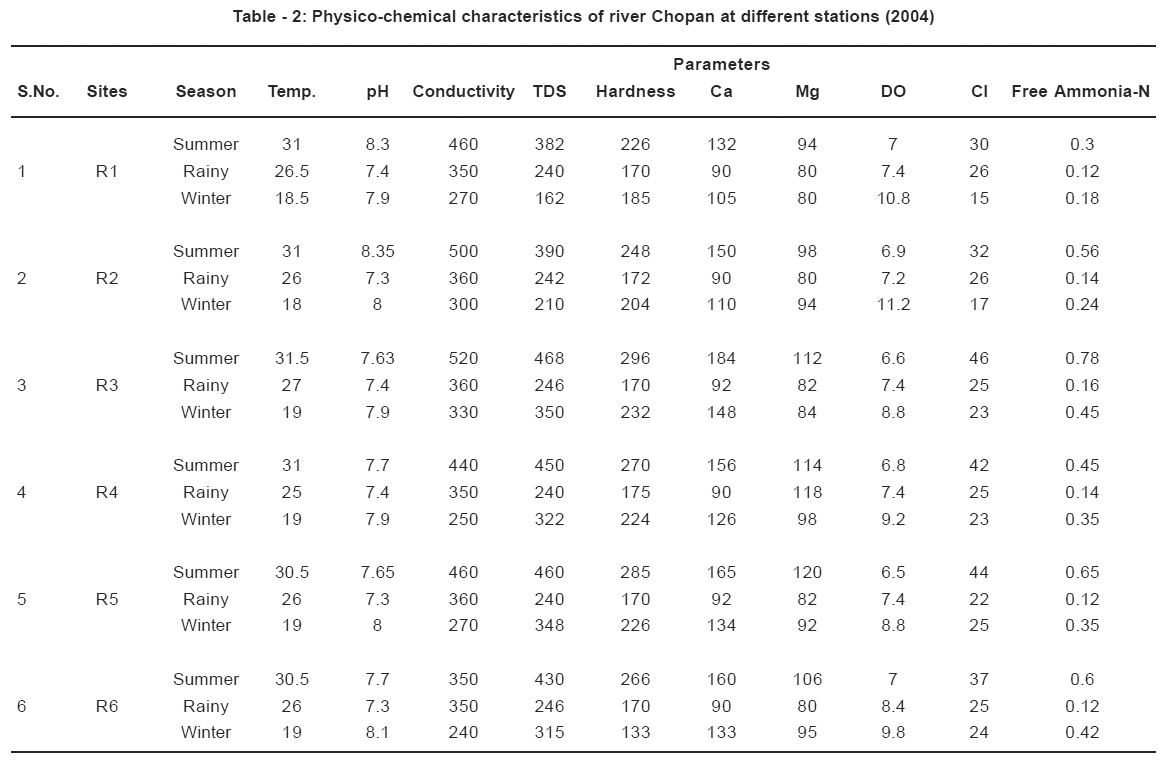 |
Table - 2: Physico-chemical characteristics of river Chopan at different stations (2004) Click kere to view table |
The pH value of drinking water is an important index of acidity, alkalinity and resulting value of acid base interaction of no. of its minerals and organic components. During the study period pH between 7.4 to 8.3 was noticed in tube wells and in river water it was ranged from 7.3-8.35. Specific conductivity of water provides quick and convenient method for determination of total amount of ionizable salts present in it and expressed as umhos/cm. In the present finding specific conductivity in tube wells varied form 170 to 680 uhmos/cm and in river water it is 240 to 520 umhos/ cm. Higher conductivity is observed at station R3 after confluence of waste water from fertilizer factory in summer and low in winter seasons. According to world health organization and Indian standard, total dissolved solids values should be lower than 500 mg/L for drinking water. In the present study total dissolved solids range from 170 to 659 mg/L in tube well and 160 to 585 mg/L in Chopan River. Highest TDS was noticed as Station R3 most of the samples have higher values of TDS as prescribed by WHO and Indian standards.
Total hardness is a measure of the capacity of precipitate soap. It is the sum of polyvalent cation present is water. It was found to have been varied from 150 to 518 mg/L in tube wells and 133 to 296 mg/L was observed in river water. Samples values as compared to IST and WHO.
Calcium is needed for the body in small quantities. Calcium hardness in mainly due to salts present in water and expressed as calcium carbonates. The limits of calcium and magnesium have been prescribed in the range of 75 to 200 mg/ L and 50 to 100 mg/L respectively. But the observed calcium values were higher i.e, 120 to 304 mg/L in tube wells and 90 to 200 mg/L in river water. Magnesium is in the range of 38 to 300 mg/L in tube well water and 80-112 mg/L in river water.
Presence of chloride in high amount in water indicates that it is contaminated by sewage. But in the present study quantity of chloride is moderate, i.e. in the Chopan river its is ranged from 30 to 100 mg/L in tube well and 15 to 46 mg/L in river water. The desirable limit of chlorides is 250 mg/L and permissible up to 600 mg/L.
DO is one of the most important constituents of water which effect physiological and biological process. In the present work the observed DO is 0.3 to 7.8 mg/L in tube wells and in river water it ways ranged from 6.5 to 11.2 mg/L. Free ammonia-N was measured by using Nessler’s reagent. The colour was measured by using spectrophotometer. In the present study. It was ranged from 0.14 mg/L to 0.66 mg/L in tube wells and in river water it is ranged from 0.12 to 0.78mg/L.
Conclusion
It is seen that the sample near the fertilizers have higher values particularly total dissolved solids and free-ammonia-N. High level of TDS causes objectionable taste and laxative effect. The increase in free ammonia causes organic pollution. Both these contents in water in increased amount are harmful to fish and other biota. So it is necessary to control the incoming industrial wastage by redesigning the infrastructure to protect the river and surroundings.
Acknowledgements
The authors sincerely thanks to Head, Dept. of Chemistry, Unique College, Bhopal for providing Laboratory facilities.
References
-
Patel S.R., Desai K.K., Physico-chemical characteristics of groundwater, Asia J. Chem., (2004) 16(2), 1171-1175.
-
Biwas S.N., Hemlata Mohabey, M.L. Naik, Studeis on phsico-chemical parameters to asses the water quality of chandi dongri Dist. For Drinking and Agriculture purpose. Asian. J. Chem., (2002) 16(2), 865-871.
-
Goel P.K., Water Pollution-causes, effect and control page-7.
-
Demval M., Akolkar P.A., Hydrobiologcial assessment of water quality of Bhagirathi with reference to hydel projects in Uttranchal. Res. I. chem.. Envir., (2006) 10(2), 54-63.
-
Ubale M.B., Farooqui MN. Arif P.M., Zaheer A., Dhule D.G., Regression analysis of groundwater quality data of chikalthana industrial area, Aurangabad. Orient. J. Chem., (2001) 17(2), 347-8.
-
Meitei N.S.,. Patil P.M., Bhosle A.B., Physico-chemical analysis of purna river for potablity J. Aqua Biol. (2004) 19(1) 103-05.
-
Panda S.P., Bhol B.N., Mishra C.S.K., Water quality status of five major temple ponds of Bhudaneshwar city. Indian J. envir. Prot., (2004) 24(3), 199-201.
-
Sunkad B.N., Patil H.S., Water quality assessment of Rakaskoppa reservoir or Belgaum, karnatak, Indian J. Ecol., (2003) 30(1), 1106-9.
-
ICMR, Manual of standards for quality of drinking water supplies (1975).
-
WHO : Guidelines for Drinking water quality 13 ed Geneva. (2003).


