Controlling technologies of SO2 by adsorption techniques
D. Sirisha1 and K. Mukkanti1 *
1
Centre for Environment,
IST, JNTU,
Kukatpally,
Hyderabad
India
http://dx.doi.org/10.12944/CWE.1.2.13
The present studies deals with the adsorption of SO2 by manganese oxide i.e., Pyrulusite ore. Pyrulusite is used as an adsorbent for the present studies. It is found that the percentage removal of SO2 increases with the increase in contact time, follows first order kinetics and a unimolecular layer is formed during the process. The percentage removal of SO2 increases with increase in dosages and decreases with increase in concentration. Thermodynamic parameters such as enthalpy, entropy and free energy of the process were determined which indicates that the process is spontaneous and exothermic in nature. The negative values of S indicate the increased randomness at the solid interface during the adsorption of SO2.
Copy the following to cite this article:
Sirisha D, Mukkanti K. Controlling technologies of SO2 by adsorption techniques. Curr World Environ 2006;(1):169-172 DOI:http://dx.doi.org/10.12944/CWE.1.2.13
Copy the following to cite this URL:
Sirisha D, Mukkanti K. Controlling technologies of SO2 by adsorption techniques. Curr World Environ 2006;(1):169-172. Available from: http://www.cwejournal.org/?p=1028
Download article (pdf)
Citation Manager
Publish History
Introduction
SO2 and its derivatives produce strong irritation on the eyes and nasal passage ways. It causes intense irritation even at 2.5 ppm levels to the eyes and respiratory tract.1-3 It is absorbed by the nasal system leading to swelling and stimulated mucus secretion and it causes lung cancer.4-6 The accumulation of transport vehicles such as automobiles at the signal points on the main arteries of the city and the consequent emission of exhaust of considerable quantity is everyday sequence. So the present study deals with controlling technologies of SO2 by batch adsorption by using MnO2 as an adsorbent.
Methods and Materials
Selection of the Adsorbent
Manganese dioxide is selected as an adsorbent for the present studies. MnO2 is amphertic in nature and it is a good oxidizing agent. It can easily to take an atom of oxygen. Due to the oxidizing nature of MnO2 a reaction takes place between them. Taking that factor into consideration MnO2 is selected as an adsorbent.
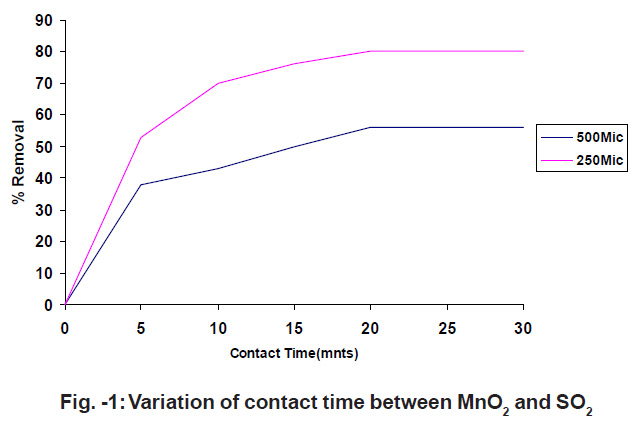 |
Figure - 1: Variation of contact time between MnO2 and SO2 Click kere to view figure |
The present studies are conducted by batch adsorption techniques. These methods are selected because SO2 is present in low concentrations and it is noncombustible. The experiments are conducted with respect to contact time concentration, adsorbent dosage and with respect to temperature.
Experimental Procedure
Effect of Contact Time and Particle Size on Adsorption of SO2 :
To study the effect of contact time, SO2 gas diluted with N2 gas is made to pass through a catalytic tube, which is maintained at a constant temperature. The catalytic tube is filled with a fixed amount of 0.8gms. The flow rate of 60 ml/min. was maintained. The experiments are conducted with 500mic. and 250mic. The results are shown in fig.1.
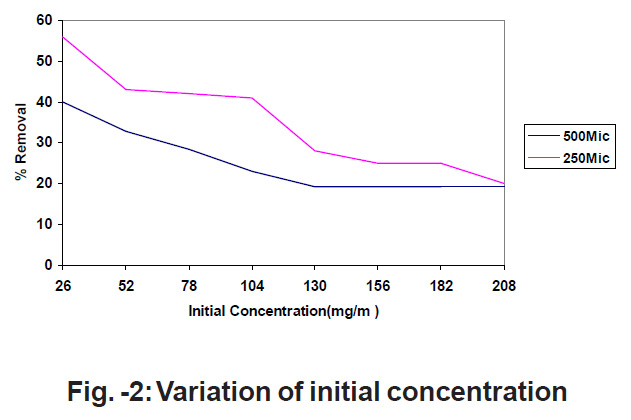 |
Figure - 2: Variation of initial concentration Click kere to view figure |
Effect of Concentration
Different concentrations of SO2 diluted with N2 gas are made to pass through a catalytic tube, which consists a constant amount of MnO2. The concentration of the gas is determined before and after adsorption of SO2 by using SO2 analyzer. The experiments are conducted with respect to 250 MIC and 500 MIC particle size. The results are shown in fig.2
 |
Figure - 3: Variation of adsorbent dosages Click kere to view figure |
Effect of Adsorbent Dosages
To study the effect of MnO2 dosages, definite concentration of SO2 is made to pass through a catalytic tube which consists of adsorbent. The adsorbent dosages are varied and initial conc. of SO2 and final conc. of SO2 are determined by using SO2 analyser which is based on west-Gaeke method. The results are shown in fig.3.
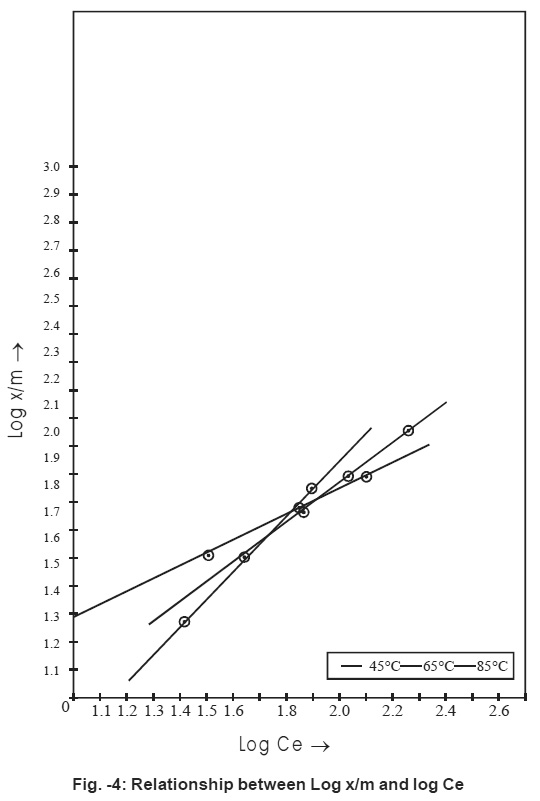 |
Figure - 4: Relationship between Log x/m and log Ce Click kere to view figure |
Effect of Temperature
To study the effect of temperature, the experiments are conducted at three different temperatures i.e., 450C, 650C and 850C.
Results and Discussion
Fig.1 shows that initially the percentage removal of SO2 increases with the increase in contact time.7-8 The optimum time for the removal of SO2 is 20 min. The percentage removal of SO2 increases with decrease in particle size.9-10 The percentage removal of SO2 increases with increase in contact time and it follows a smooth curve which indicates that the process is of first order.11 Initially the adsorption capacity is practically proportional to contact time initially the MnO2 surface is free from SO2 once equilibrium is established adsorption no longer depends on the surface area.
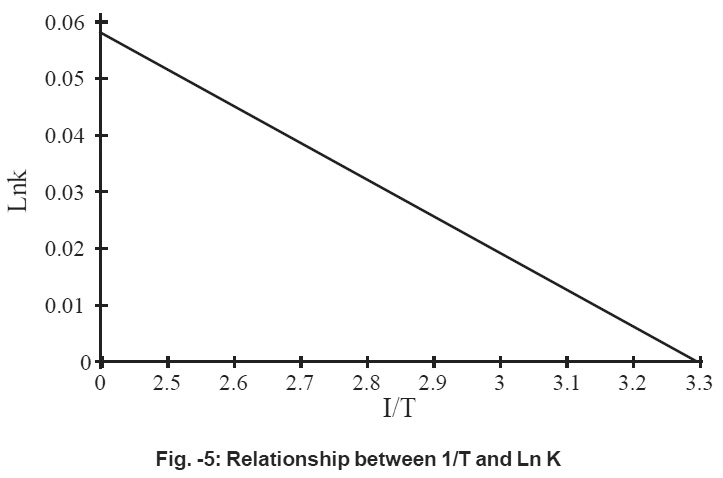 |
Figure - 5: Relationship between 1/T and Ln K Click kere to view figure |
Fig.2 represents the percentage removal of SO2 decreases with the increase in concentration.11-12 The number of gas molecules will be low at low concentrations and at the higher concentrations the number of gas molecules is more so adsorption is less.
Fig.3 represents that the percentage removal of SO2 increases with the increase in adsorbent dosage . Greater the number of adsorbent sites, greater is the percentage of adsorption.
Fig.4 represents that adsorption process follows Freundlich adsorption isotherm.15
It is observed the adsorption capacity increases with increase in temperature i.e., 850C. Thermodynamic parameters are calculated by plotting logkc verses 1/T.
A straight line is obtained. The negative 43, slope of the straight line indicates that the process of adsorption is exothermic in nature. The free energy of the process is negative which indicate that process is feasible and spontaneous in nature,
References
-
Baskurt, O.K., Environ.Health, (1988) 344-348.
-
Bethal, RA., Epstein, J., and Sheppard Am. Red. Respir. Dis., (1983) 128.
-
CiconeG, Faggiano F, Falasca P Epidermiol prev., (1995) 19, 99-104.
-
Farone A,Haung S, Paulauskis J. Respir.cell/ mol. Biol. (1995) 12, 345-450.
-
Fine, J.M,Gordon T, Sheppard, D., Am. Rev.Respir Dis (1987) 136, 1122-1126.
-
Anzar U.T, Venel, T.G., Hackney J.D, Environ.Res. (1983) 30, 340.
-
Al-Asheh, S., Banal,F and Al-Hameed,N Adsorption Sci. and Tech., (2003) 21(2), 177-188.
-
Lam, K., Car, X., Esenthal, R and Hubble, J., Enzyme Microl.Technol (2001) 29, 28-38.
-
Nakamura, T., Kawasaki, M., Matsamoto, K., Tannand, S Kchand enkyu, (2003) 16, 57-62.
-
Bhargava, D.S and Sheldarkar, S.B., Water Research, (1992) 27, 303-312.
-
Shivani Bharwaj and Mukhar, A. Khan, Indian J. Chem. Tech., (2004) 11, 1256-1240.
-
Woon, Sin, Ahn, Kwangsoonlee and Hyuntai kwak, Journal of Korean chemical society
-
Mingtingxu and E. Iglesia J. Phy. chem., B. (1998) 102, 961-965.
-
Net Pradit, S., Thiravetyan, P. and Towprayoon,S., Water Res., (2003) 37, 945-952.
-
Chitin G.Annaadurai, M.Chellapandian and Krishanan Environmental monitoring and assessment (1999) 59(1), 23-40.


