Graphical representation and classification of surface water in the lower alluvial plains of Narmada valley, between Khalghat and Harinphal
V.K. Parashar1 *
1
Department of Geology,
Govt. Motilal Vigyan Mahavidyalaya,
Bhopal,
India
http://dx.doi.org/10.12944/CWE.1.2.16
The present study mainly concerns the classification and graphical representation of surface water in the lower alluvial plains of Narmada Valley between Khalghat and Harinphal in Madhya Pradesh. In all 18 (Eighteen) surface water samples have been collected from the ferry points and analysed by using the methods proposed by APHA (1985). The chemical analysis data have been graphically represented in Piper’s trilinear diagram, Modified Trilinear diagram and Wilcox diagram. On the basis of diagrams the surface water is dominated by Calcium-Bicarbonate type and does not have any Bicarbonate Hazard.
Copy the following to cite this article:
Parashar V.K. Graphical representation and classification of surface water in the lower alluvial plains of Narmada valley,between Khalghat and Harinphal. Curr World Environ 2006;1(2):185-188 DOI:http://dx.doi.org/10.12944/CWE.1.2.16
Copy the following to cite this URL:
Parashar V.K. Graphical representation and classification of surface water in the lower alluvial plains of Narmada valley,between Khalghat and Harinphal. Curr World Environ 2006;1(2):185-188. Available from: http://www.cwejournal.org/?p=1036
Download article (pdf)
Citation Manager
Publish History
Introduction
Water is essential for all living for their existence. Water is needed not only for domestic use but also for the growing needs of any nation for its better agricultural growth. On the surface of the earth, the largest available sources of fresh water are lakes, streams and groundwater. In India, specially in Madhya Pradesh the farmers mostly depend on rainwater and surface water for irrigational purpose. In M.P. lower alluvial plains of Narmada Valley is the most important amongst the upland valleys form the point of view of agriculture. The area of present study lies between Latitude 22° 15’20’ and 20°’2’30" North and Longitude 75°27’15" and 74° 41’21" East, extending stretch of about 84 Km. from Khalghat to Harinphal. The study area falls in the top sheets Nos. 46 N/4, 46N/ 8, 46J/12 and 46J/16.
Experimental
In the present study 18 (Eighteen) surface water samples were collected from the ferry points of Narmada river. The collected water sample were analysed by using standard procedures as suggested by APHA (1985). A variety of graphical representation methods are used to classify water into Modified Triliner types. In the present study Piper’s Trilinear diagram and Modified Trilinear diagram after Piper’s (1944) and Romani (1981). Have been used to classify the surface water. The concentration of major cation and anions have been converted into me/1 and percent reacting values of each ion have been computed and presented in Table-1. These percent reacting values of surface water have been plotted in Piper’s Trillinear diagram and Modified Trilinear diagram. Plotting in various diagram are shown in Fig. 1,2,3.
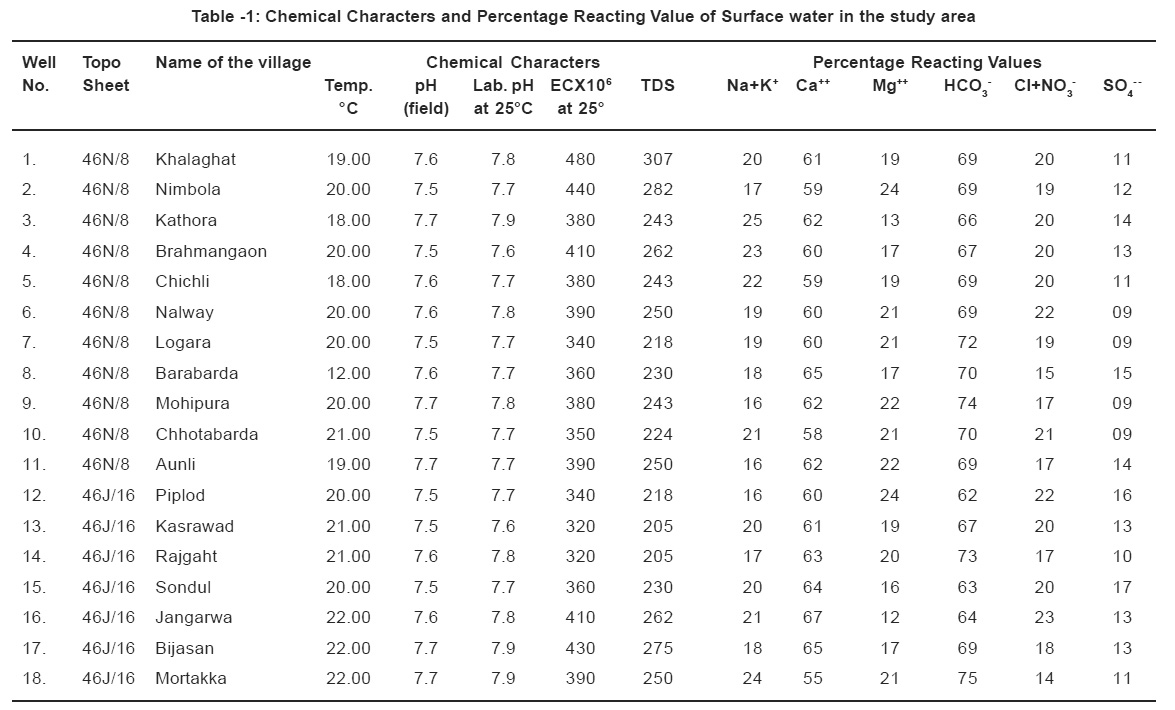 |
Table -1: Chemical Characters and Percentage Reacting Value of Surface water in the study area Click kere to view table |
Results and Discussion
It is observed form the Table 1 that the pH of surface water varies between 7.6 to 7.9 suggesting midly alkaline in nature while the specific electrical conductance varies between 205 to 307 mmohs/cm at 25°C, indicating that the surface water of the area has low concentration of salts in solution.
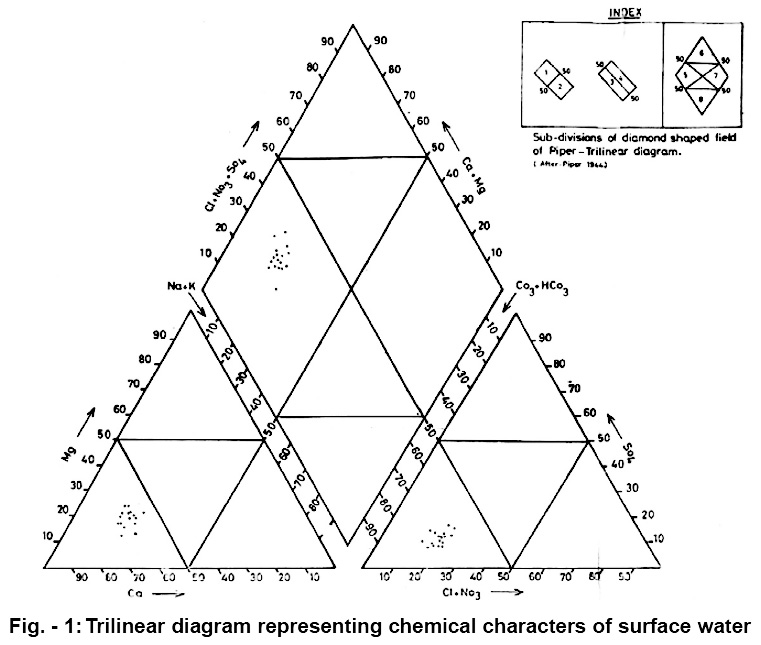 |
Figure - 1: Trilinear diagram representing chemical characters of surface water Click kere to view figure |
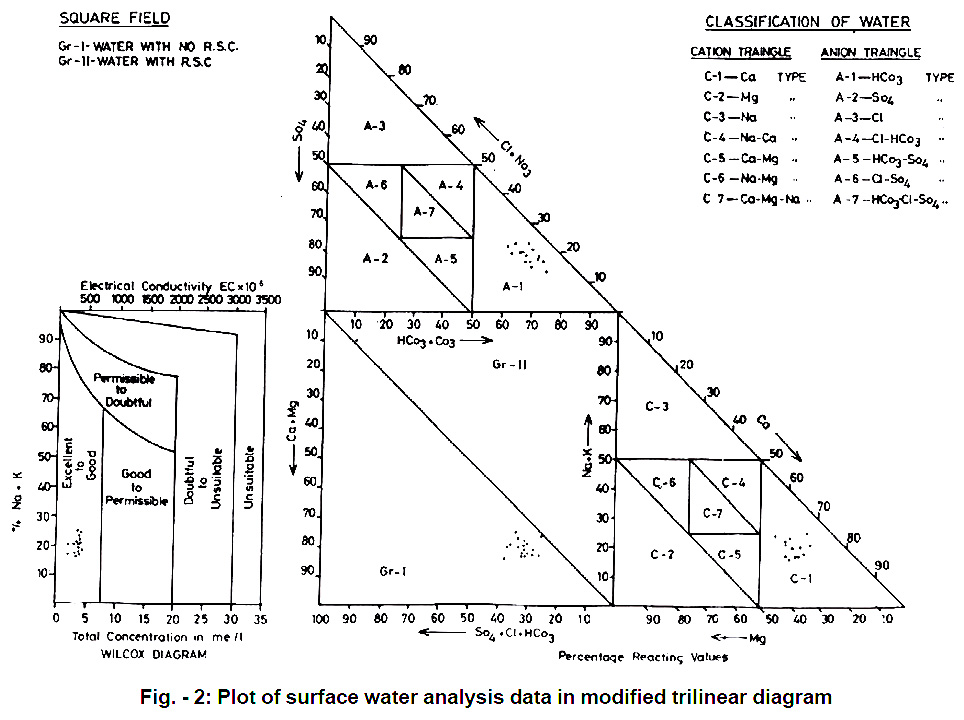 |
Figure - 2: Plot of surface water analysis data in modified trilinear diagram Click kere to view figure |
It is seen form the Piper’s Trillinear diagram that all the surface water samples fall in field No. 1 3 5 and thus the hydrochemistry of surface water is dominated by alkaline earth, weak acids and carbonate hardness exceeding 50%; which is of temporary nature (Figure - 1). The chemical analysis plotted in Modified Trilinear diagram after Romani (1981) reveal that the surface water samples of the study area falls in field C-1 and A-1, which shows that the surface water belongs to Calcium-bicarbontate type. Surface water samples fall in Gr.I of central square field which indicates that the surface water are not associated with any bicarbonate hazards. When the central field plotting extended in Wilcox diagram, it is noticed that all the surface water fall in excellent to good range of irrigational water (Figure - 2).
Conclusion
On the basis of chemical characters and graphical representation of hydrochemistry of surface water in Pipers Trilinear diagram and Modified Trilinear diagram, it can be concluded that the surface water of the study area is dominated by calcium-bicarbonate type and it does not have any bicarbonate hazards. As per Wilcox diagram it belongs to excellent to good range. Hence the surface water can be applied fruitfully for irrigational purpose for all types of crops.
References
- APHA, American Public Health Association, Standard methods for the examination of water and waste water; 16th edition, Washington D.C., (1985) 1-1268.
- Collins W.D. Graphic representation of analysis, Ind. & Eng. Chem., (1923) 15, 394.
- Piper A.M., A graphic procedure in the geochemical interpretation of water analysis, Amer. Geophy. Union Trans. (1944) 25, 914-423.
- Romani, S. A new diagram for classification of Natural water and Interpreatation of chemical analysis data, International symposium on quality of water the Netheland.(1981).
- Wilcox, L.V. Classification and Use of Irrigation Waters, USDA Circ. 969, Washington DC, (1955) 19.


