Analysis of Asan River Water Quality During Post Monsoon Using Physico-Chemical Parameters in District Dehradun
Mitasha Kaushik
*
 and Manish Sharma
1
School of Science and Technology,
Jigyasa University (Formerly Himgiri Zee University),
Dehradun,
Uttarakhand
India
Copy the following to cite this article:
Kaushik M, Sharma M. Analysis of Asan River Water Quality During Post Monsoon Using Physico-Chemical Parameters in District Dehradun. Curr World Environ 2025;20(1).
Copy the following to cite this URL:
Kaushik M, Sharma M. Analysis of Asan River Water Quality During Post Monsoon Using Physico-Chemical Parameters in District Dehradun. Curr World Environ 2025;20(1).
Citation Manager Publish History

Introduction
With increasing in industrialization and growing population, sources of surface water are becoming restricted globally in past few decade, predisposing water sources drops by both quality and quantity.1 Tragically, excessive use with lacking of appropriate strategies together with improper application of fertilizers and agro-chemicals that dissolves into the water together with overuse with absence of adequate regenerate, these variables are accelerating up the rate of water quality.2 Additionally, the rapid rate with which ammonia amount is circulates among the environment, ground, air, water and living has been significantly accelerated by contemporary human endeavor.3
Anthropogenic human sources such as unpurified industrial waste, inappropriately dealt with household waste, and agricultural runoff surface play major and common causes of water pollution and declining water quality.4,5 The wastes created by humans how and natural processes such as seasonal variations in rainfall and increasing or decreasing temperature impact the River water quality and affect every different characteristic for different seasons.6
The Dehradun, Uttarakhand, India, has many industrial units constructed around the rivers or other water bodies, and the area is still in the process of urbanization and Industrialization. Untreated waste from factories is explicitly or implicitly discharged into rivers causing pollution in river water.5 Both trash and garbage made by people in daily use around their locality adversely affected the qualitative parameters of river water in the Dehradun district in the last couple of generations.4, 5
The Asan River is one of the streams of River Yamuna flowing within the capital of Uttrakhand in India. This river copes with severe water, air, and other environmental problems that have become biotic and water-related stubborn.4 Synthetic medicine Factories manufacturing complex/facilities, staple, rubber, Cloth, mucilage, organic or inorganic chemical, paper, and synthetic medicines manufacturing, as well as petroleum refineries, and the places from where skin and hides are tanned, and heavy settlements circulated this river.7 Researcher found the fact that around 72 different chemicals have been employed during the manufacturing process of coloration or dying process which are toxic utilize in the manufacturing sectors to color fabric, textile related and other materials. Within these 30 chemicals are highly poisonous and unsafe that cannot be eliminate or remove or washed off by the treatment as well as technology. As an outcome manufacturing sectors such as industries as well as shops that are dealing with dyeing component mostly those who were near the bank of river, eliminate the waste they produced right away into the water of the river.4,6 As a result, a compound mixture of many organic and inorganic chemicals from industries with household wastes are released into the Asan River increasing the decline in water quality and creating danger for all lives utilizing and all that lives inside the river. In the days with no rainfall or dry periods’ season with the least amount of discharge, the water level also decreases due to high dry, heat, or high evaporation, and the condition of water worsens compared to seasons with rainfalls and wet periods.8 Obviously, household wastewater, Industrial and agricultural spill releases contribute to eutrophic development.9,10 Degradation of forests can contribute to accumulation and nutritional accumulation in the tributary.
Assessing and monitoring the standard of water in huge river tributary like Asan River can results to the formation of profound statistical database. Numerous analysis already displayed the advantages of variance based numerical analyzed to assessing geographical disparities in basin water standards.11 Accordingly, the aim of the present study was employed multiple- variable statistical data analysis to explain and understand the physiological and chemical features of Asan River completely. The conclusion of the study would provide valuable understanding for action and decision making concerning maintenance of the river.
locations
Zone
The purpose of the current study was perform to analyze the pollution level in quality of Asan River water with locations (starting to ending point)in the Dehradun district, which lies on the longitude 77°40' to 78°0'E and latitude between 30° 15' to 30° 27N lies from the NorthernShivalikrange between the Himalayas Hills (Image 1).
Yamuna River is the largest rivers present in India. Asan River is second main tributary of the Yamuna River, which flows northwest of the Doon Valley. Doon Valley has a different climate feature. In summer season, the mean temperature is from 17°C and 36°C, and in winter months, the temperature is minimum 24°C to a minimum of 6°C in winter season sometimes. Annually, the area receives an average rainfall of 2073mm; almost all annual rainfall is received from the months of June to September during months. Although, the months from July to August have most rainfall occurs. Asan River has devout significance of Hinduism. According to Hinduism mythology the evidence from Rig Vedas, it is called Asmavanti (currently the home spot of the Asan River, i.e., Gautama Kund, Chandrabani Temple, near Gautam Kund nearby Dehradun. In this research, sampling is done from five different locations of Asan River from the location 29°58' and 31°2'30’’ N Latitude and 77 °34’45’’ and 78°18’30’’ E longitude that are discussed as Site 1 to Site 5 can be seen from image 1. Sample collection locations:
Site 1: (S-1) Herbertpur Asan Bridge area located in Dehradun, Uttrakhand, India between 77°4312.60’’ E and 30°25’44.60’’ N.
Site 2:(S-2)Rampur area in Dehradun, Uttrakhand, India, between 77°8230084’’ E and 30°25’44.60’’ N.
Site 3: (S-3) Dhoolkot area in Dehradun, Uttrakhand, India, between 77°8840606’’ E and 30°3394825’’ N.
Site 4: (S-4) Premnagar area located within the Dehradun, Uttrakhand, India between 77°9548893’’ E and 30°3424044’’ N.
Site 5: (S-5)Gajiyawala (Birpur) in Dehradun, Uttrakhand, India between 78°0413942’’ E and 30°3686875’’ N
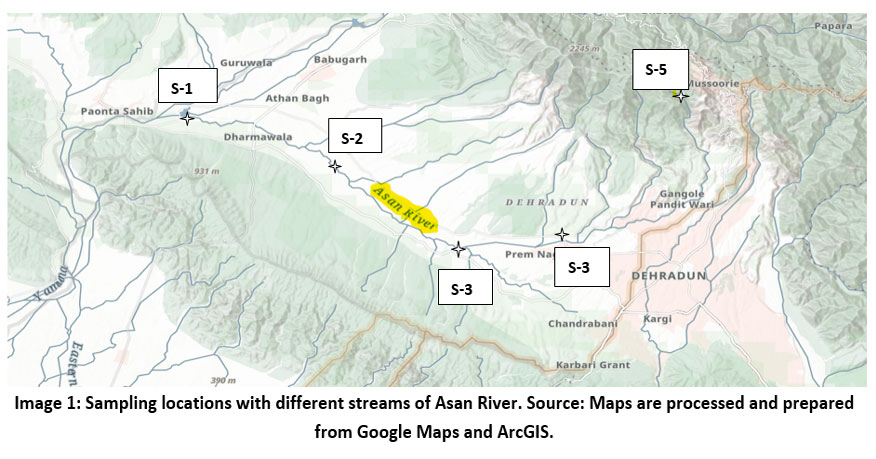 | Image 1: Sampling locations with different streams of Asan River. Source: Maps are processed and prepared from Google Maps and ArcGIS.
|
Materials and Methods
The sample was collected from five different locations from the point the Asan River begins (Herbertpur Asan Bridge) till the Asan River ends (Gajiyawala (Birpur) pkl bridge in post-monsoon season (seasons selected according to IMD). The Doon Valley along the Asan River in 2-liter sterile polyethylene bottles gathered from five dissimilar sampling locations. Sterile HDPE bottles were used to sample water from the Asan River and stored at 40C in the laboratory to study the parameters. Sampling was done from the five locations discussed above using standard sample procedure (IS: 2498, 1966 – Part-I and APHA).
Table 1: All the parameters that had been used in the study with the equipment used in the analysis of all parameters with the references of methods used in the research study
S.NO. | Name of Parameter | Equipments used | References |
Temperature | Thermometer | APHA – 2012 | |
pH | pH meter | APHA -4500 B | |
Turbidity (NTU) | Nephlometric meter | IS: 3025(P-10:1984) | |
Alkalinity | Titration | APHA -2320B | |
Total Hardness | EDTA Titrimetric Method | APHA -2340C | |
Calcium as Ca (mg/l) | Titration from EDTA | APHA -3500 | |
Magnesium (mg/l) | Complex metric titration | APHA -3500 | |
BOD (mg/l) | 5-Day BOD Test Method | APHA -5210B | |
TDS (mg/l) | Water sample Dried at 1800C Method | APHA-2540C | |
TSS (mg/l) | TSS Dried at 103-1050 C Method | APHA 2540D | |
Sodium (as Na+) | Flame Photometer | IS: 3025(P- 45- 1993) | |
Potassium (as K+) | Flame Photometer | IS: 3025(P- 45- 1993) | |
DO | Winkler’s Iodometric method | APHA 4500-O B | |
COD | Open Reflux Method | APHA 5220B | |
Electrical Conductivity | Electrical conductivity meter | APHA 2510B | |
NO3 | Spectrophotometer | : 3025(P- 34): 1988. |
After analysis, the samples are compared to different standards such as WHO, CPCB, and BIS to ensure the readings of results and whether the quality of water matches the standards given by the government.
Water Quality Index
Simple Water Quality Index Calculator” is the index that is created by Purdue University, a water management calculator tool given by sustainable water management in Arequipa region, representing the results of post monsoon quality of water by using only five variables, such as The BOD, the temperature, TSS, Conductivity and DO. The index calculator is to be had online: https://www.agry.purdue.edu/hydrology/projects/nexus-swm/en/Tools/WaterQualityCalculator.php.28
Simple water quality index (ISQA)
The value of temperature matrix instances for the remaining four index scores determines that how ISQA is calculated:
ICOND+IBOD+IDO+ ITSS = ISQA --------equation (1)28
Equation 1 is use to determine ISQA, whereas multiple index phrases using unique grading consideration for every variable have been designated using the acronyms – ICOND, IBOD, IDO, ITSS and ITEMP, precisely displayed on the opposite of ISQA, grade encompasses, extends from 0 to 100, with100 represented excellent water quality.28
Water Temperature Index (ITEMP)
All living things including aquatic creatures have an ideal temperature assortment and whenever the temperature increases, a small amount of creatures becomes visible. Although greater temperature can retains little oxygen in its composition, the water’s temperature can retain little oxygen in its composition; water’s temperature has an enormous effect on chemical composition of water. The range of measurement of the water temperature index is 0 to 1 for each single degree whenever the water temperature increases in temperature become beyond 200 C, the temperature index drops from 1.28
Biological oxygen demand index (IBOD)
The total quantity of oxygen demanded for bacteria to breakdown decaying matter insides the water is referred to be known as BOD. An elevated BOD signifies that there has been an excess of naturally occurring pollution with the water, that may represents an evidence of sewerage or another substances has entered to it.
BOD= 0 mg/l generated IBOD to attains a maximum at 30, IBOD for BOD concentration exceeding 12 mg/l.28
Total Suspended Solid Index (ITSS)
The amount of particulate suspended in the water defined as TSS, it often transported through towns or cities and can causeby surface level deterioration. In conjugation with possibly carrying toxic substances, these particulate matters may disturb system of irrigation as well as water consumption detoxification. The ITSS level approximately 25 where TSS is equivalent to 0mg/l.
ITSS= 0 for concentration of TSS concentration >250 mg/l.28
Dissolved Oxygen Index (IDO)
The total quantity of the oxygen presents that aquatic organism as well as animals can consume beneath the surface is detected by the amount of oxygen dissolved, such creatures Can be terminated through low level of power. Whenever oxygen dissolved goes higher than 10 mg/l, then IDO hits maximum of 25.
IDO= 0, when DO concentration = 0 mg/l.28
Conductivity Index (ICOND)
The water resistance comprises an assessment of its capability to conduct electricity. It has nothing to been associated with degree of dissolved salts that dissolves in water. Crops might to be affected by water that includes significant concentration of salts.The conductive value of water to be consumed is 200 ?S/cm, ICOND approaches a concentration of 20.
ICOND= 0 at conductivity measurement level above 4000 ?S/cm.28
In the end, all the parameters of Asan River water find out by using Water index given five estimated classification. It is simple type of index describes the results after the above calculation to examine the water quality.
Outstanding - (91-100)
Good -(71-90)
Normal -(51-70),
Fair -(26-50)
Bad -(0-25).31
Statistical analysis
The information gathered after the methods were applied to evaluate by help of statistical techniques. A collection of mathematical methods covering lowest, highest, std. deviation, Correlation and Principal Component Analysis (PCA)Calculator have been use to analyze and illustrate how environment is related to aspects connected to propagate groups, communities and societies at diverse areas across the Asan River.
Results
Table 2: All the parameters that had been studied in the study with the outcome of results after examining water samples from Asan River from sites such as site-1 to site 05 during post-monsoon season.
POST- MONSOON | ||||||
Sl.No. | Variables | Site-01 | Site-02 | Site-03 | Site-04 | Site-05 |
Temperature (o C) | 18.8 | 19.0 | 18.6 | 18.4 | 18.3 | |
Ph | 7.5 | 7.3 | 7.2 | 7.8 | 8.0 | |
Turbidity (NTU) | <1.0 | <1.0 | <1.0 | <1.0 | <1.0 | |
Total alkalinity (mg/l) | 232.7 | 242.3 | 247.2 | 300.2 | 315.3 | |
Total Hardness (mg/l) | 147.8 | 159.2 | 152.4 | 174.2 | 203.4 | |
Calcium(mg/l) | 43.9 | 44.4 | 45.0 | 46.30 | 48.3 | |
Magnesium(mg/l) | 23.2 | 20.2 | 21.3 | 23.9 | 24.3 | |
DO (mg/l) | 5.2 | 5.6 | 5.3 | 5.2 | 5.4 | |
COD (mg/l) | 4.3 | 4.6 | 5.1 | 4.5 | 3.9 | |
BOD (mg/l) | 3.4 | 3.4 | 3.1 | 3.2 | 3.0 | |
TDS (mg/l) | 573.2 | 575.4 | 545.3 | 570.3 | 589.3 | |
TSS (mg/l) | 450.5 | 430.2 | 442.3 | 500.2 | 520.5 | |
Sodium (mg/l) | 18 | 25 | 23 | 27 | 36 | |
Potassium (mg/l) | 3.8 | 6.5 | 6.0 | 6.7 | 7.8 | |
Electrical Conductivity .(µm hocm-1) | 0.493 | 0.470 | 0.439 | 0.344 | 0.477 | |
Nitrate | 2.1 | 3.1 | 2.9 | 5.5 | 6 | |
Water Quality Index
Table 3: The calculation of WQI of all stations along with their average values of station taken in research work.
Site-01 | Site-02 | Site-03 | Site-04 | Site-05 | Average of all sites | Average WQI | |
Temperature (o C) | 18.8 | 19 | 18.6 | 18.4 | 18.3 | 18.62 | - |
Electric conductivity | 493 | 471 | 439 | 344 | 477 | 444.8 | - |
BOD (mg/l) | 3.4 | 3.4 | 3.1 | 3.2 | 3 | 3.22 | - |
DO (mg/l) | 5.2 | 5.6 | 5.3 | 5.2 | 5.4 | 5.34 | - |
TSS (mg/l) | 450.5 | 430.2 | 442.3 | 500.2 | 520.5 | 468.74 | - |
WQI | 53 | 57 | 54 | 56 | 56 | 54 | 55.2 |
Statistical analysis
The information gathered after the methods were applied to evaluate by help of statistical techniques. A collection of mathematical methods covering Correlation and PCA have been use to analyze and illustrate how environment is related to aspects connected to propagate groups, communities and societies at diverse areas across the Asan River.
Table 4: All the parameters with correlation to each other been studied in the study with the outcome of results after examining water samples from Asan River from sites such as site-1 to site 05 during post-monsoon season.
Temp | pH | Turbi | Alkali | TH | Ca | Mg | DO | COD | BOD | TDS | TSS | Na | K | E c | NO3 | |
Temp. | 1 | |||||||||||||||
pH | -0.76 | 1 | ||||||||||||||
Turbi | 0.26 | 0.38 | 1 | |||||||||||||
Alkal | -0.88 | 0.89 | -0.02 | 1 | ||||||||||||
TH | -0.75 | 0.86 | 0.13 | 0.93 | 1 | |||||||||||
Ca | -0.87 | 0.83 | -0.06 | 0.95 | 0.97 | 1 | ||||||||||
Mg | -0.79 | 0.89 | 0.29 | 0.71 | 0.61 | 0.65 | 1 | |||||||||
DO | 0.44 | -0.23 | 0.11 | -0.10 | 0.16 | 0.01 | -0.62 | 1 | ||||||||
COD | 0.36 | -0.83 | -0.77 | -0.55 | -0.69 | -0.56 | -0.7 | -0.02 | 1 | |||||||
BOD | 0.86 | -0.48 | 0.51 | -0.72 | -0.7 | -0.83 | -0.45 | 0.13 | 0.13 | 1 | ||||||
TDS | -0.17 | 0.73 | 0.81 | 0.49 | 0.66 | 0.49 | 0.48 | 0.28 | -0.94 | 0.02 | 1 | |||||
TSS | -0.90 | 0.96 | 0.12 | 0.95 | 0.89 | 0.91 | 0.8 | -0.29 | -0.68 | -0.67 | 0.55 | 1 | ||||
Na | -0.68 | 0.72 | -0.01 | 0.88 | 0.97 | 0.94 | 0.42 | 0.32 | -0.54 | -0.73 | 0.56 | 0.78 | 1 | |||
K | -0.55 | 0.48 | -0.27 | 0.78 | 0.81 | 0.81 | 0.14 | 0.45 | -0.22 | -0.67 | 0.31 | 0.58 | 0.9 | 1 | ||
Ec | 0.44 | -0.21 | 0.45 | -0.44 | -0.11 | -0.21 | -0.23 | 0.40 | -0.28 | 0.20 | 0.26 | -0.34 | -0.1 | -0.3 | 1 | |
NO3 | -0.82 | 0.85 | -0.03 | 0.99 | 0.92 | 0.93 | 0.64 | -0.01 | -0.52 | -0.68 | 0.50 | 0.92 | 0.8 | 0.8 | -0.4 | 1 |
The highlighted bold letters (quantity > 0.75) are most correlated coefficients.
Table 5: Principal Component Analysis (PCA): Eigenvalues with % of Variance and Cumulative (%).
Eigenvalues | |||||
Parameter | PC? | PC? | PC? | PC? | PC? |
Eigenvalue | 4.9635 | 0.03253 | 0.003265 | 0.0006501 | 0.00002215 |
% of Variance | 99.2706 | 0.6506 | 0.06531 | 0.013 | 0.000443 |
Cumulative (%) | 99.2706 | 99.9212 | 99.9866 | 99.9996 | 100 |
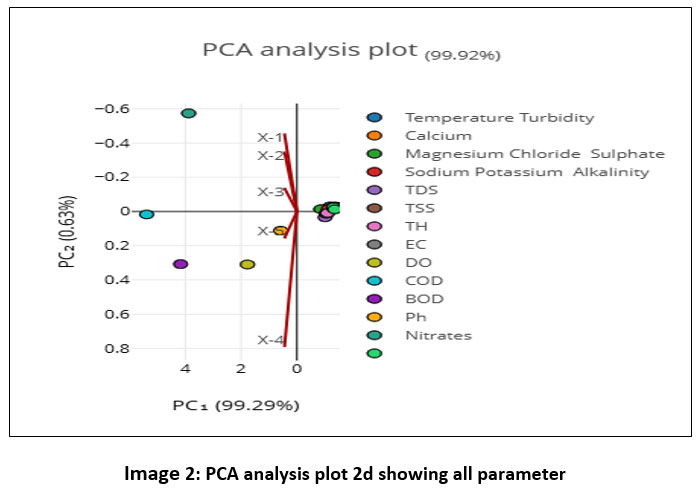 | Image 2: PCA analysis plot 2d showing all parameter
|
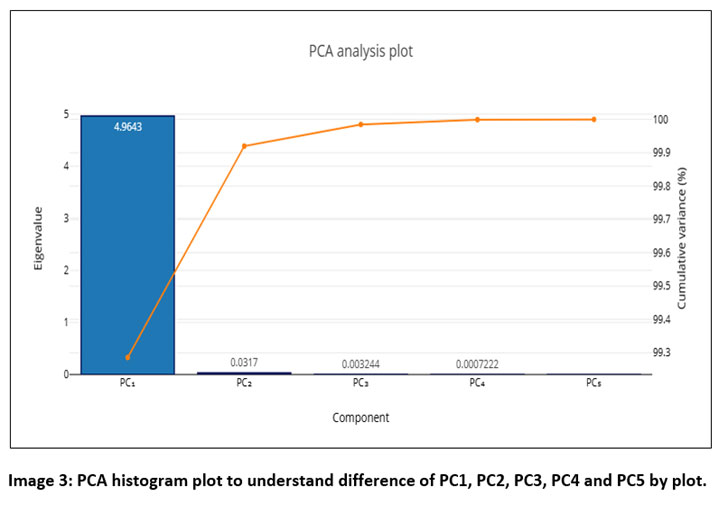 | Image 3: PCA histogram plot to understand difference of PC1, PC2, PC3, PC4 and PC5 by plot.
|
The eigenvalue depict the variance of key elements, while the initially calculated variance is depicts across the covariance line of the matrix vertical. The total variation throughout the every dimension is 5. The 2 main elements explained 99.92% of variance, while the original 2 dimension contributes for 40% (2). (4.963). Scree plots in table represent geographical the eigenvalues of principle components.
Discussion
Physiochemical components
The findings in present study, the temperature ranged between 19.2 to 20.60C from S-1 to S-5 in post-monsoon season. Similar study12 on river Ganga in Varanasi and states that temperature has a significant impact on all physic-chemical and biological parameters and states that temperature remains higher during April and July rather than October to December and Temperature also impacts in the ascertainment of another component like pH, electrical conductivity, gases mixed and another formulation of alkalinity.
The pH ranged between 7.2 to 8.10, Indicating slightly alkaline the acidity level nearly in all investigating sites found to be below the WHO advices ranged of drinking water within 6.5 to 8.5. Additionally, the volume of DO in water is affected by several parameters, including chemical makeup, the biological activities, pressure and temperature.13 In current finding the DO values varies in 5.2 to 5.4, nearby the water samples from all five stations are within the advisable limits. Fortunately, the value of DO is important for all physiological aquatic survive. Higher DO will maintain diversity in biology. The criteria of BOD are essential when assessing ground and as well as surface water pollution carried on by dumping of both commercial and household wastes. In the current findings the BOD values 3.0 to 3.4 within WHO advisable standard lower than 5 mg/l on all sampling sites. The dropped in the BOD value is due to the reduction of waste water and decline in organic wastes.14
Turbidity in Asan River water recorded as less than 1.0 in all stations, within the WHO advisable limit, during post-monsoon season.15,16 explains that the reason for increased turbidity is the flow of deposits from areas around and disturbed flow that agitate with sediments and gravels beneath the River. Other rivers also reported high turbidity in the monsoon season. In finding the nitration value (NO3-) found to be between 2.1 to 6 with the advised range by WHO standard. The human activities and agricultural chemical addition to the fields near river causes presence of nitration.17
After evaluation of samples sodium ranged within 18.2 to 36.3 and 3.8 to 7.8 mg/l, both are higher than the advised WHO standard limits. The Sodium and potassium or other alkali substances added in higher amount risks in applying water for irrigation is identified by unconditional and relation concentration in order of ion and are declared in terms of SAR which stands for sodium absorption ratio, calculated and estimated value of risky sodium level. Excessive sodium and potassium are results of accidental effects of modifying properties of soil with reducing penetration.18Significant concentration of sodium and potassium leads to expansion of alkalinity to the soil.
The total alkalinity examined value within 232.7 to 315.3 in advised WHO standard.It is the ability to neutralize the acid value. It is important that bicarbonates, carbonates, and oxidized hydrogen compounds signify the number of components present in them. The repeated value of alkalinity shows a clue of the alkalinity-producing capacity of water. Human activities like bathing, washing, etc, increase the alkalinity of water.19
The total hardness evaluated between 147.8 to 203.4 mg/l, out from suggested limit by WHO standard. The higher levels of hardness of water are caused by discharges from soils with severs quality limit given by WHO as 150mg/l.20If the total hardness of water is 50ppm, then water is said to be soft. If hardness rises more than 300, it is acceptable for domestic use, and 2 to 80ppm hard water is used in boiler feeders, if this limit is more than 150 then water can be used in agriculture stated by Das.21Calcium varies between 43.9.2 to 48.0 whereas magnesium from 20.2 to 24.3 mg/l, within the advisable and permitted limits given by WHO standards in all locations. The hard water depends upon the presence of Ca and Mg ions present in it. Carbonates of magnesium are lesser than constituents of calcium every time. Hyper focus of magnesium is not desired in household water as scale formation occurs.22
Electrical Conductivity analyzed within 344 to 493?S/cm, which exceeded the limit of advisable WHO standard The ability of compound or components to except electrical current flow and it is reversible of resistance. The existence of Electrical Conductivity is affected by additional chemical in river water.23 The quality of electrical conductivity measure the compares ion of one amount to another between quality of water in reservoir.25
TSS (total suspended solid) results in between 430.2 to 520.5mg/l, higher than the normal advisable range suggested by WHO standard and TDS (total dissolved solids) examined between 545.3 to 589.3 mg/l which states that the TDS of all the sites from S1-S5 were in higher limit advisable standard. TDS of Narmada River is studies by Hasan et al., and recorded TDS 136–360 mg/l Singh14 and Almeida et al.,18 tested 156–582 mg/l for Funes River and explained that ejection of sewerage and human activities are the reason for this.5
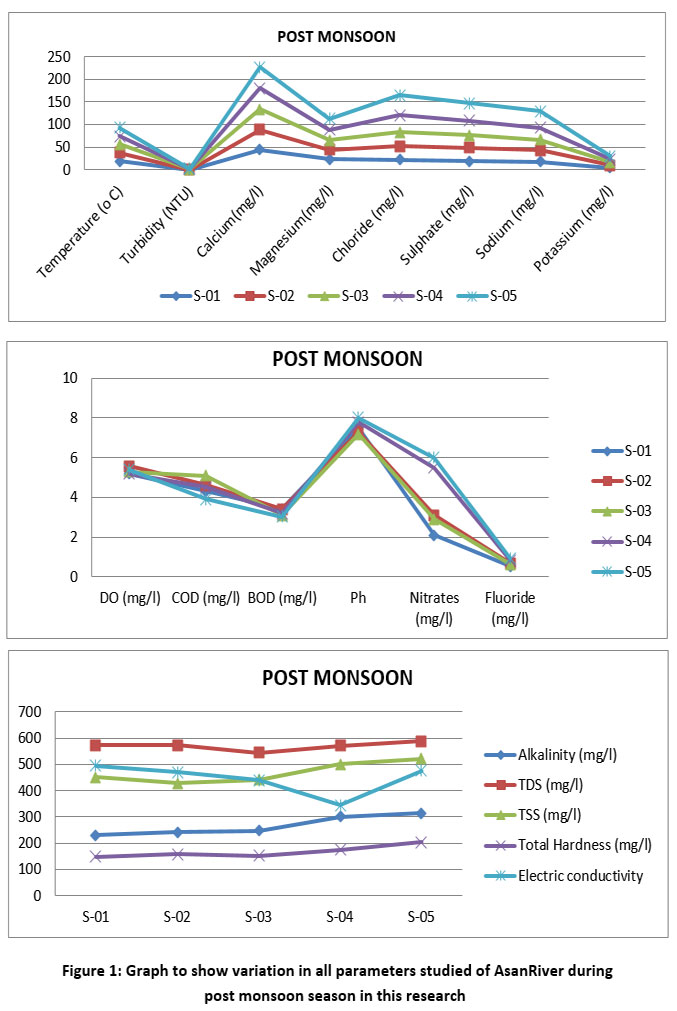 | Figure 1: Graph to show variation in all parameters studied of AsanRiver during post monsoon season in this research
|
Water Quality Index
According to measurements that are updated underlying the online platform drawing from newly categorizing in the form of five aquatic standard categories into- Heavy polluted, moderately polluted, little polluted, good quality and excellent quality of water. Subsequently, the dimensions and evaluation for every characteristic exists calculated by employing online water management calculator tool given by sustainable water management in Arequipa region known as “Simple Water Quality Index Calculator” is used to evaluate Water Quality Index of Asan River during post monsoon. It is simple type of index in which outstanding (91-100), Good (71-90), normal (51-70), fair (26-50) and Bad (0-25) are given to examine the water quality. For utilizing this platform using five parameters with its average value is used such as temperature, TSS, EC, BOD and DO to calculate the water quality.28
According to calculation by “Simple Water Quality Index Calculator” for all stations given in table 3signifies that:S-1= 53, S-2=57, S-3=54S-4=56 and S-5=56, whereas total Average WQI of all station was 54.The result after calculation was 54,that highlights that the water quality of Asan River is average not too good.
Reservoir as well as the surface water contamination and problems with sanitation have become harsher as an outcome of growing population cities and industrial lands.27 Instudy28 outcomes shows that lake Skadar’s water cleanliness remains at an acceptable grade considering that it belongs to predominantly between a category of extremely good (WQI 84-89) and outstanding (WQI 90-100) categories. As results28 analysis of the WQI denotes the water of Lake Skadar, present in the mentioned city areas, is of good quality. The average yearly WQI values, the water of Skadar Lake belonged to the variety of very good (84-89) and excellent (90-100), the category of good (72-83, especially in 2017).whereas, data on certain vital factors including inorganic pollution variable are necessary for monitoring surface as well as ground water quality universally and for establishing a integrated WQI, examine and categorization system, they cannot be taken into account by the water quality index method applied in the work.28
The Principal Component Analysis (PCA)
Performed by using PCA calculator online 2D plots with scree plots. It is the key variable impacting the geographical variables in Asan Rivers physical chemical properties were studied using PCA statistical methods. Approximately, 100% of the 16 physico-chemical characteristics associated with Asan River was accounted by 5 principle components PCs which are determined to have eigenvalues more than on table 3.3, with significant positive loadings for turbidity considered positive impacts on turbidity, TSS the 1st PC1 make up 99.27% of the river overall variance in the flowing river water set of data. These variables indicate that erosion of soil occurs in the present study region and the existence of suspended particles contributes to essential discharges of turbidity.19 In a similar manner, significant favorable positive loads on suspended particles and turbidity reported by Vietnamese Mekong Delta region,24 That is produced by erosion of soil from disturbed ground. The enormous impact of cutting down of timber in the Malaysian forests generates deposition on its rivers and lakes.25 the present research indicates that Asan River in Uttrakhand state is not unusual. The neighboring areas timber harvesting operations increased the rivers TSS concentration and leading deposition. The PC1 bears the largest proportion of all around indicating that the primary cause of river water pollution in Asan River is forest activities. The PC2 that is responsible for 0.65% of overall around variability shows substantial adverse overloading on pH and DO with positive overloading on BOD, NO3, nitrogen and organic pollutants. These variables demonstrate that the effluents from ancient building and housing developing homes consists of natural pollutants and the process of decomposition of biological matter is accountable for the adverse outcomes of pH and DO.
In similar manner, the Oiantang River exposed to PCA statistical analyses that demonstrated the main causes of pollution elements in river were TN, NH3H, NO3 and TP.12The release of poultry chicken, meats and other animals wastes, fertilizers that are spilled into the river water and household wastes where have all criticized by the researchers for contamination. In addition, an essential river throughout Greece’s northern region was identified to contained natural components that are favorable changed with COD, TON,BOD,PO4 and TP which demonstrating the effects of commercial industrial and municipality wastes.25
With substantial positive overloading on overall discharge, mean movement, mean dimension and DO and negative overloading on conductance and COD, the PC3 that is responsible for 0.065% total percent of variance indicates that the present diluting of physiochemical oxidized particles in the river water is connected to high amount and high DO material. A large number of non biodegradable elements of the organic matter in the river show increasing COD and BOD proportion in Asan River. The PCA4 displays significant increases in temperature, Ph, conducting and good on transparency, NO3 (0.013 %) of the total variance. If not enough oxygen is present, there is significant higher degree of concentration of organic matter in the river water that may outcome in creation of ammonia and organic acids compounds that mixed to generate hydrogen, the emission of CO2 and sulphur is produced during decomposition,25 Applying PCA to analyze the data additionally demonstrate that both significant variable affecting the variations, were organic pollution amount and temperature. In PC5 (0.0004 %) total percent of variance is presently stressed on NO3 but notable and critically stressed on COD.
Once again, the made up of NO2 in water may have enormous dumping of biological pollutants in river. All PC2, PC4 and PC5 may also be identified as the accumulation of residential wastes contains organic material and chemicals. We can conclude it whether the chemical contamination in Asan River is more significant than contamination because PCS2 has more strong expansive of percent of total variance than PC4 and PC5. According to researcher25, one of the most significant matches the impacting the contrast in the water quality of River Wen Rui Tand watershed in china was polluted by organic impurities that was accompanied by amount of salts and mineral contamination.
Pearson’s Correlation Coefficients
The calculation of Pearson’s Correlation Coefficients is analyzed by using SPSS software presented in table 3.3. It is explained that temperature has strongly positive correlation with BOD (< 0.86) and slightly positive correlation with turbidity, EC, DO and COD. Turbidity has strongly positive correlation with TDS (< 0.80) and slightly positive correlation with Mg, EC, TSS, TH, DO, pH and BOD. Alkalinity has strongly positive correlation with TH, Ca, Cl, TSS, Na and Nitrate (< 0.85). TH has strongly positive correlation with Ca, TSS, Na, K and Nitrate (<0.80). Calcium has strongly positive correlation with TSS, K, Nitrate (<0.80). Magnesium has strongly positive correlation with TSS <0.85 Whereas, EC, DO and COD do not have any strong positive correlation with any other parameters. BOD has strongly positive correlation with temperature (<0.85).TDS has strongly positive correlation with Turbidity (<0.80). TSS has strongly positive correlation with pH, alkalinity, TH, Ca and Mg. Sodium has strongly positive correlation with Alkalinity, pH and Ca (<0.80). Potassium has strongly positive correlation with TH, Ca and K. Nitrate has strongly positive correlation with pH, alkalinity, TH, Ca, TSS and Na (<0.85).
Conclusion
In the research analysis of various seasonal physicochemical and biological parameters of Asan River during post-monsoon season 2024 performed analytically and statistically (Principal Component Analysis (PCA) with Eigenvalues, % of Variance and Cumulative (%), Pearson’s Correlation Coefficients and WQI index) .The study highlighted that quality of Asan River water is not very satisfying, it was average. During study it was found that the pattern of seasonal distribution was found to be affected by various environmental and chemical factors. After the experimental outcomes, the results were compared to the WHO advised standard. After examine water samples from Asan River during post-monsoon season in month of October 2024, it is observed that pH, Calcium, magnesium, BOD Electrical Conductivity, potassium were normal in limit on comparison with WHO guidelines, but other parameters some parameters like alkalinity, sodium, potassium TDS and TSS are higher during post monsoon while statistical analysis shows that water has average quality of Asan River. The correlation of parameters with its values were also noted and discussed how one parameter is related to another and how much statistically. However, all parameters were not in the prescribed limits of drinking water standards. According to which it is mandatory look towards the environment monitoring and work on waste treatment to protect population from health risk.
Acknowledgement
The authors are grateful to University Grants Commission, New Delhi for providing FIP, and Prof. Manish Sharma, dean research Jigyasa University India INDIA, for Providing Necessary Research Facilities. References APHA (1985): Standard Methods for Examination of Water and Wastewater, 20th Edition, American Public Health Association, Washington D. C. At last a special thanks to Saransh Dogra for financial and motivational support during research.
Funding Sources
The author(s) received no financial support for the research, authorship, and/or publication of this article
Conflict of Interest
The authors do not have any conflict of interest.
Data Availability Statement
This statement does not apply to this article
Ethics Statement
This research did not involve human participants, animal subjects, or any material that requires ethical approval.
Informed Consent Statement
This study did not involve human participants, and therefore, informed consent was not required.
Permission to reproduce material from other sources
Not Applicable
Mitasha Kaushik: Conceptualization and Methodology Writing, Data Collection and Analysis, Initial Manuscript writing, Original Draft.
Manish Sharma: Manuscript Review and Visualization, Supervision, Project Administration
References
- Uddin MG, Diganta MTM, Sajib AM, Hassan MA, Moniruzzaman MD, Rahman A ? Olbert IA. Moniruzzaman A. Assessment of hydrogeochemistry in groundwater using water quality index model and indices approaches. Heliyon. 2023;9 (9):e19668.
CrossRef - Nawaz R, Nasim I, Irfan A, Islam A, Naeem A, Ghani N, Irshad NA, Latif M, Nisa UB, Ullah R. Water Quality Index and Human Health Risk Assessment of Drinking Water in Selected Urban Areas of a Mega City. Toxics. 2023;11(7):577.
CrossRef - Ding F, Zhang W, Cao S, Hao S, Chen L, Xie X, Li W, Jiang M.Optimization of water quality index models using machine learning approaches. Water research. 2023;243:120337-120337.
CrossRef - Uddin MdJ, Jeong YK. Urban river pollution in Bangladesh during last 40 years: potential public health and ecological risk, present policy, and future prospects toward smart water management. Heliyon. 2021;7(2):e06107.
CrossRef - Hasan MdK, Shahriar A, Jim KU. Water pollution in Bangladesh and its impact on public health. Heliyon. 2019;5(8):e02145.
CrossRef - Islam J, Akter S, Bhowmick A, Uddin M, Sarkar M. Hydro-environmental pollution of Turag river in Bangladesh. Bangladesh Journal of Scientific and Industrial Research. 2018;53(3):161-168.
CrossRef - Maritime Gateway. Bangladesh Inland Water Transport Authority develops walkways along rivers - Maritime Gateway. Maritime Gateway - South Asia’s Premier Shipping and Logistics News Portal | Published August 26, 2023. Accessed April 9, 2025.
- Ahmed K, Rahman A, Sarkar M, Islam JB , Jahan IA, Moniruzzaman M , Saha B and Bhoumik NC. Assessment on the level of contamination of Turag river at Tongi area in Dhaka. Bangladesh Journal of Scientific and Industrial Research. 2016;51(3):193-202.
CrossRef - Jarvie HP, Neal C, Withers PJA. Sewage-effluent phosphorus: A greater risk to river eutrophication than agricultural phosphorus? Science of the Total Environment. 2006; 360(1-3):246-253.
CrossRef - Soo CL, Ling TY, Lee N, Apun K. Assessment of the characteristic of nutrients, total metals, and fecal coliform in Sibu Laut River, Sarawak, Malaysia. Applied Water Science. 2014;6(1):77-96.
CrossRef - Marinovi? Ruždjak A, Ruždjak D. Evaluation of river water quality variations using multivariate statistical techniques. Environmental Monitoring and Assessment. 2015; 187(4).
CrossRef - Edokpayi JN, Odiyo JO, Popoola EO, Msagati TAM. Evaluation of Microbiological and Physicochemical Parameters of Alternative Source of Drinking Water: A Case Study of Nzhelele River, South Africa. The Open Microbiology Journal. 2018;12(1):18-27.
CrossRef - Simeonov V, Stratis JA, Samara C, Zachariadis G, Voutsa D, Anthemidis A, Sofoniou M, Kouimtzis T. Assessment of the surface water quality in Northern Greece. Water Research. 2003;37(17):4119-4124.
CrossRef - Sharma B, Singh P, Dobhal R. Education on Drinking Water Quality and Its Health Impacts among Students and Community People. American Journal of Educational Research. 2017;5(4):400-408.
- kumari M, L.K Mudgal, Singh AK. Comparative Studies of Physico-Chemical Parameters of Two Reservoirs of Narmada River, MP, India. Current World Environment. 2013;8(3):473-478.
CrossRef - Ravindra B, Subba Rao N, Dhanamjaya Rao EN. Groundwater quality monitoring for assessment of pollution levels and potability using WPI and WQI methods from a part of Guntur district, Andhra Pradesh, India. Environment, Development and Sustainability. Published online October 5, 2022.
CrossRef - Pati SS, Nayak S, Mishra S, Panda BS, Mahala SS, Mohanty SK, Behera R, Mallick N, Murugesan K. A comprehensive study of the estuary sea environment in the Bay of Bengal, near the Mahanadi River confluence. Discover Water. 2023;3(1).
CrossRef - Almeida C, González SO, Mallea M, González P. A recreational water quality index using chemical, physical and microbiological parameters. Environmental Science and Pollution Research. 2012;19(8):3400-3411.
CrossRef - Bilotta GS, Brazier RE. Understanding the influence of suspended solids on water quality and aquatic biota. Water Research. 2008;42(12):2849-2861.
CrossRef - Durfor CN, Becker E. Selected Data on Public Supplies of the 100 Largest Cities in the United States, 1962. Journal - American Water Works Association. 1964;56(3):237-246.
CrossRef - Das A. Multivariate statistical approach for the assessment of water quality of Mahanadi basin, Odisha. Materials Today: Proceedings. 2022;65:A1-A11.
CrossRef - R. K. Trivedy and P. K. Goel, “Chemical and Biological Methods for Water Pollution Studies,” Environmental Publications, Karad, 1984, pp. 1-22. - References - Scientific Research Publishing. Scirp.org. Published 2019. Accessed April 9, 2025.
- R.R. Sanap, A.K. Mohite, Pingle SD, V.R. Gunale. Evaluation of water qualities of Godawari River with reference to physico-chemical parameters. Dist. Nasik (M.S.), India. Pollution Research. 2006;25(4):775-778.
- Phung D, Huang C, Rutherford S, Dwirahmadi F,Chu C, Wang X, Nguyen M, Nguyen NH . Temporal and spatial assessment of river surface water quality using multivariate statistical techniques: a study in Can Tho City, a Mekong Delta area, Vietnam. Environmental Monitoring and Assessment. 2015;187(5).
CrossRef - Ling TY, Soo CL, Liew JJ, Nyanti L, Sim SF, Grinang J. Application of Multivariate Statistical Analysis in Evaluation of Surface River Water Quality of a Tropical River. Journal of Chemistry. 2017;2017:1-13.
CrossRef - Sustainable Water Management. www.agry.purdue.edu. https://www.agry.purdue.edu/hydrology/projects/nexus-swm/en/Tools/WaterQualityCalculator.php.
- Bhateria R, Jain D. Water quality assessment of lake water: a review. Sustainable Water Resources Management. 2016;2(2):161-173.
CrossRef - Dragan Buri?, Mijanovi? I, Miroslav Doderovi?, Mihajlovi? J, Goran Trbi?. Assessment of the environmental quality of Lake Skadar and its ur-ban surroundings in Montenegro. European Journal of Geography. 2023;14(2):76-87.
CrossRef


