A test bed for evaluation of energy efficiency of residential exhaust fans
K.S. Niaki1 , F. Farhani1 * , A. Anvari1 , M. Rezvani1 and J. Mahmoodi1
http://dx.doi.org/10.12944/CWE.2.1.01
A test bed has been designed and constructed for measurement of air flow rate, and Ventilation Efficiency Ratio (VER) of residential exhaust fans. The test bed can provide accurate measurement of air flow rate, fan energy efficiency, and other air flow parameters. The test bed described here will also be useful for improvement of design of residential exhaust fans constructed in the country. Presently, the test bed is being used in an on going project for compilation of standards for consumption and energy labeling of fans in Iran.
Copy the following to cite this article:
Niaki K.S, Farhani F, Anvari A, Rezvani M, Mahmoodi J. A test bed for evaluation of energy efficiency of residential exhaust fans. Curr World Environ 2007;2(1):1-6 DOI:http://dx.doi.org/10.12944/CWE.2.1.01
Copy the following to cite this URL:
Niaki K.S, Farhani F, Anvari A, Rezvani M, Mahmoodi J. A test bed for evaluation of energy efficiency of residential exhaust fans. Curr World Environ 2007;2(1):1-6. Available from: http://www.cwejournal.org/?p=611
Download article (pdf) Citation Manager Publish History
Introduction
The rapid increase in the number of residential exhaust fans used in HVAC systems has resulted in corresponding increase in energy consumption of the residential sector in the country. Therefore, optimization of energy consumption is an important consideration in the design and production of residential exhaust fans. Therefore, design and construction of a standard test bed for estimation of energy performance of this class of fans is an urgent need. The test bed not only provides a platform for performance evaluation of commercially available fans, but also assist researches in their quest for development of new and energy efficient fans.
Li and Heber1 studied motors and controllers for variable speed fans. Ford et al.2 studied performance parameters of fans, having variable frequency prime mover. The worldwide efforts for the design and construction of more energy efficient fans have resulted in the development of standard test procedures and test facilities. In Denmark, Storm and Pedersen3 evaluated the performance of 122 residential exhaust fans, with fans diameter ranging from 600 to 650 mm. Their results, for 1978 to 1992 period, show that the energy consumption of fans of 5000 m3/hr capacity reduced by 51%, while energy consumption of fans of 10,000 m3/hr capacity showed a reduction of about 43%.
Ford and co-workers2, 4-6 at Illinois Univ. (USA), performed tests on fans of 0.91 m diameter. Their results show that the performance of fans, designed and constructed in Northern America region during 1991 to 2003 period, increased appreciably. They have shown that the average air flow rate, measured at 25 Pa (0.10 in. of water), and the Ventilation Efficiency Ratio (VER), expressed as m3/h/W, increased by 14% and 19%, respectively. Similarly, the performance of fans of 1.22m diameter increased by 16%, while their Ventilation Efficiency Ratio (VER) increased by 22%.
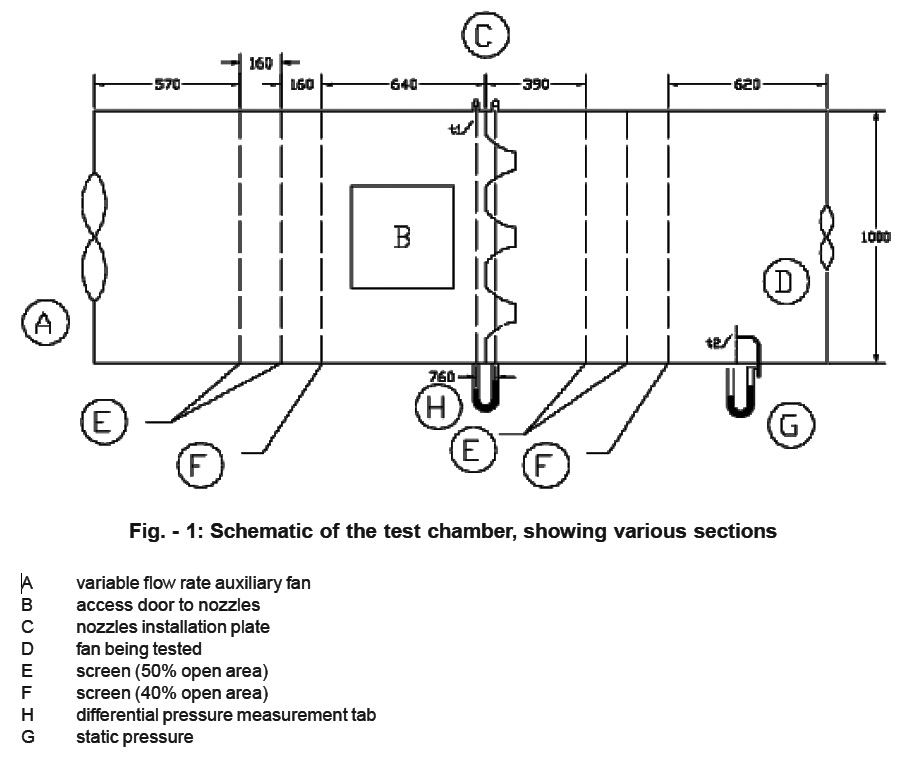 |
Figure 1: Schematic of the test chamber, showing various sections Click here to view figure |
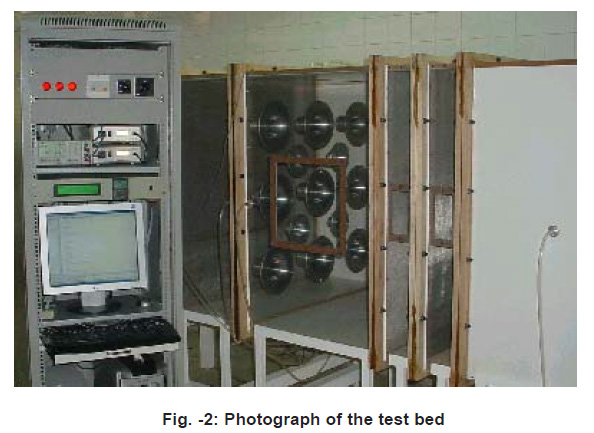 |
Figure 2: Photograph of the test bed Click here to view figure |
The Test Bed
The test bed is capable of measuring flow rates of up to 7600 m3/hr (4500 CFM). The nozzle measurement method, presented in ANSI/AMCA210-99 and ANSI/ASHRAE51-1999 standards7-8, which is fast and can be designed to measure a wide range of flow rates, has been followed for the design of this test bed. Additionally, the inlet chamber condition, in which the test chamber is situated at the suction side of the fan being tested, is selected. Fig. 1 shows the schematic sketch of the chamber, while Figs. 2 and 3 show two photographs of the same test bed, designed and constructed by the authors.
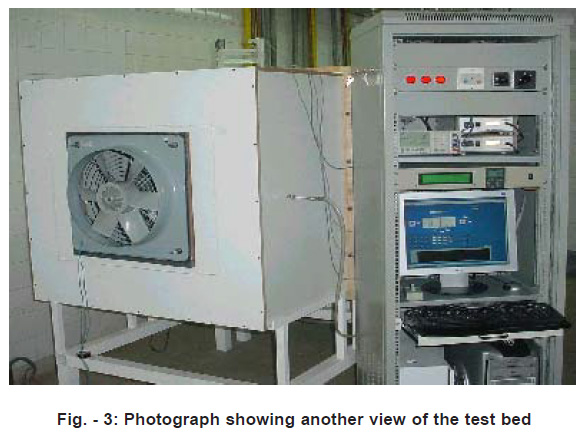 |
Figure 3: Photograph showing another view of the test bed Click here to view figure |
 |
Figure 4: The nozzle support plate Click here to view figure |
A total of 13 nozzles have been designed in accordance with ANSI/AMCA210-99 and NSI/ ASHRAE51-1999 standards. Of these, 9 nozzles have throat diameters of 87 mm, while the remaining 4 are of 40 mm throat diameter. The smaller diameter nozzles can be used for measuring very low air flow rates of up to 68m3/h (for example in low flow rate exhaust fan applications). Fig. -4 shows distances of nozzles from their support plate, and also from one another. Figures 5 and 6 are photographs, showing the front and rear views of the set of nozzles in their support plate.
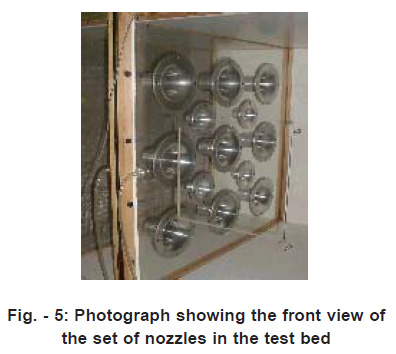 |
Figure 5: Photograph showing the front view of the set of nozzles in the test bed Click here to view figure |
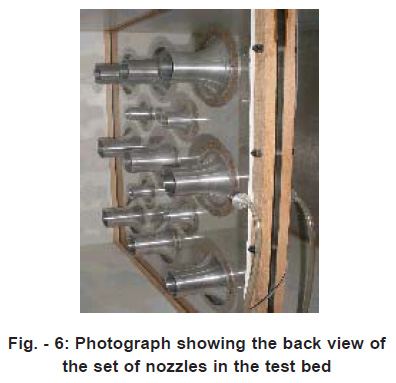 |
Figure 6: Photograph showing the back view of the set of nozzles in the test bed Click here to view figure |
CFD Analysis
Stainless steel screens, placed at top and bottom of the nozzle set, have been used to make the air velocity uniform across the test bed. Two sets, each of three stainless steel screens of 50%, 50%, 40% and 60%, 60%, 40% open area have been used. Using the recommendations in the Standards,7 the maximum air velocity after the last screen, and prior to its entrance to nozzles, at a distance equal to 0.1 times the hydraulic diameter (Dh) of the bed section, should not exceed 1.25 times the average air velocity at that section. CFD analysis has been used to model the air flow distribution in presence of the screens. Figs. 7 and 8 present the air velocity distribution after the screens (placed before and after the nozzles).
 |
Figure 7: Air velocity distribution after the screens (placed before the nozzles) Click here to view figure |
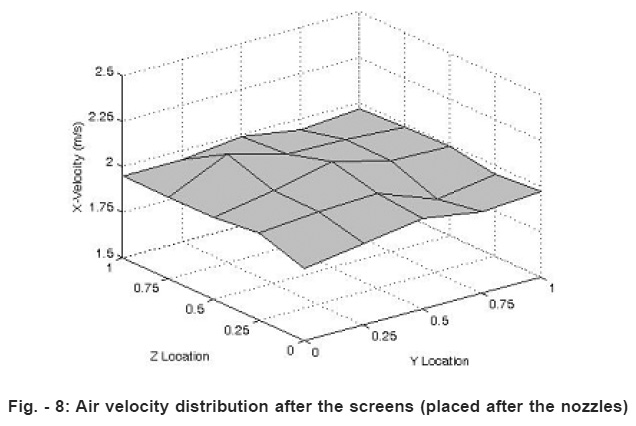 |
Figure 8: Air velocity distribution after the screens (placed after the nozzles) Click here to view figure |
To simplify the analysis, the first compartment of the bed, prior to entrance to the nozzles has been considered. Figs. 9 and 10 show the air velocity distribution across the bed with two sets of three screens of 50%, 50%, 40% and 60%, 60%, 40% open area.
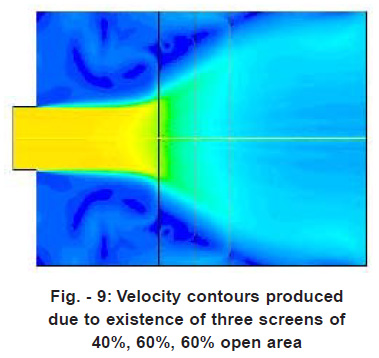 |
Figure 9: Velocity contours produced due to existence of three screens of 40%, 60%, 60% open area Click here to view figure |
Figs. 11 and 12 present the air velocity distribution as function of the distance of the three screens. Due to symmetry of the air flow across the bed, the air velocity distribution has been shown for half of the section. The average velocity across the test bed is 2 m/s. These figures show that the best air velocity distribution is obtained with screens having 50%, 50%, 40% open area. Under this condition, the maximum air velocity exceeds the average velocity by only 13%.
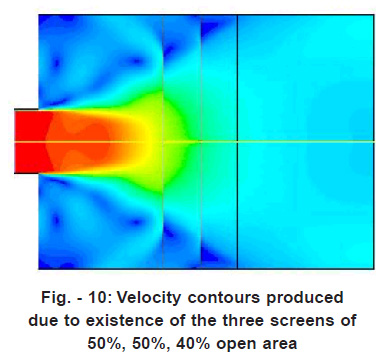 |
Figure 10: Velocity contours produced due to existence of the three screens of 50%, 50%, 40% open area Click here to view figure |
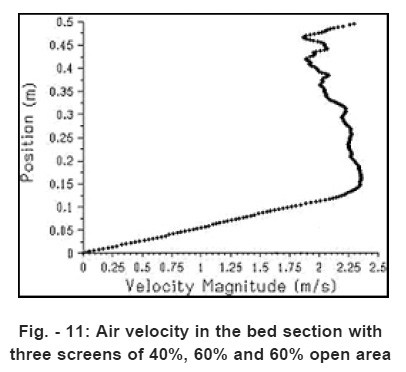 |
Figure 11: Air velocity in the bed section with three screens of 40%,60% and 60% open area Click here to view figure |
Instrumentation
The piezometer rings pressure difference, upstream and downstream the nozzles, and fan static pressure, are measured using an electronic pressure transducer, having an accuracy of 1% the measured pressure value. A psychrometer and a barometer are used to measure ambient conditions during the test. In addition, rotational speed and electric power consumption of the fan under test is measured using a digital tachometer, and an AC power analyzer.
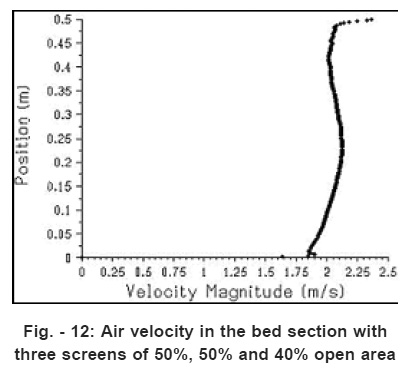 |
Figure 12: Air velocity in the bed section with three screens of 50%, 50% and 40% open area Click here to view figure |
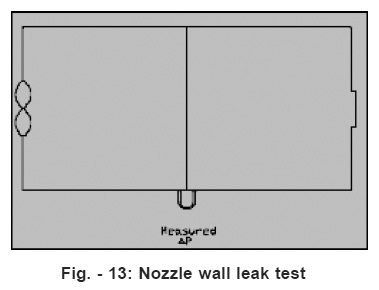 |
Figure 13: Nozzle wall leak test Click here to view figure |
Leak Testing
Two leak tests, for the nozzle support plate, and the entire test chamber, have been performed to check the test bed for any possible leaks (Figures 13 and 14). For measuring leaks in nozzle plate, an axial fan of 7600 m3/h and 280 Pa gauge pressure, has been installed at the entrance of the test bed. When all the nozzle openings were blocked, no pressure difference was observed. To measure the leak in the entire test bed, outlet of the test chamber and openings of all nozzles, except one of 4cm diameter nozzles, were blocked. The measured flow rate through the nozzle was 14.5m3/h, when the static pressure before the nozzle was 280 Pa.
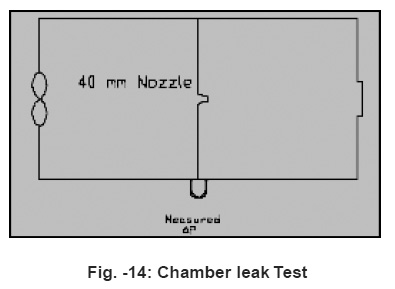 |
Figure 14: Chamber leak Test Click here to view figure |
Conclusions
A bed for testing fans of up to 7600 m3/hr capacity has been designed and constructed. The leak tests and air velocity distribution measurements across the bed show acceptable results. The test bed uses suitable measurement instruments to achieve high measurement accuracy. An auxiliary fan is used, which is equipped with a frequency control to increase the applicability of the test bed for all measurement ranges. The results of CFD analysis show that application of the three screens of 50%, 50%, 40% open area, and consideration of 16 cm distance between the screens, results in the optimum air flow distribution across the test bed.
Acknowledgements
The authors wish to acknowledge the financial help provided by Iranian Ministry of Power to carry out this project.
References
-
Li, J., and A. J. Heber, Optimizing Performance of Variable Speed Fans, Transactions of the ASAE (1992) 35(5).
-
Ford, S. E., T. L. Funk, G. L. Riskowski, and A. M. Zhivov, Evaluation of Variable Frequency Drives for Agricultural Ventilation Fan Speed Control, ASAE Paper No. 984041. St. Joseph, Mich (1998).
-
Pedersen, S., and J. S. Storm, Testing of Complete Ventilation Units, ASAE Paper No. 924506. St. Joseph, Mich (1992).
-
Ford, S. E., L. L. Christianson, A. J. Muehling, and G. L. Riskowski, Agricultural Ventilation Fans, Performance and Efficiencies, Urbana, III, Univ. of Illinois, Department of Agricultural Engineering (1991).
-
Ford, S. E., Y. Zhang, L. L. Christianson, and T. L. Funk, Agricultural Ventilation Fans, Performance and Efficiencies, Department of Agricultural Engineering, publication #UILU-ENG 2003-7001, Urbana, III., Univ. of Illinois (2003).
-
Guul-Simonsen, F., and P. Madsen, Laboratory Measurements of Noise from Livestock Ventilation Units, Applied Engineering in Agriculture, (2000) 16(1).
-
ANSI/AMCA210-99/ANSI/ASHRAE 51., Laboratory methods of testing fans for aerodynamic performance rating (1999).
-
ASHRAE Handbook, Fundamentals, Atlanta, Ga.: Amer. Soc. of Heating, Refrigeration and Conditioning Engineers, Inc (2005).


