Assessment of water quality parameters in Ebe and Ora rivers around the vicinity of the Nigerian cement factory, Nkalagu
G.E. Nwajei1 *
http://dx.doi.org/10.12944/CWE.2.1.02
Water quality parameters of Ebe and Ora Rivers collected around the vicinity of the Nigeiran cement factory at Nkalagu were assessed to ascertain the pollution status of both rivers. The parameters with determined using the standard with determined using the standard methods of analysis except for the metals which were analysed using atomic absorption spectrophotometry. The results obtained revealed that there were variations in the levels of the parameters analysed and they were all dedected. The concentration of some parameters such as dissolved oxygen, biochemical oxygen demand carbon dioxide, total alkalinity, total hardness, ammonia, chloride, fluoride, sulphate, nitrate, calcium, sodium, zinc, nickel, chromium and aluminum are within the WHO desirable limit for portable water. Whereas temperature, hydrogen sulphide, pH, iron, manganese, cadmium, lead and arsenic have elerated concentrations in both rivers. The pollution index calculation of 39.258 (site 01) and 24.377 (site 02) for Ebe River; 13.375 (site 01) and 13.463 (site 02) Ora River are indication that both rivers are polluted. This is attributed to the activities of the Nigerian cement factory at Nkalagu in the eastern Nigeria
Copy the following to cite this article:
Nwajei G.E. Assessment of water quality parameters in Ebe and Ora rivers around the vicinity of the Nigerian cement factory, Nkalagu. Curr World Environ 2007;2(1):7-16 DOI:http://dx.doi.org/10.12944/CWE.2.1.02
Copy the following to cite this URL:
Nwajei G.E. Assessment of water quality parameters in Ebe and Ora rivers around the vicinity of the Nigerian cement factory, Nkalagu. Curr World Environ 2007;2(1):7-16. Available from: http://www.cwejournal.org/?p=613
Download article (pdf)
Citation Manager
Publish History
Introduction
Environmental problem in Nigeria are numerous. They include inefficient wastes disposal, poor sewage systems, oil spills, poor urban planning and over population. All these lead to air and water pollution. These anthropogenic activities are largely caused by the poor living habits of many Nigerians and unhealthy practices of factories and other corporate bodies’ pollution in water affects not only water quality but also could be dangerous to aquatic life (Sanudo-Wilhelmy and Gill 1999). Monitoring systems are essential to track long-existing pollution processes, but the lack of them in many regions makes it very difficult to draw certain conclusions about the long-term results of human activities (Waldman and Shevah, 1993). Heavy metals tend to accumulate in storage compartments. The accumulation can continue throughout the organism is life and is the major cause of chronic toxicity. It is often necessary to estimate the speciation of metals in acidic water as high concentrations of free metals especially aluminium are toxic to life (Anderson et al., 1990).
The hazardous constituents are released into the air and create more new toxic compounds. Toxic chemicals released by burning tires may become part of the food chain, entering water, soil, plants, livestock, dairy products and wildlife. The power system in India accounts for nearly one-third of carbon dioxide emissions of the country as a whole (Chattopadhyay and Parikh 1993). Hydrogen sulphide levels should not be allowed to rise up to 10.00mg/L. Of other gases, hydrogen sulphide is the only one with a distinctive smell and is the most dangerous, more so than hydrogen cyanide. It is the gas responsible for the most deaths, in the waste water treatment industry (James, 1990). Both organic and inorganic contaminants enter aquatic environments via industrial and municipal wastewater effluents (Heinins et al., 1999). Metals and other toxic compounds are common in urban wastewaters (Jones and Clark, 1987). Heavy metals pollution which occurred in Bombay Harbour threatened the aquatic organisms in the environment (Meadows and Campbell, 1988). Excessive fluoride ion in drinking water cause dental floursosis or mottling of teeth. On the other hand, communities whose drinking water contains no fluoride have a high prevalence of dental caries. Dissolved oxygen levels significantly below saturation values (Often occur in polluted surface water) will make fishes and most aquatic life to be stifled (Hammer, 1996). Discharge of acidic effluents often containing high concentrations of toxic metals from mines and mine wastes into streams and rivers is an intractable worldwide environmental problem (Brami et al., 1999). Wastes from industries constitute approximately 62 percent of total source of heavy metal pollutants in rivers and other water bodies around us (Okuo and Ozioko, 2001). The elevated levels of heavy metals as reported by Iwegbue et al., (2006) in soil profiles of automobile mechanic waste dumps in Nigeria constituted a serious threat to both surface and ground water. Egli et al., (2003) reported that in collecting surface water the following information should be noted: size of the water; actual and average flow rate in the case of river water; precipitation ;during the study period, notably during the days immediately preceding sampling; sampling depth and position; pH and temperature of the water; separation method, if suspended material is separated or specification if no separation was made; and other parameters such as suspended particles, electrolytic conductivity, ionic strength, concentration of anions and cations, redox potential or concentration of dissolved oxygen.
It is an established fact that combustion of fossil fuels pose serious environmental hazards because elements such as mercury, lead cadmium, arsenic, chromium, selenium etc which are emitted are toxic to human health. Also some of the cement products arising from cement factory at Nkalagu in the form of dust and factory emissions are thrown into the atmosphere. These can be washed down into the aquatic environment by one form of precipitation or the other such as rainfall, dew etc. Also the liquid and solid industrial waste quite often find their ways into the surrounding streams and rivers. The objectives of this study are to determine the physiochemical characteristics of water samples from Ebe and Ora Rivers; to determine heavy metal levels in water samples from Ebe and Ora Rivers and to determine the possible sources of pollution and pollution status of the two rivers.
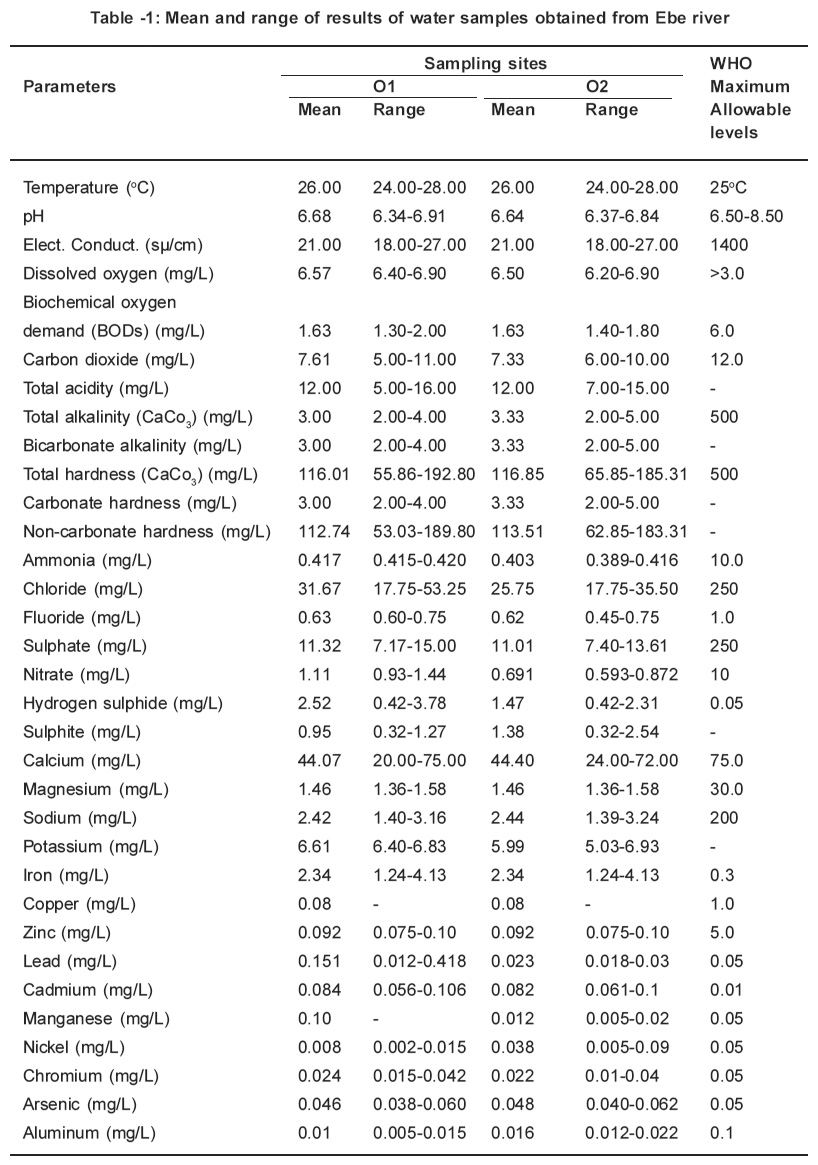 |
Table 1: Mean and range of results of water samples obtained from Ebe river Click here to view table |
Study Area
Fig 1 shows the map of the study area. Geographically, the study area comprises Enugu and Ebonyi States. Ebe River which rises from the hills of Umuosigide village of Obollo-Eke flows by the Nigerian cement factory at Nkalagu and before emptying into the cross River as Ebonyi is joined by Ora River which rises from Ezimo Hills and also flows by the Nigerian cement factory.
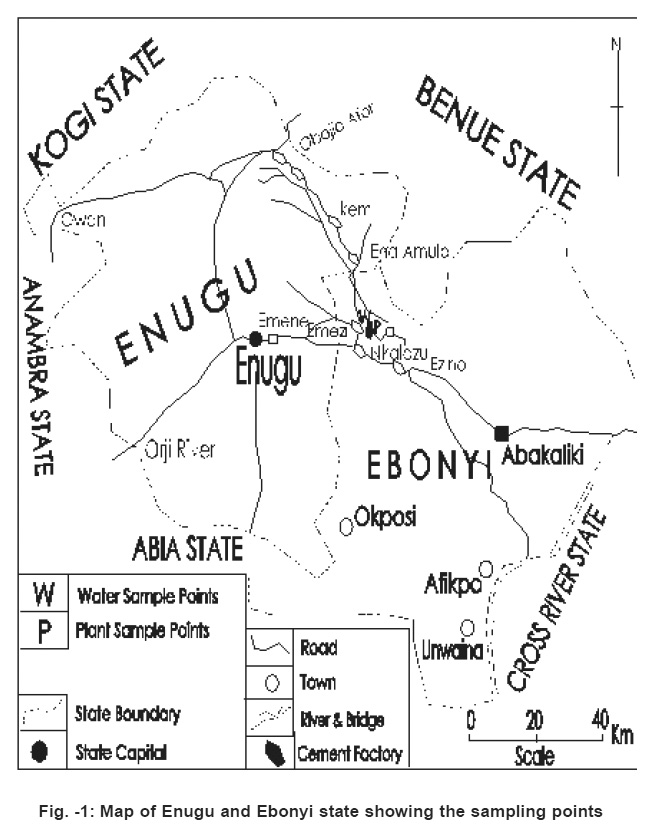 |
Figure 1: Map of Enugu and Ebonyi state showing the sampling points Click here to view figure |
Material and Methods
Two sample sites (sites 1 and 2) were located along the Ora River in Ebonyi State. Also at Ebe River, two sample sites (sites 1 and 2) were located. The samples were collected at a depth of about 15cm in clean white polyethylene stoppered bottles which has been washed with soap solution, rinsed three times with pure water and then rinsed another three times with 1%HNO3. The water samples were stoppered and cabelled. The samples were filtered, using the method adopted by Meranger et al; (1979). The water samples were taken to the laboratory and stored in cold at 4oC prior to digestion. The water for DO and BODs determinations was treated (Winkler method) with manganesous sulphate solution, alkali-iodide-azide solution and 1.00mL of concentrated sulphuric acid by inserting the can for several times. After the formation of the brown precipitate, the sample was allowed to stay for five minutes. The DO was determined on sites of collection. Immediately, the remaining treated solution was well stoppered and incubated prior to five days later before BODs analysis. 100mL3 of each water sample was transferred into a beaker and 5.00cm of concentrated HNO3 was added. The beaker containing the solution was placed on a hot plate and evapourated to near dryness, making sure that the sample does not boil. The beaker containing the residue was cooled. Then 5.00mL of concentrated HNO3 was further added. This was returned to the hot plate until digestion was completed (Ahn et al; 1996; USPHA, 1995 and European Commission 1999). Then, 2.00mL of concentrated HNO3 was added and the beaker was warmed slightly to dissolve e the residue. The digested sample was filtered. The filtrate was made up to 50.00mL mark with deionized water. The solutions were returned to the laboratory and stored in a refrigerator prior to metal analysis using atomic absorption spectrometry. The blank were also prepared using the same procedure of digestion as in samples.
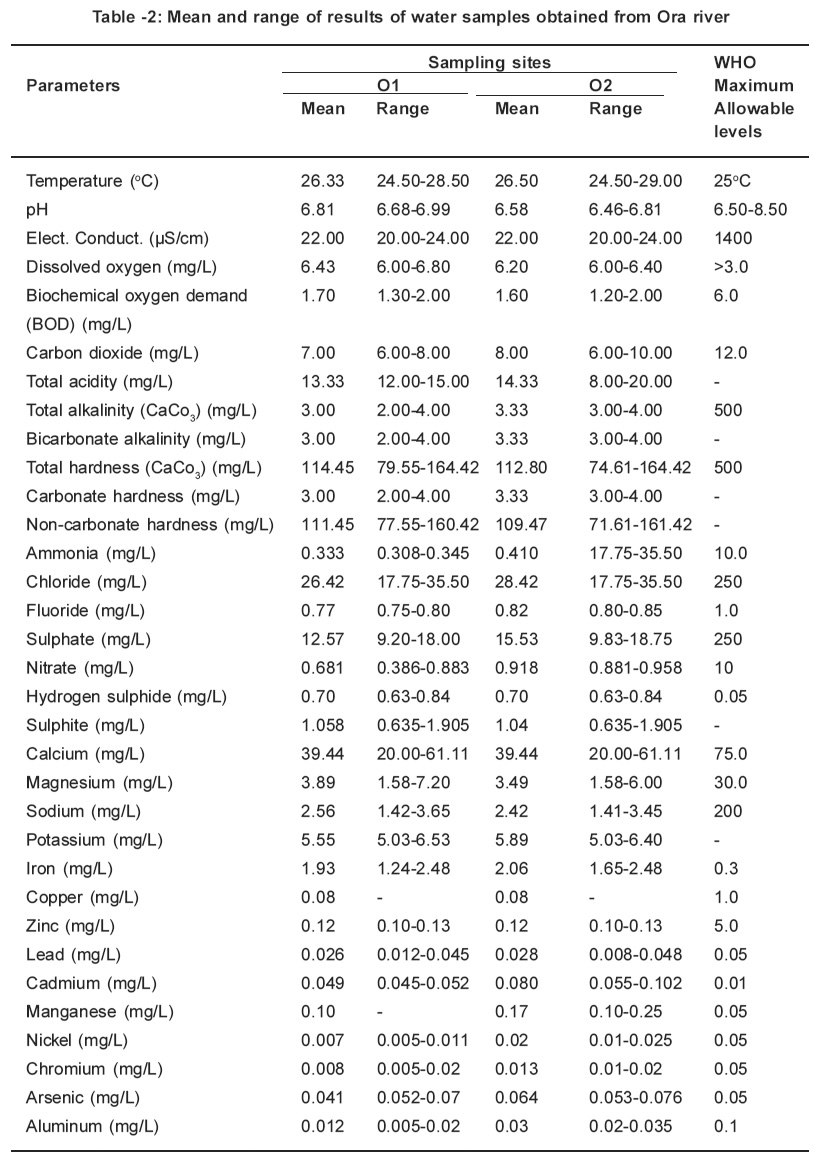 |
Table 2: Mean and range of results of water samples obtained from Ora river Click here to view table |
Parameters such as temperature, pH, electrical conductivity, dissolved oxygen, biochemical oxygen demand, carbon dioxide, total acidity, total alkalinity, bicarbonate alkalinity, total hardness, carbonate hardness, non-carbonate hardness, ammonia, fluoride, chloride, sulphate, nitrate, sulphite and hydrogen sulphide were determined by standard methods (APHA, 1990; Chapeon, 1992; Maier, 1971, Ahr et al; 1996; USPHA, 1995; EC, 1999; and Franson, 1995). The temperature, pH and electrical conductivity were determined in situ with zeal thermometer range from 0-300oC, P107 digital consort pH meter and K120 digital consort electronic conductometer respectively.
Metals concentrations were measured using the atomic absorption spectrophotometry (Absorption/Emission spectrometer 200-A). Standard solutions and blank were prepared as reported by Franson (1995).
 |
Table 3: Computation data of pollution index of Ebe river Click here to view table |
Results and Discussion
The parameters determined in this study were all detected. The monthly study revealed that there were variations in concentrations of all the parameters. Table 1 and 2 represents the mean concentrations and range of different parameters in the water samples obtained from Ebe and Ora Rivers. A close at obtained values for temperature, pH, electrical conductivity, dissolved oxygen and biochemical oxygen demand respectively in water samples of Ebe and Ora Rivers have identical trend. The temperature values for both rivers are slightly higher than the WHO (1983) maximum allowable level of 25oC whereas pH, electrical conductivity, dissolved oxygen and biochemical oxygen demand values did not indicate pollution. The carbondioxide, pH and total acidity levels in water samples for both rivers showed that the waters are slightly acidic. The carbon dioxide, pH and total acidity values maintained identical. Characteristic. This is expected, since acidity in water is due to dissolved carbon dioxide, mineral acids and hydrolyzed salts. The presence of acids in both rivers is traceable to gaseous emissions from Nkalagu cement factory which uses fossil fuels during operation.
Total alkalinity, bicarbonate alkalinity and carbonate hardness values are identical for both rivers and these values are considered low when compared with 500mg/L accepted WHO standard. The identical values is a proof that alkalinity is almost entirely due to the bicarbonate, carbonate, and, hydroxide ions in the water, usually in association with calcium, magnesium, sodium and potassium. This is why alkalinity is often quoted in terms of CaCO3 instead of carbonate and bicarbonate content. The total hardness values obtained in site 01and 02 (116.01mg/L and 116.85mg/L) from river exceeded those for site 01and 02 (114.45mg/L and 112.80mg/L) from Ora River. These values are lower than 500mg/L for WHO (1983) maximum allowable level for drinking water. The removal of total alkalinity from total hardness gives the non-carbonate hardness.
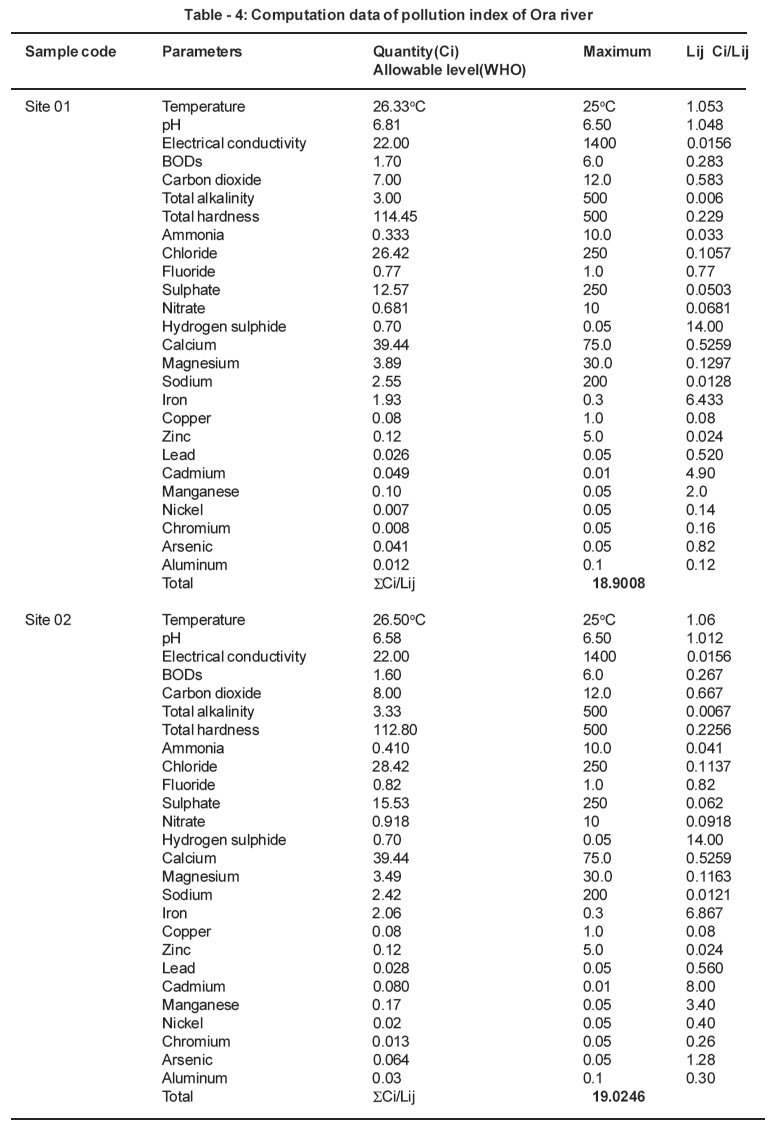 |
Table 4: Computation data of pollution index of Ora river Click here to view table |
The levels obtained for parameters such as ammonia, chloride, fluoride, sulphate and nitrate for this study were low when compared with those for WHO (1983) maximum allowable levels (10.0mg/ L for ammonia, 250mg/L for chloride; 1.0mg/L for fluoride; 250mg/L for sulphate and 10mgll for nitrate respectively). There is no specification for sulphite. However, the presence of sulphite in this study is traceable to the combustion of coal during the cement production. The sulphur released during the coal combustion reacts with the atmospheric oxygen to give sulphur dioxide which oxidizes to sulphite. This is washed down by rainfall, thereafter it empties into the rivers through runoff. The hydrogen sulphide values for sites 01 and 02 (2.52mg/L and 1.47mg/L from Ebe River exceeded those for sites 01 and 02 (0.70ppm and 0.70ppm) from Ora River. These values in water samples from both rivers are higher than 0.05mg/L for WHO (1983) maximum allowable levels for portable water. These high levels of hydrogen sulphide is as a result of combustion of coal in the cement factory which results in the production of sulphur dioxide and sulphur trioxide. The oxidation of these gases result to the formation of H2SO4 while the unreacted SO2 forms H2SO3. When these acids reacts with the pyrites (FeS) which is present in the rivers it generate H2S.
The concentrations of metals such as calcium, magnesium, sodium, copper, zinc, nickel, aluminium, chromium and lead respectively obtained in this study from both rivers did not indicate pollution because their levels were below the WHO (1983) limit for potable water except for site 01 from Ebe River where concentration of lead (0.151mg/L) was higher than the above limit. On the other hand, the concentrations of iron, manganese, cadmium and arsenic exceeded the WHO (1983) maximum allowable levels for drinking water. The elevated iron levels are not unexpected because the soils in the sample areas are known to contain pyrites (FeS). The presence of manganese, cadmium, lead and arsenic are traceable to the pollution caused by the cement industry which uses such fossil fuel as coal. It is an established fact that a wide range of heavy metals is found in fossil fuels which are either emitted into the environment as particles during combustion or accumulate in ash which may itself be transported and contaminate soils or waters or may be leached in situ.
Pollution index (Pij) is expressed as a function of the relative values of Ci/Lij (Akuezuilo and Isyaku, 1993). Each value of (Ci/Lij) shows the relative pollution contributed by one item. The critical value is 1.0. For each (Ci/Lij) value>1.0 indicates that the water requires some treatment prior to use for a particular purpose.
The pollution can be calculated thus:
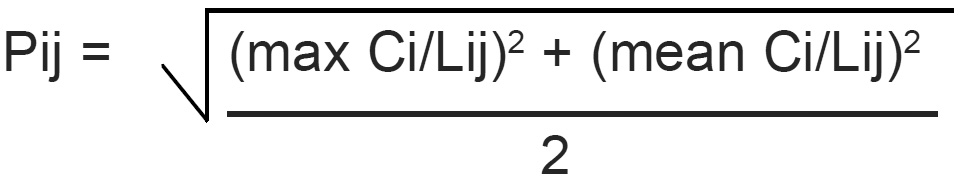
The pollution index of the Ebe and Ora Rivers were calculated. The results were as follows: (1) Ebe River: 39.258 for site 01 and 24.327 for site 02. (2) Ora River: 13.375 for site 01 and 13.463 for site 02. The pollution index values for both rivers are critical because the values they are greater than 1.0. This is an indication that both rivers are polluted. The waters from Ebe and Ora Rivers need to be treated before usage.
Conclusion
Water quality parameters of Ebe and Ora Rivers obtained around the vicinity of the Nigerian cement factory at Nkalagu were assessed. The results obtained showed that there were variations in the values of the parameters and all the parameter assessed were detected. The levels of parameters obtained in this study were compared with the WHO maximum allowable levels for drinking waters. Parameters such as temperature, hydrogen sulphide, pH, iron manganese, cadmium, lead and arsenic have elevated concentrations, whereas, the concentrations of dissolved oxygen biochemical oxygen demand, carbondioxids, total alkanity, total hardness ammonia, chloride, fluoride, sulphate, nitrate, calcium, sodium, zinc, nickel, chromium and aluminum are within the WHO desirable limit for drinking water. The pollution index calculation of 39.258 (site 01) and 24.377 (site 02) for Eber River; 13.375 (site 01) and 13.463 (site 02) for Ora River are indication that both rivers are polluted. It implies that the water must be treated before use for drinking water, irrigation, swimming and as a tourist centre in the eastern of Nigeria. The source of the elevated concentrations of some parameters are traceable to the activities of the Nigerian cement factory at Nkalagu.
References
-
Ahn, I.Y; Lee, S.H; Kim, K.T; Shim, J.H. and Kim, D.Y., Baseline Heavy Metal concentration in the Antarctic clain, Lutemula Elliptica in Maxwell Bay, King George Island, Antarctic. Mar. Pollut. Bull. (1996) 32: (8/9) 592-598.
-
Anderson, H.A. Hepburn, A. Miller, J.D. Stewart, T.A.B. Humic Substances of surface Water: Litter and Soil through flow relationships in two forested ecosystem. Anal. Chem. Acta. (1990) 323, 3-10.
-
APHA Standard Methods for the Examination of Water and Wastewaters, 16th edition, APHA, Washington, DC pp. 5.6 (1990).
-
Brami, Y, Hernt, B Schemesh, A and Cohen, H., Characterization and Distribution of Trace Metal Contaminations in Sediments from Sowhegan River. Environ. Sci. Technol. (1999) 33(2): 276-281.
-
Chapeon, D., Water Quality Assessment: A guide to the use of biota, sediments and monitoring, Chapeon and Hall, London, (1992) pp. 58-100.
-
Chattopadhyay, D. and Parikh, J.K. Carbon dioxide emission reduction from the power system in India, National Resource forum, (1993) 17 (4) 251-261.
-
Egli, H; Dassenakis, M; Garelick, H; Van-Grieken, R; Peijneburg, W.J.G.M. Klasinc, L; Kordel, W; Priest, N and Tavares, T., Minimum Requirements for Reporting Analytical Data for Environmental Samples. Pure Appl. Chem., (2003) 75(8): 1097-1106.
-
European Commission (E.C.) Residue: Guidance for Generating and Reporting Methods of Analysis, SANCO/3029/99 Franson, M.A. (1995) Standard Methods for the Examination of Water and Wastewaters, 14th edition, APHA-AWA-WPCF, NY, (1999) pp 150-162, 235 and 252.
-
Harmmer, M.N. Water and Wastewater Technology, 2nd edition, Prentice Hall International Inc., New Jersey, (1996) pp 38-43.
-
Heinins, I.J. Knuth, M.I. Liber, K. Sheady, B.B. Tunell, R.I. and Ankley, G.T., Charactrization and Distribution of Trace Metal Concentrations in Sediments from Massan Bay. Environ. Toxicol. Chem. (1999) 18: 2424-2432.
-
Iwegbue, C.M.A.; Isirimah, N.O.; Igwe, C and Williams, E.S., Characteristic levels of heavy metals in soil profiles of automobile mechanic waste dumps in Nigeria. Environmentalist, (2006) 26: 123-128.
-
James, A. The Treatment of Toxic Wastes; In pollution; causes, effect and control, 2nd edition, Royal Society of Chemistry, Cambridge, (1990) pp. 63-81.
-
Jones, R.C. and Clarke, C.C., Impact of Watershed Urbanization on Stream Insect Communities. Water Res. Bull. (1987) 23, 1047-1051.
-
Maier, F.J., Fluoride in Water: Water Quality and treatment, 3rd edition McGraw-Hill, New York, (1971) pp. 397-440.
-
Meadows, P.S. and Campbell, J., An Introduction to Marine Science, 2nd edition, Blackie Academic and Professional, London, (1988) pp. 246.
-
Meranger, J.C.; Subramanian, K.S. and Chaufoux, C. A National Survey for cadmium, chromium, copper, lead, zinc, calcium, magnesium in Canadian Drinking Water Supplies. Environ. Sci. Technol. (1979) 13(6): 707-711.
-
Okuo, J.M. and Ozioko, M.C. Absorption of lead and mercury ions on chemically treated periwinkle shells. J. Chem. Soc. Nigeria, (2001) 26(1): 60-65.
-
Sunnudo-Wilhelmy, S.A. and Gill, G.A. Impact of the clean Water Act on the Levels of Toxic Metals in Urban Estuaries the Hundson River Estuary Revisited. Environ. Sci. Technol. (1999) 33(20) 3471-3481.
-
USPHA Standard Methods for the Examination of Water and Wastewater, 19th edition, prepared and published jointly by: American Public Health Association, American Water Works Association, Water Environment Federation; Joint editorial board; Amold E. Greenberg, Andrew O. Eaton, Lenore S. Cleseri, American Health Association, Washington, DC (1995).
-
Waldman, M. and Shevah, Y. Biodegradation and Leaching of pollutants, Monitoring Aspect. Pure and Appl. Chem. (1998) 65, 1565-1603.
-
WHO Guidelines for Drinking Water Quality, Technical Report Series 505, Geneva (1983).


