Analysis and interpretation of groundwater contamination using remote sensing and GIS :A case study
SS. Asadi1 * , G. Rajani1 and M. Anji Reddy1
1
Centre for Environment,
Institute of Science and Technology,
Jawaharlal Nehru Technological University,
Hyderabad,
500 072
India
http://dx.doi.org/10.12944/CWE.2.2.03
The human activities are constantly adding industrial, domestic and agricultural wastes to the ground water reservoirs at an alarming rate. In the last few decades, rapidly developing technologies, increase in population and urbanization have been witnessing alarmed phenomena all over the world. Anthropogenic activities like generation and indiscriminate disposal of solid wastes and extensive use of fertilizers have resulted in increasing levels of air, water and soil pollution, changing land use patterns, decrease in arable land and other dominant problems. The problems of groundwater quality arise with changing land use patterns and are acute in areas that are densely populated and thickly industrialized, which affect the ground water resources and quality. The present study is aimed at generating physical characters and water quality by using remote sensing and GIS. The thematic map of the study area was prepared from linearly enhanced fused data of IRS-ID PAN and LISS-III merged satellite imagery and Survey Of India (SOI) toposheets on 1:50,000 scale using visual interpretation technique using AutoCad and Arc/Info GIS software forming the spatial database. Groundwater samples were collected from the predetermined sampling locations and analyzed for physico-chemical parameters for the generation of attribute database. The spatial and attribute database thus generated are integrated and maps showing spatial distribution of selected water quality parameters were prepared. Water quality index (WQI) is calculated to assess the suitability of ground water for drinking purpose in the environmental stress areas with respect to water quality . suitable remedial measures are suggested.
Copy the following to cite this article:
Asadi S.S, Rajani G, Reddy M.A. Analysis and interpretation of groundwater contamination using remote sensing and GIS :A case study. Curr World Environ 2007;2(2):115-126 DOI:http://dx.doi.org/10.12944/CWE.2.2.03
Copy the following to cite this URL:
Asadi S.S, Rajani G, Reddy M.A. Analysis and interpretation of groundwater contamination using remote sensing and GIS :A case study. Curr World Environ 2007;2(2):115-126. Available from: http://www.cwejournal.org/?p=657
Download article (pdf)
Citation Manager
Publish History
Introduction
Water is the most ubiquitous material in nature and is the most vital and fascinating of all God’s creation. It is the most important raw material for mankind and is called “Liquid Gold”. It is mainly because of this magical substance only that earth’s temperature is maintained reasonably uniform at an average of 16 °C. Without water its temperature would have varied as on moon where it is 100°C during days and - 130°C during nights. Man can survive for five weeks without food but for less than five days without water.
Man needs water for domestic purposes such as cooking, cleaning utensils, gardening, washing clothes and above all for drinking. It is also needed for commercial, industrial and recreational purposes. Water used for such purposes should not be polluted, but should be of good quality. Urbanization and industrialization have directly or indirectly polluted most of the water sources on a global scale. It may be noted that 90% of the world population is living without safe water which gives rise to water borne diseases which kills nearly 30,000 people every day. This is an alarming trend, which will lead to over exploitation and rapid depletion of groundwater resulting in acute fresh water scarcity apart from disturbing the ecological balance. Impact studies can contribute to improve urban development and environmental planning at the project and policy levels and it also introduces analytical tools to support such planning. Remote sensing applications have been operationalized in most of the natural resource management themes and at present the trend is on integrated surveys to arrive at sustainable developmental packages. Keeping this in view, an attempt is made to evaluate the water quality.
Study Area
The Maripeda Mandal lies geographically between latitudes 17° 20’ 00’’ and 17° 35’ 00’’ and longitudes 79° 45’ 00’’ to 80° 00’ 00’’ is covered in the Survey of India toposheet numbers 56 O/14 and 56 O/15. It is one of the 51 Mandals of Warangal district, in Andhra Pradesh. The major crops grown in the study area are Rice, Jowar, Cotton, Turmeric, Maize, Chilies and Sesame. Because of long range of dry periods and less number of rainy days the area suffers from poor soil moisture condition, resulting in frequent drought and famines. Due to erratic nature of rainfall and impermeable nature of rocks the stream channels are formed into shallow and wider valley floors. The Drainage pattern is dendritic as a whole. Most of the stream courses are controlled by geological structures.
Study Objectives
-
To prepare the digital thematic maps namely Base map,slope,soil,Geology , Geomorphology map, Ground Water Potential map, Land use/ Land cover, Drainage map etc. using satellite data, collateral data and field data on ARC/INFO GIS platform. This constitutes the spatial database.
-
Physico chemical Analysis of the water samples.This constitutes the Attribute database.
-
Creation of Water Quality Index.
Methodology
Data Collection
Different data products required for the study include Survey of India (SOI) toposheets bearing with numbers 56O/14 and 56O/15 on 1:50,000 scale. Fused data of IRS–1D PAN and LISS-III satellite imagery obtained from National Remote Sensing Agency (NRSA), Hyderabad, India. Collateral data collected from related organizations, comprises of water quality and demographic data.
Database Creation
Satellite imageries are georeferenced using the ground control points with SOI toposheets as a reference and further merged to obtain a fused, high resolution (5.8m of PAN) and colored (R,G,B bands of LISS-III) output in EASI/PACE Image processing software. The study area is then delineated and subsetted from the fused data based on the latitude and longitude values and a final hard copy output is prepared for the generation of thematic maps using visual interpretation technique as shown in Fig. 1. These thematic maps (raster data) are converted to vector format by scanning using an A0 flatbed deskjet scanner and digitized using AutoCAD software for generation of digital thematic maps using Arc/Info and ARCVIEW GIS software. The GIS digital database consists of thematic maps like land use/land cover, drainage, road network using Survey of India (SOI) toposheets and fused data of IRS - ID PAN and IRS-ID LISS-III satellite imagery.
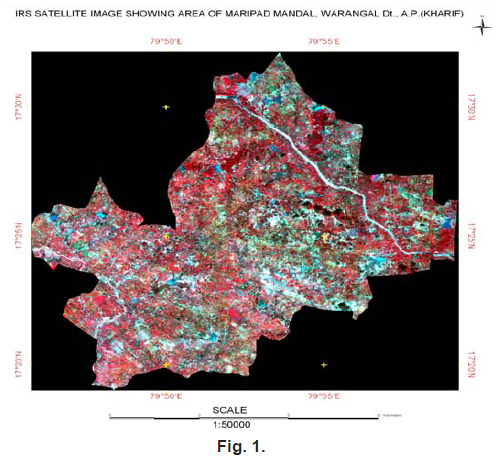 |
Figure 1 Click here to view figure |
Spatial Database
Thematic maps like base map and drainage network maps are prepared from the SOI toposheets on 1:50,000 scale using AutoCAD and Arc/Info GIS software to obtain a baseline data. Thematic maps of the study area was prepared using visual interpretation technique from the fused satellite imagery (IRS-ID PAN + IRS-ID LISS-III) and SOI toposheets along with ground truth analysis. All the maps are scanned and digitized to generate a digital output Fig. 1.
Attribute Database
Fieldwork is conducted and ground water samples are collected from predetermined locations based on the land use and drainage network maps in the study area. Care is taken in collecting the water samples for uniform distribution and density of sampling locations. The water samples were analyzed for various physico-chemical parameters adopting standard protocols (APHA, AWWA, WPCF 1998). The water quality data thus obtained forms the attribute database for the present study Table 1.
Estimation of Water Quality Index (WQI)
To determine the suitability of the groundwater for drinking purposes, Water Quality Index (WQI) is computed adopting the method proposed by Tiwari and Mishra, 1985 (Mahuya Das Gupta, 2001, Pradhan, S.K, 2001, Srivastava, A.K., 1994). WQI is computed using the formula given in equation (1), and a water quality index map is prepared.
WQI = Antilog [ΣWn log10 q] ...(1)
Weightage factor (W) is computed using equation (2)
Wn = K / Sn ...(2)
Where,
Sn = Standard value of the parameter
K, Constant = [1 / (Σnn=1 1/Si)]
Si = Standard value of the parameter
Quality rating (q) is calculated by the formula given in equation (3)
qni = {[(Vactual – Videal) / (Vstandard – Videal)] * 100} ...(3)
Where,
qni = Quality rating of ith parameter for a total of ‘n’ water quality parameters
Vactual = Value of the water quality parameter obtained from laboratory analysis
Vstandard = Value of the water quality parameter obtained from the standard tables.
Videal for pH = 7 and for other parameters it is equalent to zero.
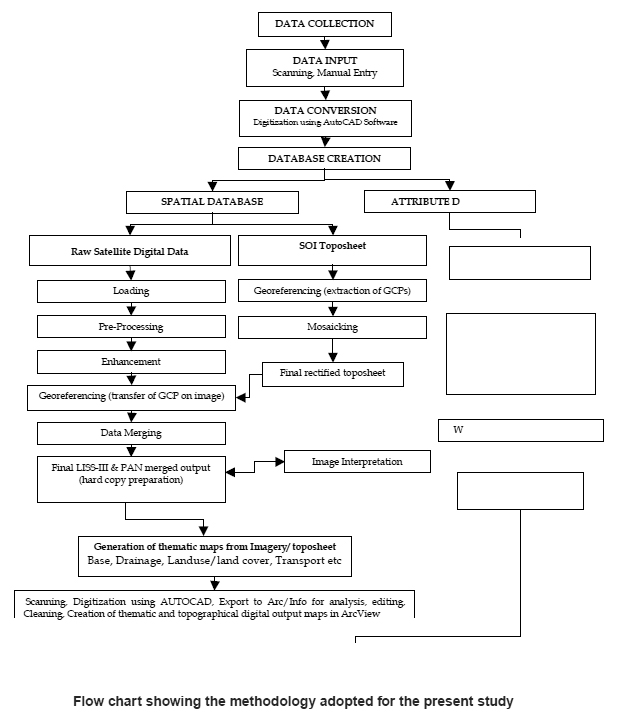 |
Flow chart showing the methodology adopted for the present study Click here to view flow chart |
Material and Methods
Groundwater samples were collected from different locations from predetermined study area. Sampling bottles were cleaned with 10 % nitric acid followed by distilled water to avoid any accidental contamination. Samples were collected in 1.5 litre of pet bottles from selected sampling sites and were scaled highly and labeled properly. The groundwater samples were collected according to standard methods and analyzed for physical and chemical parameters APHA (1998).
Results and Discussion
Base Map
A topographic map is a representation of the shape, size, position and relation of the physical features of an area (IMSD Technical Guidelines 1995). The base map is prepared using SOI toposheet on 1:50,000 scale and updated with the help of satellite imagery. It consists of various features like the road network, settlements, water bodies, canals, railway track, vegetation etc. delineated from the toposheet. The map thus drawn is scanned and digitized to get a digital output. The information content of this map is used as a baseline data to finalize the physical features of other thematic maps.
Drainage
Drainage map is prepared by using Survey of India Topographic maps on 1:50,000. All the streams and tanks existing in the study area are marked in this map. These streams further classified based on stream ordering. Up to fourth order streams exist in the study area.Most of the streams right side of the state highway flow NorthEast to SouthWest in the study area and left side of the state highway SouthWast to NorthEast Canals. Only two minor rivers namely Palleru and Akeru exists. The drainage system existing is dendritic Fig. 2.
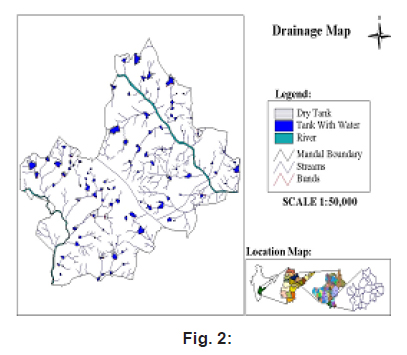 |
Figure 2 Click here to view figure |
Slope Map
Slope classes 1, 2 and 3 are observed in the study area. Most of the study area is covered by nearly level, very gently, gently slope class (92%). Small part of the study area (4%) comes under moderately sloping class 4 and ( 2%) study area comes under the strongly sloping class 5 (IMSD Technical Guidelines, 1995).
Land Use/Land Cover:
The land use/land cover categories such as built-up land, agriculture, forest, water body and wastelands have been identified and mapped from the study area Fig. 3. Major part of the study area is covered with single crop and double crop (93%). About (0.015%)of the study area is under built-up land and Industrial area is( 0.017%). From the satellite data the agriculture area (96.05%) could be clearly delineated as four categories, single crop, double crop, fallow land and plantations. Though single crop and double crop has been observed at various parts of the study area and plantations are observed at some places of the study area. Water bodies occupied (0.18%). About (0.46%) of the study area is under scrub forest and( 4.21%) of area is under wasteland. Under this category land with scrub (3%), land without scrub (0.24%) and barren sheet rock area (0.09%) are observed.
Geomorphology
The geomorphological classes observed in the study area are Pediplain with moderate weathering (PPM) (42%), Pediplain with shallow weathering (PPS) (31%), valley (v) (14%), pediment (PD) (8%), pediment inselberg complex (PIC) (2%) ,inselberg (1%) ,pediment (1%) and dyke and dyke ridge (0.12%).
Geology
The study area constitutes mainly a granitic terrain (pink-grey) exposive a variety of archaean granitorides of peniusular gneissic complex (PGC) and schistoic (older metamorphic) rocks. They are intruded by basic dykes (Proterozoic) and covered locally by the deccan traps (upper cretaceous to lower Eocene). The geological categories observed in the study area are mainly granite (98%), basalt (2%), and some of lineaments, dolerites and pegmatites.
Soil
The specific objectives of soil mapping are identification, characterization and classification of the soils of the area. The soil types identified in the study area are (1) loamy-skelital,mixed, rhodic paleustalfs (55%). (2) fine loamy, mixed, fluventicustropepts (10%) (3) fine, montmorillonitic, typichaplusterts (35%).
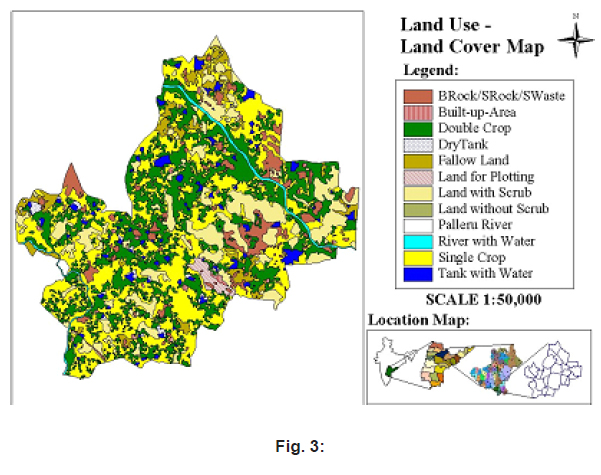 |
Figure 3 Click here to view figure |
Groundwater Potential
The groundwater potential map is prepared based on the analysis of various themes such as geomorphology, land use / land cover, lineament, intersection points, drainage pattern, lithological evidences by using converging evidence concept, besides the collateral data obtained from State Groundwater Board with necessary field checks. The groundwater potential map reveals the available quantum of groundwater and is delineated into zones showing high (53%),medium (30%), low (17%), groundwater potential areas (Krishnamurthy, 1996).
Ground Water Quality Variation in the Study Area
Field work was conducted in the study area from where 92 groundwater samples were collected at different locations. The water samples were analyzed for various physico-chemical parameters. The results obtained are presented in Table 1 and depicted in Fig. 4.
Turbidity
In ground water samples ranged from 4-16 NTU. The high concentration of turbidity is seen in few samples which might be due to colloidal materials which is objectionable because of aesthetic considerations.
pH
pH of groundwater samples was ranging from 6.2-7.5 which shows the alkaline nature of water. The pH is an important variable in water quality assessment as it influences many biological and chemical processes with in a water body and all processes associated with water supply and treatment.
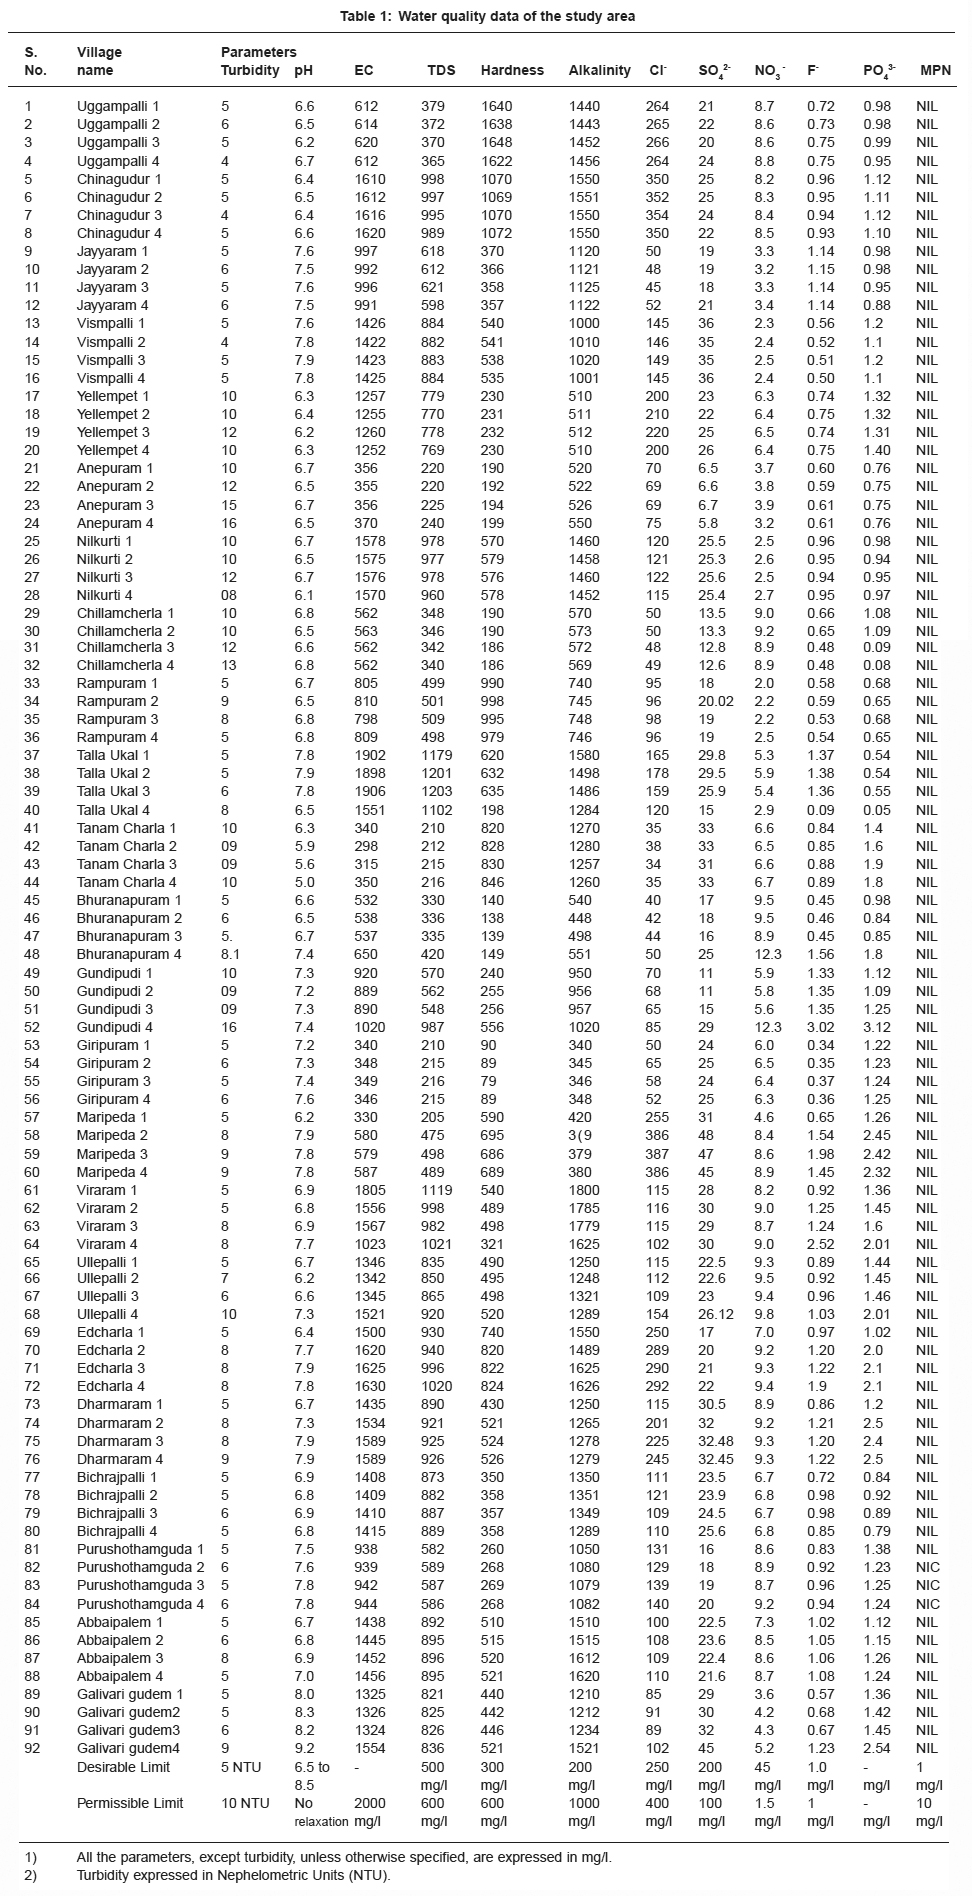 |
Table 1: Water quality data of the study area Click here to view table |
Electrical Conductivity
EC of groundwater ranged from 340-1906 mg/l. The high concentration of EC may be due to high concentration of ionic constituents present in water bodies and reflects contributions from salinity intrusions as well as industrial effluents.
Total Dissolved Solids
The TDS values of groundwater sample ranged from 192-1203 mg/l. The observed TDS values in most of the groundwater samples are exceeding the permissible limits of ICMR. The suspended solids values indicated the presence of organic and inorganic solids that can provide adsorptive sites for certain chemicals and biological agents.
Hardness
The hardness in the groundwater samples ranged from 79 – 1648 mg/l. The concentration of hardness is above the prescribed limit of 300 ppm in most of the samples collected from study area. Hard water is high in dissolved minerals, both calcium and magnesium. As water moves through soil and rock, it dissolves small amounts of these naturally-occurring minerals and carries them into the ground water supply. Water is a great solvent for calcium and magnesium, so if the minerals are present in the soil around well and its water supply, can end up with hard water EPA (1996).
Alkalinity
The alkalinity values of groundwater samples ranged from 285 – 1800 mg/l, respectively.
Large amount of alkalinity imparts a bitter taste to water and usually unpalatable and consumer acceptance decreases with this water.
Chlorides
Chlorides values of groundwater samples ranged from 21-387 mg/l, respectively which is above the prescribed standards NEERI (1990) in few samples. Water containing chloride in excess of 250 mg/l are considered to be undesirable for drinking purposes. Sodium chloride exerts a salty taste to water and excess chloride causes cardio vascular diseases.
Sulphate
Sulphate are under permissible limits according to standards which ranged from 11-48 mg/l.
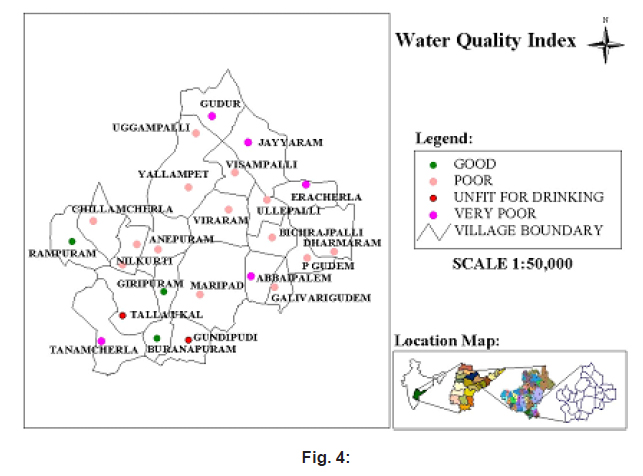 |
Figure 4 Click here to view figure |
Nitrates
Nitrate are under control at locations in ground water samples. High concentration of nitrates is potent toxins that cause a wide range of health problems, including ‘blue-baby syndrome.
Fluorides
Fluoride is above the prescribed limits in almost all ground water samples which is ranging 0.1- 2.5 mg/l. If fluoride is more than 1.5 mg/l it leads to discoloration of teeth called “molting”. Fluoride in excess of 5 ppm causes bone flurosis and skeletal abnormalities. The high concentration of F may be due to domestic waste and wastewater, which are contaminated by effluents from glass and aluminum manufacturing industries.
Phosphates
Phosphate in ground water sample range from 0.04-3.12 mg/l which is below the prescribed limits.
MPN
The most important parameter to be consider for drinking water is MPN (most probable number) and it was found that all the ground water samples showed negative for the MPN test and potable for drinking purpose.
The above investigation reveals that water quality parameter like Hardness, Alkalinity, TDS and Fluoride are beyond the permissible limits and found that the pollution of groundwater is more in the study area.
Water Quality Index Variation in the Study Area
Water quality rating, reflecting the influence of different water quality parameters on the overall quality of water and Water Quality Index (WQI), a very useful and efficient method for assessing the quality of water (Abassi, 1999) are determined in the present study. The water quality of the study area varied from good to unfit for drinking (Fig. 4. ). All the samples exhibited good water quality with the index ranging from 0-50 observed in 12 samples in areas like Giripuram, Buranapuram, Rampuram. Poor water quality with the index ranging from 50-75 obseved in 52 samples at Uggampalli, Yellampet, Visampalli, Chillamcherla, Viraram, Ullepalli,Anepuram, Nilkurti, Maripad, Galivarigudem, P.gudem, Dharmaram, Bichrajpalli areas. where the water quality was found to be very poor with WQI ranging from 75-100 observed in 20 samples at Eracherla, Jyarram, Gudur, Abbaipalem, Tanamcherla areas. Unfit for drinking 8 samples were found with the WQI ranging above 100 in Talaukal,Gundipudi areas.the poor to unfit for drinking samples were observed in areas which are all residential and Agricultural areas. where the domestic waste generated is increasing day by day and using the pesticides in the agricultural lands Improper management of these waste, pesticides may have a greater impact on ground water quality.
Conclusions and Recommendations
From the results obtained from the physico-chemical analysis of ground water and the water quality index, the areas under impact i.e., areas where high concentration of water quality parameters is observed were identified. The results indicate that certain parameters like nitrates, TDS, hardness and alkalinity exceeded the permissible limit as given by Bureau of Indian Standards. The concentration of Sodium, Potassium, Chloride, Sulphates however was within permissible limits. The poor quality which all lie in the residential and Agricultural areas of the study area. Modification and maintenance of the existing septic systems, proper disposal of domestic waste generated from households, pre-treatment of the industrial effluents prior to their disposal and controlled land management prohibiting land use practices and to control the using the pest ices in the Agricultural lands which degrade the environmental quality are a few recommendations suggested to improve the water quality in the study area.
References
1. District Census Handbook of Hyderabad, Directorate of Census Operations, Andhra Pradesh, Census of India (1991).
2. APHA, AWWA, WPCF, Standard Methods for the Examination of Water and Wastewater. (20th edition). American Public Health Association, Washington DC, New York (1998).
3. Tiwari, T.N and Mishra, M, A preliminary assessment of water quality index to major Indian rivers. Indian Journal of Environmental Protection, 5(4): 276-279 (1985).
4. Mahuya Das Gupta Adak, Purohit KM, Jayita Datta, Assessment of drinking water quality of river Brahmani. Indian Journal of Environmental Protection, 8(3): 285-291 (2001).
5. Pradhan, S.K., Dipika Patnaik and Rout, S.P, Water quality index for the ground water in and around a phosphatic fertilizer plant. Indian Journal of Environmental Protection, 21: 355-358 (2001).
6. Srivastava, A.K., and Sinha, D.K, Water Quality Index for river Sai at Rae Bareli for the premonsoon period and after the onset of monsoon. Indian Journal of Environmental Protection, 14: 340-345 (1994).
7. Kurian Joseph, An integrated approach for management of Total Dissolved Solids in reactive dyeing effluents. Proceedings of International Conference on Industrial Pollution and Control Technologies, Hyderabad (2001).
8. Abassi S. A, Water Quality Indices: State-of-the art. J.IPHE, No.1 (1999).
9. APHA, Standard method for the examination Landfills (1996). of water and wastewater 20th ed, American Washington, DC Kolkata port area, National Enviornment (1998)
10. EPA, Guidelines for Environmental Monitoring, Groundwater monitoring at landfills is meant to detect unacceptable groundwater contamination resulting from landfill operations. at Municipal Solid Waste Landfills (1996).
11. NEERI, Waste quality studies of the Jheel in Kolkata port area, National Enviornment Engineering Reasearch Institute, Nagpur (1990).


