Determination of water quality of coastal area Visakhapatnam
A.V.L.N.S.H. Hariharan1 *
1
Department of Chemistry,
College of Engineering,
Gitam,
Visakhapatnam,
530 045
India
http://dx.doi.org/10.12944/CWE.2.2.19
Physico – Chemical analysis of well and bore well water samples was carried out from sixsampling sites of coastal area for the months of February and March 2006. The analysis of different parameters namely- pH, temperature total alkalinity, total hardness, chloride, sulphate, nitrate, TDS, DO, BOD, COD were carried out as per standard methods . The present study aimed to calculate water quality index (WQI) in order to assess the suitability of water for drinking purposes. The results obtained on WQI from different sampling stations were found to be varied from 37 to 46.
Copy the following to cite this article:
Hariharan A.V.L.N.S.H. Determination of water quality of coastal area Visakhapatnam. Curr World Environ 2007;2(2):217-220 DOI:http://dx.doi.org/10.12944/CWE.2.2.19
Copy the following to cite this URL:
Hariharan A.V.L.N.S.H. Determination of water quality of coastal area Visakhapatnam. Curr World Environ 2007;2(2):217-220. Available from: http://www.cwejournal.org?p=75/
Download article (pdf) Citation Manager Publish History
Introduction
The three percent of global fresh water is large enough to meet the requirements of man for million of years. The stupendous increase in world’s population resulting in spurt in urbanization, industrialization, agriculture etc., has put tremendous presence on the limited fresh water resources there by threatening the fresh water bodies with pollution. In India only 12% of people get good drinking water (Kudesia, 1980). In adequate management of water resources as directly or indirectly resulted in the degradation of hydrological environment (Karanth, 1989). Therefore, a continuous periodical monitoring of water quality is necessary so that appropriate steps may be taken for water resource management practices. The present investigations was carried out to calculate the Water Quality Index (WQI) in order to assess the suitability of water from Coastal area, Visakhapatnam.
Material and Methods
Water samples collected from seven sampling stations selected for the analysis were given bellow: S1 Sai Priya Restaurant – (Well Water), S2 Rushikonda Village (Well Water), S3 Rushikonda Bus Stop (Well Water), S4 Sea inn (Well Water), S5 Rushikonda community hall (Bore well water), S6 Gitam College Main Gate (Bore Well), S7 Gitam College ladies hostel (Bore well water). Samples for analysis were collected in sterilized bottles using the standard procedure for grab (or) catch samples in accordance with standard methods of APHA (1995) . The analysis of various physico – chemical parameters namely pH temperature, total hardness, alkalinity, calcium hardness, magnesium hardness, chloride, sulphate, nitrate, DO, BOD, COD, TDS etc., were carried out – as per the methods described in APHA (1992). All the chemicals and reagents used were of analytical grade. D.D water was used for the preparation of solutions.
Results and Discussion
The results of various physico – chemical parameters for the calculation of water quality index are presented in Tables 1-3.
Temperature
Temperature of water is basically important because it effects bio-chemical reactions in aquatic organisms. The average temperature of the present study ranged from 26.2 – 28.3°C.
It is known that pH of water does not cause any severe health hazard, however higher pH includes the formation of trihalo methanes which are toxic (Trivedi and Goel, 1986). The pH values of the present investigation were within the ICMR standards (7.0 - 8.5).
Electrical conductivity is an important parameter for determining the water quality for drinking and agricultural purposes. Many dissolved substances may produce a esthetically displeasing colour, taste and odour. The values data obtained are in the range 0.5 to 1.8 mmhos.
Total Dissolve Solids: It is an important parameter for drinking as well as other purposes. TDS values ranged within 305-690 mg/lt. The high TDS values (above 500 mg/lt. may be due to proximity of sea coast.
Table 1: Physico-chemical parameters of well and bore well coastal area water samples
| Parameter | S1 | S2 | S3 | S4 | S5 | S6 | S7 |
| Temperature0c | 27.3 | 27.6 | 28.13 | 28.3 | 26.2 | 28.14 | 24.9 |
| pH | 7.75 | 7.82 | 7.16 | 7.82 | 7.58 | 7.8 | 7.58 |
| Electrical Conductivity | 0.4 | 1.7 | 0.5 | 1.7 | 0.8 | 1.8 | 1.9 |
| TDS | 305 | 690 | 408 | 690 | 474 | 576 | 702 |
| TSS | 45.7 | 64.2 | 50 | 30 | 42.3 | 53.2 | 32 |
| Hardness | 216.5 | 471.6 | 493 | 471 | 327.3 | 382.6 | 234 |
| Calcium | 49.4 | 78.8 | 124.3 | 78 | 74.6 | 89.4 | 66 |
| Magnesium | 22.4 | 66.6 | 43.8 | 66 | 5133.8 | 38.2 | 76 |
| Chloride | 103.5 | 172.7 | 210.3 | 63 | 93.7 | 109.3 | 58 |
| DO | 4.8 | 4.54 | 4.8 | 4.5 | 5 | 4.9 | 4.6 |
| BOD | 0.7 | 0.7 | 1.3 | 0.7 | 1.5 | 1.2 | 0.5 |
| Sulphate | 135.2 | 155.4 | 156.8 | 156 | 130.2 | 113.8 | 92 |
| Alkalinity | 148.2 | 160.4 | 112.4 | 170 | 130.2 | 141 | 136 |
| Nitrate | 1.05 | 2.01 | 1.38 | 2.25 | 0.76 | 0.9 | 3.02 |
| COD | 5.9 | 6.2 | 5.3 | 6.2 | 5.3 | 6.6 | 5.6 |
| Iron | 0.004 | 0.003 | 0.005 | 0.004 | 0.0026 | 0.005 | 0.005 |
-
All the parameters expressed in mg/lit. except pH and EC (mmhos)
-
All the values are the average of 3 determinations
Dissolved Oxygen(DO)
It is an important parameter which is essential to the metabolism of all aquatic organisms that posses aerobic respiration (Wetzel, 1975). Presence of DO in water may be due to direc diffusion from air and photosynthetic activity of autotrophs (Shanti et al., 2002). Oxygen can be rapidly removed from the waters by discharge of oxygen demanding wastes. The DO values obtained in the present study are within ICMR standards.
Alkanity
Most of the alkalinity in natural water is formed due to dissolution of carbon dioxide in water. In the present investigation the total alkalinity of the water samples is found in the range 112.4 to 176.8 mg/lt.
Hardness
The principal hardness causing cations are calcium, magnesium bicarbonate, carbonate, chloride and sulphates. The hardness values of the present study were found to range between 192.3 to 493.25 mg/lit.
Calcium is one of the most abundant substances of natural water being present in high quantities in the rocks and is not desirable in washing, bathing and renderings, while small concentration of calcium is beneficial in reducing the corrosion in water pipes. Magnesium hardness particularly associated with sulphate ion has laxative effect an persons un accustomed to it (Khursid,1998). In the present study calcium and magnesium contents are found in the range of 40.8- 124.3 and 18.2 – 66.6 mg/lt respectively.
Chloride
Chloride occurs in all types of natural waters. The high concentration of chloride is considered to be an indication of pollution due to high organic waste of animal origin (Singh, 1995).
Table 2: (Mishra and Patel, 2001)
| WQI | Rating | |
| 0-25 | Excellent | |
| 26-50 | Good | |
| 51-75 | Bad | |
| 76-100 | Very bad | |
| 100 and above | Unfit | |
Chloride values obtained in the study are found to be higher (210.3 mg / lt) in S3 sampling station than other stations.
BOD and COD are the parameters used to asses the pollution of surface water and ground waters. Both of the parameters (BOD and COD) values obtained in the present study are within permissible levels.
Sulphate
Sulphate ion if present in excess amount produce cathartic effect upon human beings. The sulphate ion concentration in the present investigation varied from 78.7-155.4 mg/lt.
Nitrate
Nitrate is the most important nutrients in an ecosystem. Generally water bodies polluted by organic matter exhibit higher values of nitrate. In the present study water samples from the stations (S1 To S6) showed low concentrations of nitrate (1.76 to 2.01 mg/lt) well below permissible levels as per the standards.
Water quality index (WQI)
WQI indicates the quality of water in terms of index number which represents overall quality of water for any intended use. It is defined as a rating reflecting the composite influence of different water quality parameters were taken into consideration for the calculation of water Quality index (WQI).
The indices are among the most effective ways to communicate the information on water quality trends to the general public or to the policy makers and in water quality management.
In formulation of water quality index the relative importance of various parameters depends on intended use of water. Mostly it is done from the point of view of its suitability for human consumption.
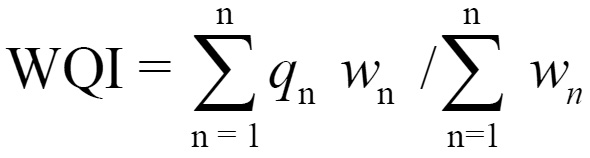
The calculation of WQI was made using weighed Arithmetic index method (Brown et al,1972) in the following steps:
Let there be n water quality parameters and quality rating (qn) corresponding to nth parameter is a number reflecting relative value of this parameter in the polluted water with respect to its standard permissible value. qn values are given by the relationship. qn=100 (vn-vi) / (vs-vi) vs = Standard value, vn = observed value vi = ideal value
Table 3: Water Quality Index of Water samples of Coastal Area
| Parameter | ICMR standard | unit weight (wn) | S1 | S2 | S3 | S4 | S5 | S6 |
| pH | 7.74 | 0.07164 | 7.7132 | 7.238 | 6.627 | 7.0159 | 7.2843 | 7.2195 |
| TDS | 500 | 0.001 | 0.061 | 0.138 | 0.0816 | 0.0948 | 0.072 | 0.1152 |
| TH | 200 | 0.00167 | 0.18077 | 0.3937 | 0.4186 | 0.2733 | 0.1606 | 0.3195 |
| DO | 5 | 0.1003 | 9.629 | 9.1072 | 9.629 | 10.03 | 8.6258 | 9.8294 |
| BOD | 5 | 0.1003 | 1.4042 | 1.4042 | 2.6078 | 3.009 | 1.6048 | 2.4072 |
| Chloride | 250 | 0.002 | 0.0868 | 0.13816 | 0.16824 | 0.07496 | 0.07144 | 0.08744 |
| Total Alkalinity | 120 | 0.00417 | 0.51499 | 0.5574 | 0.3906 | 0.4525 | 0.6144 | 0.4899 |
| NO3 | 45 | 0.01111 | 0.02123 | 0.04962 | 0.03407 | 0.0187 | 0.030614 | 0.0222 |
| Iron | 0.3 | 1.6666 | 2.222 | 1.666 | 1.111 | 1.1107 | 0.555 | 2.777 |
| wn | - | 1.98487 | - | - | - | - | - | - |
| qn | - | - | 21.83319 | 20.69228 | 21.0611 | 22.07982 | 19.01895 | 23.2673 |
| WQI | - | - | 43.33605 | 41.0715 | 41.8037 | 43.8256 | 37.7505 | 46.1826 |
In most cases vi=0 except in certain parameters like pH, dissolved oxygen etc., Calculation of quality rating for pH and DO (vi ≠ 0) q pH = 100 (v pH – 7.0) / (8.5 – 1.0) and q DO = 10 (VDO – 14.6) / (5.0-14.6).
Calculation of unit weight
The Unit weight (wn) to various water Quality parameters are inversely proportional to the recommended standards for the corresponding parameters. Wn = k/sn.
Where
wn = unit weight for nth parameter
sn = standard permissible value for nth parameter k = proportionality constant.
The unit weight (wn) values in the present study are taken from Krishnan et al., 1995 WQI is calculated by the following equation
Assessment of water quality based on WQI
Application of WQI is a useful method in assessing the suitability of water for various beneficial uses. The WQI values of the present investigation from different sampling stations are given in Table 3. It can safely be concluded that the values of WQI (in the present investigation) were reported to be less than 50, indicating that the water is suitable for human consumption.
Conclusion
The results obtained in the present study indicate that the water quality index lies in between 37 & 46 which is well below the permissible levels as per the standards. However there may be probable future contamination of the waters as the area is near to the sea coast.
Acknowledgements
The author is thankful to the principal and management, College of Engineering, GITAM University, Visakhapatnam for providing necessary facilities to carry out the investigation.
References
- Kudesia, V.P water pollution, Pragathi Prakashan, Meerut, India (1980) pp 1-12.
- Karanth K.R. Hydro geology, Tata Mc Graw Hill publishing company Ltd. New Delhi. (1989).
- Standard methods for the estimation of water and waste water 19th edn. American public Heath Association, AWWA. WPCP, New York USA (1995).
- Trivedi, R.K and Goel, P.K. chemical and Biological methods for water pollution studies, Env. Pub. Karad, India (1986).
- Wetzel, R. Limnology, W.B. Saunders Co., Philadelphuria, USA 743 (1975).
- Shanthi, K. Ramasamy, P and Lashmanperumalsamy, Hydrological study of Singanallur lake at Coimbatore, Nature Environment& Pollution Technology, ( 2002) 1(2): 97-101.
- Khursid, S Zaheeruddin and Basheer, A. Ind. J. Env. Prot. (1998) 18(4): 246-249.
- Singh, B.B. Evaluation of Drinking water quality at Gorakhpur (U.P) J. Ind. Council Chem., (1995) 11(2): 20-24.
- Brown, R.M. Mc cleiland N.J, Deiniger, R.A. and O’ Connor, M.F. A water quality index – crossing the physical barrier (Jenkis, S H ed) Proc. Intl. Conf. on water poll. Res. Jerusalem (1972) 6: 787-797.
- Krishnan, J.S.R, Rambabu K and Rambabu C., Studies on water quality parameters of bore waters of Reddigudum Mandal. Ind J. Env. Prot. (1995) 16(2): 91-98.
- Mishra P.C and Patel, R.K. Quality of Drinking water in Roukela, out side the steel town ship. J. Env. Poll. (2001) 8(2): 165-169.


