A study on correlation coefficient of some physico-chemical characteristics of Tumkur city sewage
K.S. Kumara1 * and S.L. Belagali1
1
Department of Studies in Environmental Science,
University of Mysore,
Mysore,
570 006
India
http://dx.doi.org/10.12944/CWE.3.1.11
The Tumkur city sewage samples were collected and analysed from February 2007 to January 2008 for six sampling points - residential area (S1), business centre (S2), slum (S3), converging point (S4), open drain (S5) and treated sewage water (S6). The correlation coefficient ‘r’ of some physico-chemical parameters is derived. There is wide variation in the sewage quality, which is reflected by the results. The usefulness of this approach has been demonstrated to predict the quality of domestic waste. The result of the study is useful to predict the anthropogenic activities of the area. The present study reveals the significant correlation among pH-alkalinity, electrical conductivity-total dissolved solids, hardness- chloride, BOD-COD, although the quality of sewage varied significantly. The study of correlation coefficient facilitates the rapid monitoring process of sewage and gives an idea of treatment technique.
Copy the following to cite this article:
Kumara K.S, Belagali S.L. A study on correlation coefficient of some physico-chemical characteristics of Tumkur city sewage. Curr World Environ 2008;3(1):83-92 DOI:http://dx.doi.org/10.12944/CWE.3.1.11
Copy the following to cite this URL:
Kumara K.S, Belagali S.L. A study on correlation coefficient of some physico-chemical characteristics of Tumkur city sewage. Curr World Environ 2008;3(1):83-92. Available from: http://www.cwejournal.org/?p=748
Download article (pdf)
Citation Manager
Publish History
Introduction
Sewage is a domestic waste enriched with nutrients and plays vital role in water pollution. Although, application of sewage were reported to be beneficial in increasing crop yield and reduce fertilizer requirement but leads to the accumulation of toxic metals in the soil and ultimately creates health problems.1 The sewage comprises organic, inorganic and biological components. The chemistry of sewage is influenced by the inputs of materials containing minerals, their solubility and chemical equilibrium prevailing in the aqueous solutions. Based on anthropogenic activities, the composition of sewage greatly varies in different geographical regions.2 Derivation of correlation coefficient ‘r’ among sewage parameters greatly facilitates the task of rapid monitoring process.3 It is useful in identifying the appropriate methodology for treatment and to design the facility for disposal and reuse of sewage.4 Since a definite correlation usually exists among the sewage quality parameters, a systematic calculation and interpretation of correlation coefficient gives an idea of treatment techniques.5
Several researchers have attempted to determine the correlation coefficient of physico-chemical characteristics of water bodies and waste waters.6-15 The literature revealed that, the correlation coefficient studies on sewage are limited. Hence, an attempt has been made to study the correlation coefficient of physico-chemical characteristics of Tumkur city sewage.
Materials and Methods
Tumkur city is situated between 13°19'00'' to13°21'19" N latitude and 77° 05' 26" to 77° 07' 12" E longitude at 818.51m on MSL and 68 Km northwest of Bangalore city. The city spread area is about 102.6 Sq km. The 70 % of city area is covered by under ground drainage (UGD) facility.
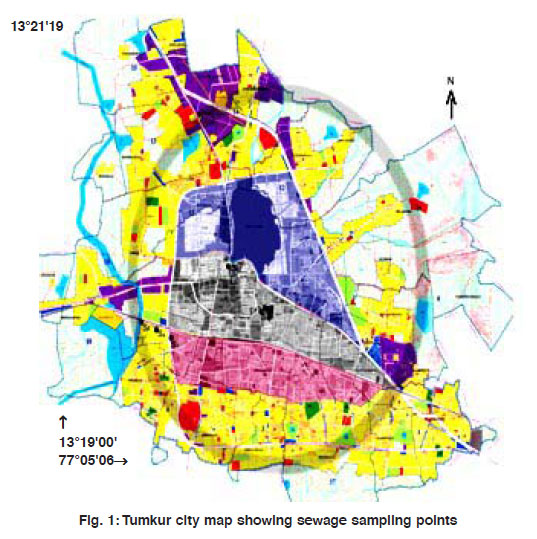 |
Figure 1: Tumkur city map showing sewage sampling points Click here to view figure |
City sewage samples were collected separately in 3 litre polythene cans from six sampling points - S1,S2,S3(closed), S4(converging), S5(open) and S6(treated) (Fig.1) between 7AM to 8AM on first week of every month and immediately brought to the laboratory for analysis. The Temperature, pH, EC, TDS, DO, CO2, H2S, BOD, COD, Acidity, Alkalinity, Hardness, Chloride, Nitrate and Phosphates were estimated following the standard methods.16, 17 The Pearson correlation coefficient ‘r’ was calculated using Pentium-IV Windows EXCEL statistical package.
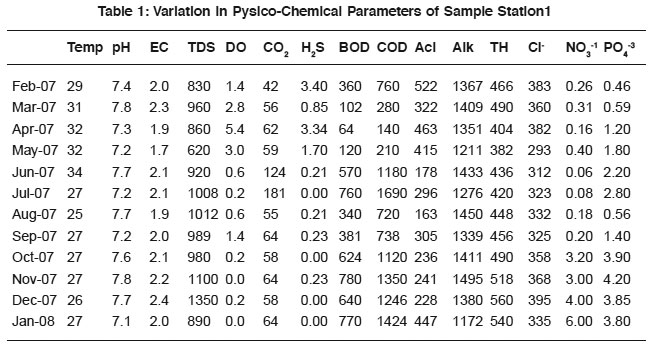 |
Table 1: Variation in Pysico-Chemical Parameters of Sample Station1 Click here to view table |
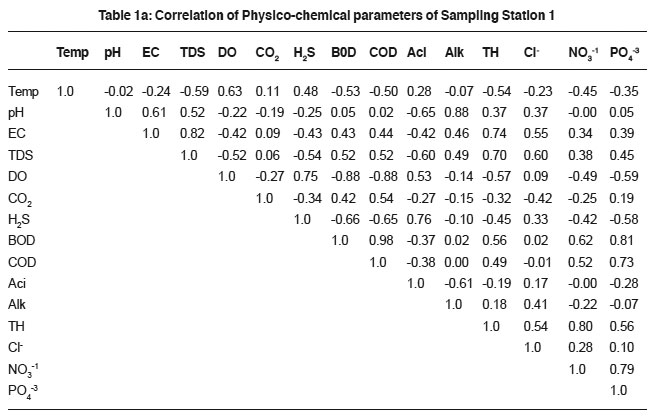 |
Table 1a: Correlation of Physico-chemical parameters of Sampling Station 1 Click here to view table |
Results and Discussion
The physico-chemical characteristics of sewage in different areas of Tumkur city are presented in Table 1 to 6 and their Pearson correlation coefficient ‘r’ values are shown in the Table 1a to 6a. The sewage quality parameters revealed variations, which depend upon the anthropogenic activities, geochemical composition, climatic conditions and biological activities of microbes.
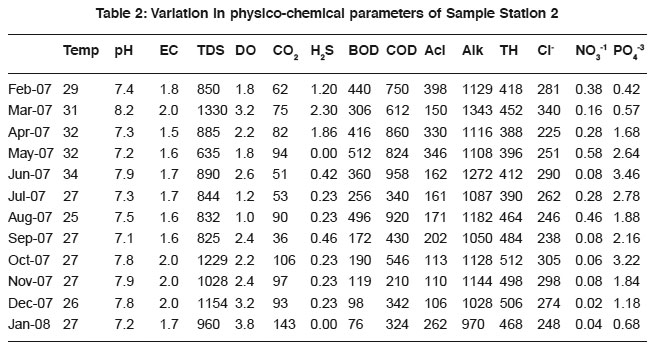 |
Table 2: Variation in physico-chemical parameters of Sample Station 2 Click here to view table |
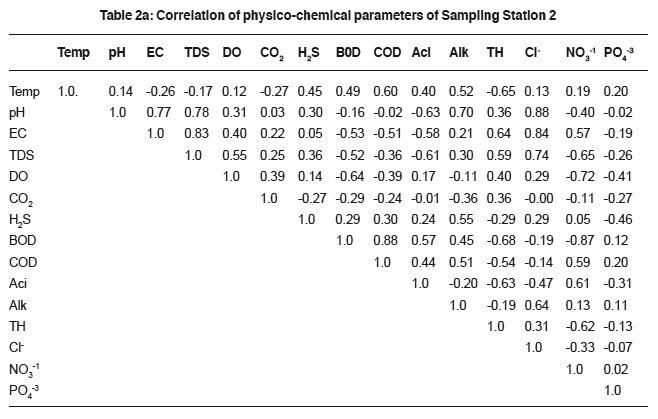 |
Table 2a: Correlation of physico-chemical parameters of Sampling Station 2 Click here to view table |
The temperature variation attributed to the active biological processes and decomposition of organic matter.18, 19 Sewage temperature positively correlates with DO in sample-1 (0.63), 2(0.12), 3(0.32) and 4(0.14), H2S in sample-1to 6 (0.48, 0.45, 0.42, 0.32, 0.58 and 0.18), acidity (0.28, 0.40, 0.60, 0.47 and 0.46 in sample-1 to 5 correspondingly), BOD (0.49, 0.26 and 0.32 in 2, 5 and 6 samples) and COD(0.60, 0.11 and 0.41 in sewage samples 2, 5 and 6). The variation in the correlation coefficient values are attributed due to the sewage quality and the anthropogenic activities.
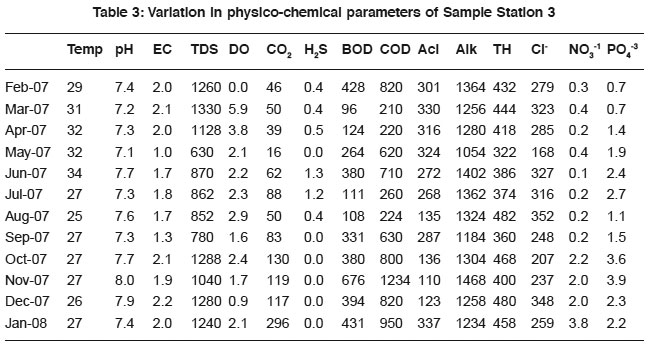 |
Table 3: Variation in physico-chemical parameters of Sample Station 3 Click here to view table |
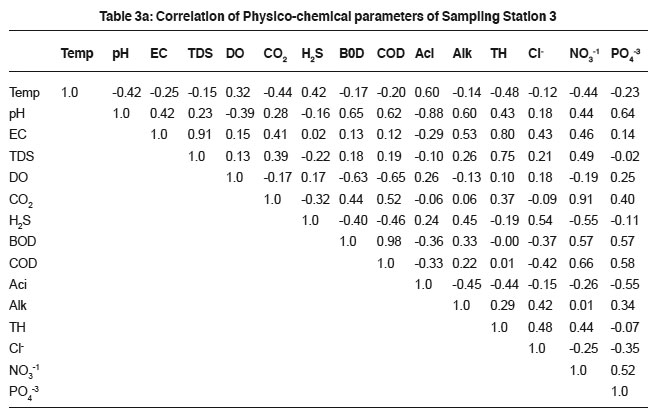 |
Table 3a: Correlation of Physico-chemical parameters of Sampling Station 3 Click here to view table |
It was observed that sewage was alkaline in nature during the study period. The results are possibly due to photosynthetic assimilation of inorganic carbon.20 pH determination is essential for assessing the suitability of sewage for biota and treatment measures. The results showed positive relationship with conductivity (0.61, 0.77, 0.42, 0.52, 0.21 and 0.03), total alkalinity (0.88, 0.70, 0.60, 0.40, 0.50 and 0.75) and dissolved solids (0.82, 0.83, 0.91, 0.75, 0.91 and 0.78) for all the samples. The significant value indicates that the ions responsible for pH also contribute to the conductivity, alkalinity and dissolved solids. Such a relationship was also reported.21
 |
Table 4: Variation in physico-chemical parameters of Sample Station 4 Click here to view table |
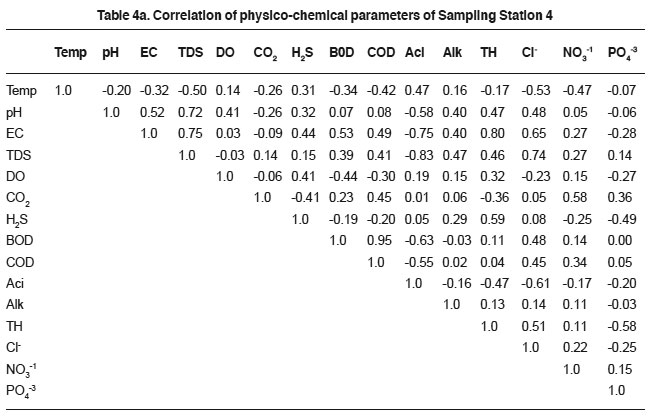 |
Table 4a. Correlation of physico-chemical parameters of Sampling Station 4 Click here to view table |
The conductivity is an index of total number of ions in sewage. High conductivity is usually the indication of chloride, dissolved solids and total hardness. Nevertheless the concentration of cationic and anionic contents in sewage had profound impact on electrical conductivity22. The EC showed positive relationship with total dissolved solids (0.82, 0.83, 0.91, 0.75, 0.91 and 0.78), hardness (0.74, 0.64, 0.80, 0.61 and 0.78) and chlorides (0.55, 0.84, 0.43, 0.65 and 0.70). The relation of EC could be explained on the basis of solubility of minerals and other inorganic matter. The results are harmony with the earlier findings.23
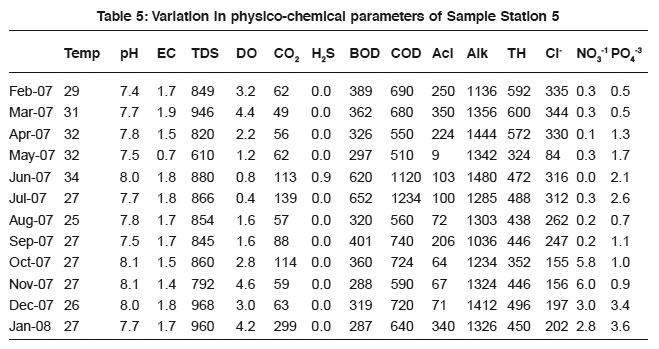 |
Table 5: Variation in physico-chemical parameters of Sample Station 5 Click here to view table |
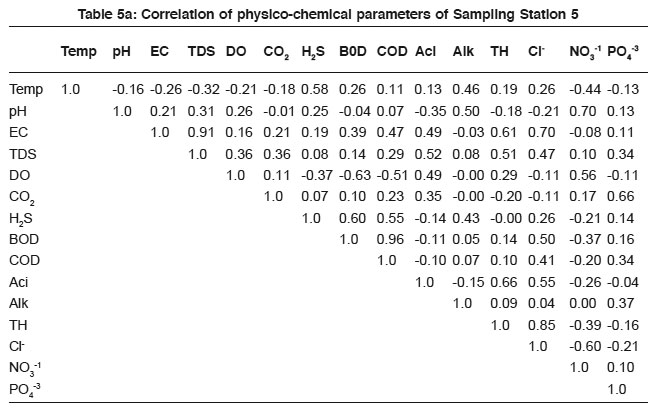 |
Table 5a: Correlation of physico-chemical parameters of Sampling Station 5 Click here to view table |
DO level in sewage is confined with respiratory activities of microbes and also the chemosynthetic processes of phytoplankton. It varies according to the density and metabolic activities of micro flora and fauna. As the amount of salt increase in sewage the amount of dissolved oxygen decreases.24 Hence DO negatively correlate with BOD (- 0.88, - 0.64, - 0.63, - 0.44, -0.63 and - 0.52) and COD (- 0.88, -0.39, -0.65, -0.30 and - 0.51). The results are in agreement with the previous findings.14, 22
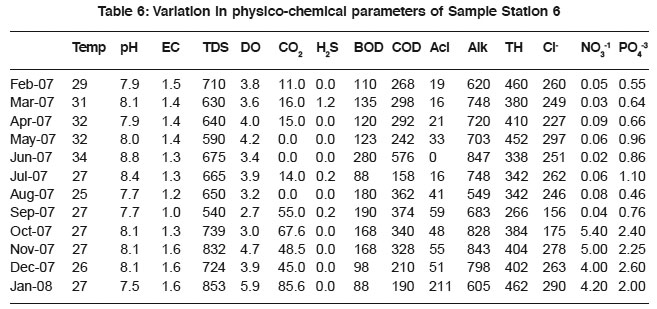 |
Table 6: Variation in physico-chemical parameters of Sample Station 6 Click here to view table |
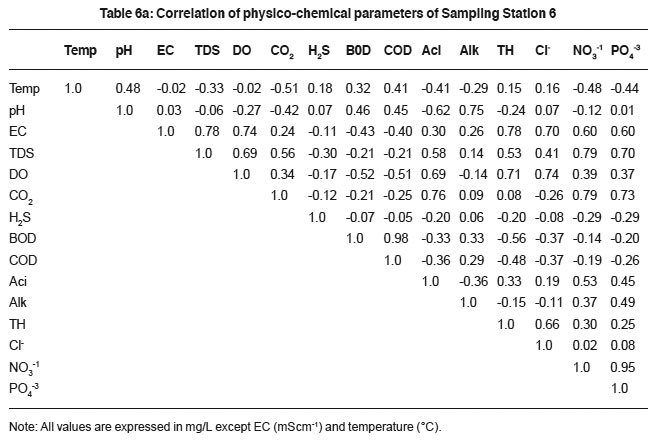 |
Table 6a: Correlation of physico-chemical parameters of Sampling Station 6 Click here to view table |
The higher values of total alkalinity indicate low photosynthetic rate. It implies a large reserve of carbon dioxide, which provides inorganic carbon for the support of phytoplankton.25 The high alkalinity attributed to increased rate of organic decomposition, during which carbon dioxide is liberated and reacts with sewage to form bicarbonate thereby increasing the total alkalinity. It relates positively with pH, EC, TDS, H2S, BOD and COD (Table 1a to 6a). The relation supports the hypothesis of the dependence of alkalinity on sewage ionic density.
Total hardness of sewage is due to concentration of salts especially of divalent metallic salts of calcium and magnesium. The higher values are due to the excessive dumping of domestic waste, detergents and carbonate minerals. Calcium, magnesium and total hardness in sewage are interrelated. And hardness correlates with EC, chloride and TDS (Table 1a to 6a).
Chloride content is an indication of eutrophication caused by animal and domestic waste.26 The higher concentration of chloride content in the sewage is possibly due to large scale chemical fertilizers and animal waste, which may have percolated from surface to sewage. Chloride showed relationship with TDS (0.60, 0.74, 0.21,0.74, 0.47 and 0.79), EC (0.55, 0.84, 0.43, 0.65,0.70 and 0.0) and pH (0.37, 0.88, 0.18, 0.48,-0.21 and 0.07).
The decomposition of organic matter and the slow oxidation process in sewage leads to increase in nutrient level. The higher phosphate levels may interfere in treatment plants. The correlation coefficient ‘r’ values with sewage quality parameters are presented in Table 1a to 6a.
The study revealed that, the highest Pearson correlation coefficient was observed between BOD and COD. The significant correlation coefficient exists between pHalkalinity, EC-TDS, nitrate-phosphate, nitrate- BOD, EC-chloride and EC-TH (Table1a to 6a). The study aims to establish a systematic correlation between the physico-chemical parameters of sewage. It gives useful indication of sewage quality and also facilitates the rapid monitoring status of treatment measures.
Acknowledgements
The authors are grateful to the management of Sri Siddhartha First Grade College, Tumkur and Prof H.N.Vijayendra, Principal for the encouragement. First author is also thankful to Dr. M.B.Nadoni, Prof C.Vijayabhaskar, Prof. M.S. Jayaprakash for their valuable suggestions and to Dr.M.K.Veeraiah, Prof.B.Manjunath and Prof. B. Mallesh of SSIT, Tumkur, for the laboratory facility.
References
1. Sharma, O P, Bangar K.S and Sharma P.K., Res. J. Chem. Environ (2004) 8(2): 62.
2. Abdul Jameel A and Zahir Hussain., Ind.J. Env. Prot., (2003) 23(6): 660.
3. Tiwari T N and Ali N., Ind.J. Env.Prot., (1988) 8(1): 44.
4. Tchobanoglous G., Waste water engineering-treatment, disposal and reuse (2nd Edition) Metcolf-Eddy, Inc, Tata McGraw Hill Pub Co., New Delhi. (1979).
5. Aravinda H B., Poll. Res. (1998) 17(4): 371.
6. Thergaonkar V P and Kulkarni D N., Ind.J. Env. Health, (1971) 13: 149.
7. Gajghate D G and Reddy P J., Ind.J. Env. Prot., (1980) 9(11): 805.
8. Kannan N, Rajashekaran N and Vallinayagam P., Ind.J. Env.Prot., (1991) 11(11): 85.
9. Reddy P J, Krishna D and Gajghate D J ., Poll. Res. (1992) 11(2): 69.
10. Sanjay Kumar, Nikhil Garg and Krishna Gopal., Ind.J. Env.Prot., (1994) 14(8): 595.
11. Somashekara Rao and Someshwara Rao B., Ind.J. Env.Prot., (1994) 14(7): 528.
12. Singanan and Somashekar Rao K., Ind. J. Env. Prot., (1995) 15(3): 213.
13. Sulochana N, Stephan Inbaraj B, Selvarani K and Thirumuragan., Ind.J. Env.Prot., (1999) 19(4): 290.
14. Mahuya Dasgupta Adak and Purohith., Ind.J. Env. Prot., (2000) 21(4): 295.
15. Mohapatra, B. Das and Chakravorthy., Poll Res. (2001) 20(3): 401.
16. APHA AWWA WEF ., Standard methods for examination of water and waste water, 19th edition, Washington DC (1995).
17. Trivedy and Goel ., Chemical and biological methods of water pollution studies. Environmental Publication, Karad (1986).
18. Selvam V, Hariprasad V, Mohan R and Ramasubramanyan R ., Ind.J of Mari Sciences., (1994) 23: 94.
19. Guruprasad B., Nat. Env. Poll. Tech., (2005) 4(4): 521.
20. King D L., The role of carbon in eutrophication. Ecology. (1970) 42: 2035.
21. Bharadwaj, K and Sharma, L.L ., J.Env.Poll., (1989) 6(4): 255.
22. Nayak B.K, Acharya B C, and Panda, U C ., Ind. JMari. Sciences. (2004) 33(2), 164.
23. Kataria H C, Iqbal S A anddd Shandlya A K., Ind. J. Env.Prot., (1995) 16(11): 841.
24. Milind Hujare ., Nature Env. Poll. Tech. (2008) 7(1): 43.
25. Sinada F and Abdel Karim, Hydrobiologia, (1984) 110: 21.
26. Munavar M., The biotope, Hydobiologia, 35(1): 1.


