Dust load and heavy metals deposition in a seasonally dry tropical urban environment in varanasi
Anupama Pandey1 * , Kavita Tiwari1 and J. Pandey1
1
Environmental Science Divisio,
Centre of Advance study in Botany,
Varanasi,
221 005
India
http://dx.doi.org/10.12944/CWE.3.1.07
Due to rapid industrialization and urbanization lead atmospheric deposition of heavy metals and dust load to become a global problem. We investigated the deposition of dust and heavy metals (Pb, Cd, Ni, Zn, Mn and Cu) at selected urban and sub-urban sites of Varanasi, India. Dust- fall samples from different sampling location were collected and selected heavy metals viz. Pb, Cd, Cr, Ni, Zn, Mn and Cu in them were determined by atomic absorption spectrophotometer. Average flux of 2.882, 0.338, 2.964, 12.220, 22.275 and 2.890 g h-1 y-1 were measured for Pb, Cd, Cr, Ni, Zn, Mn and Cu respectively. The result has shown that dust load significantly higher in summer and winter as compared to rainy season. The deposition rate of Ni, Pb, Mn and Cr were significantly higher during summer and that of Cd, Cu and Zn deposition rates were highest during winter. The present study showed that dust load and deposition rate of mostly heavy metals significantly higher during summer and lowest during rainy season and clearly points out the urban areas of the city have potential to elevate the levels of heavy metals in the atmospheric deposits.
Copy the following to cite this article:
Pandey A, Tiwari K, Pandey J. Dust load and heavy metals deposition in a seasonally dry tropical urban environment in Varanasi. Curr World Environ 2008;3(1):45-54 DOI:http://dx.doi.org/10.12944/CWE.3.1.07
Copy the following to cite this URL:
Pandey A, Tiwari K, Pandey J. Dust load and heavy metals deposition in a seasonally dry tropical urban environment in Varanasi. Curr World Environ 2008;3(1):45-54. Available from: http://www.cwejournal.org/?p=740
Download article (pdf)
Citation Manager
Publish History
Introduction
Atmospheric activities have dramatically raised the atmospheric concentration of pollutants and trace elements in many parts of the world. Although some developed countries such as USA have witnessed some control, atmospheric emissions of pollutants and trace elements are continue to rise in many developing countries including India. Verma (1989) reported 190.0, 120.0, 50.0, 140.0 and 142.0 mg of Ni, Zn, Cu, Cr, and Mn per Kg of atmospheric particulates in the vicinity of an integrated steel plant in Rourkela in India. Biblos et al. (2001) reported atmospheric load of Pb – 64.5, Cr – 4.32, Cd – 0.41 and Ni – 3.15 ngm-3 in La Plata, Argentina. Sweet et al. (1993) have also reported that atmospheric load of Pb, Cr, Cd, Ni in Southeast Chicago, USA were 127.0, 11.2, <4.0 and 4.8 ngm-3.
Due to rapid urban and industrial development most parts of our country are receiving increasingly high levels of gaseous and particulate pollutants (Pandey et al., 1992; Pandey and Agrawal, 1994; Pandey, 2005). The latter contains a variety of toxic trace elements. Depending upon the size, nature and climatic variables these pollutant elements eventually deposit of ground surfaces thereby contaminating the soil, water, dietary vegetable and crops (Pandey and Pandey, 2007). The last two decades have witnessed extensive data collection from all over the world on atmospheric deposition of trace elements. According to Pilgrim and Hughes (1994) atmospheric flushing of Cu, Zn, Pb, Cd in New Brunswick, Canada were 0.10 – 49.7, 3 – 401, 0.046 – 20.1, 0.007- 313 g ha-1yr-1. Momani et al. (2000) have also reported atmospheric deposition of Zn, Cu, Pb, Cd in Amman, Jorden were 2474, 462.8, 344.8, 12.5 µg m-2 mon-1. Christophe et al. (1997) have reported that the total atmospheric flushing of Cd, Co, Cu, Ni and Zn in Aliage Industrial site, Turkey were 0.18, 0.35, 6.0, 3.7 and 220 µgm-2d-1. Vousta et al. (1996) have reported 7-1020, 3.2-24, 0.76-78m-3 of Pb, Cr, and Cd of atmospheric particulate in Ionia, Greece.
In India, Thakur et al. (2004) have reported substantially high input of airborne trace metals at Madhya Pradesh. Similar observation has shown by Sharma et al. (2007) in Varanasi, that atmospheric deposition of heavy metals are significantly higher and it is clearly defined that the urban and industrial activities of the city, have potential to elevate the levels of heavy metals in the atmospheric deposits, which may consequently contaminate the soil, air and water and thus posing health risk to the local population.
Material and Methods
The present study was conducted in the urban and suburban areas of Varanasi, which is located (lat 25° 18’N, long 83° 01’E and alt 76.19m) in eastern Gangetic plains of India. The climate of the city is dry tropical with three distinct seasons i.e. summer, winter and rainy. The summer season (March-June) in Varanasi is usually dry, associated with strong hot winds, high temperature during the day ranging between 30-45°C, relative humidity 25-45% and infrequent pre-monsoon rain. Rainy season starts end of June and continues till mid October. During rainy season, the temperature varies from 24-36°C and relative humidity from 70-95%. Winter season starts in November and continues till February, temperature ranges between 10-25°C; relative humidity varies between 40-79%.
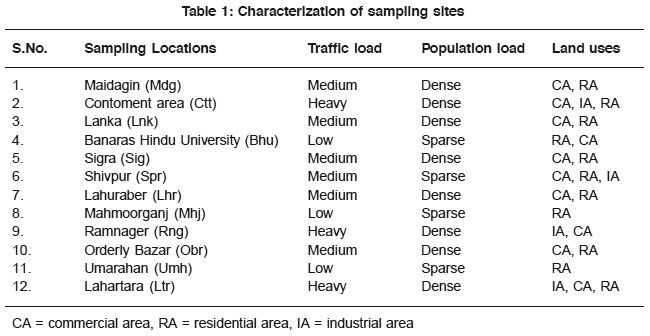 |
Table 1: Characterization of sampling sites Click here to view table |
Varanasi city is one of the most densely populated cities of India having many small scale industries, compact residential areas and congested narrow roads. A large number of small scale industries such as fabric, printing and dyeing etc. and various manufacturing industries including iron gates, table fans, bicycle tires and heavy agricultural equipments are dispersed in west and north-west of the city centre. The numbers of vehicles plying in the city are more than 1, 00,000.
Sampling Sites
The present study was carried out from November 2006 to October 2007 in urban and suburban areas of Varanasi. 12 different sampling sites based on heavy traffic, residential, commercial and sub-urban areas were selected. Sampling was carried out simultaneously at all the 12 sites for one year period with deposition dust collector having 6.8 to 7.8 cm diameter of mouth area. The deposition dust collectors were placed at the height of about 3-5 m from the earth surface at selected sites. After the collection of dust, measured the dust fall rate-Dust fall rate = Weight of dust / mouth area of dust collector
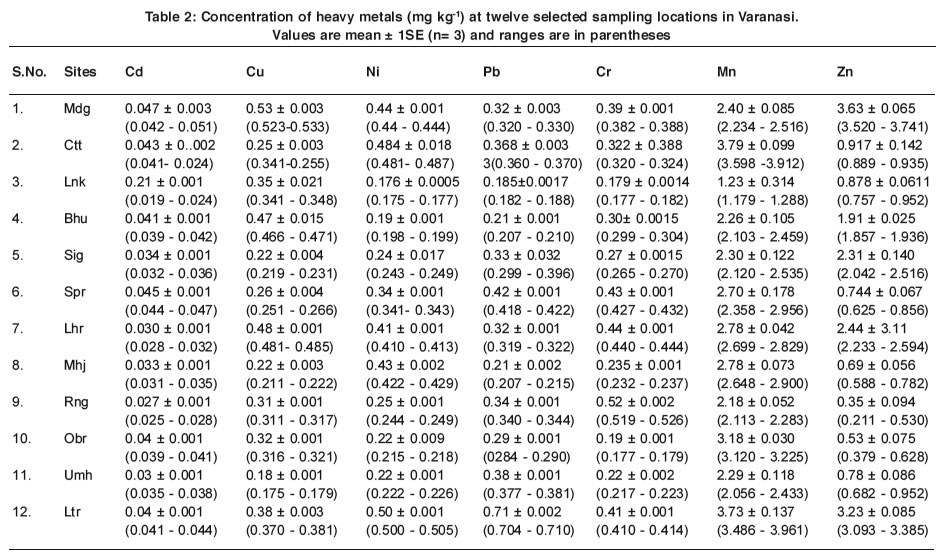 |
Table 2: Concentration of heavy metals (mg kg-1) at twelve selected sampling locations in Varanasi. Values are mean ± 1SE (n= 3) and ranges are in parentheses Click here to view table |
The sampling zone location and their details are given in table-1.
Analytical Method
After collection of samples from each sites the atmospheric dust were analysed by tri acid (69% high purity HNO3, 70% HClO4 and 98% H2SO4; 5:3.3) digestion method. Tri-acid mixture (15 ml) were added to the beaker containing 1 g atmospheric dust and heated at 800C till the solution become transparent (Allen et al. 1986). The resulting solution was cooled and filtered through Whatman no. 42 filter paper. The filtered solution was finally maintained to 50 ml using deionized water and kept at room temperature for further analysis of heavy metals. Determination of the elemental composition of the filtrate was achieved by Atomic Absorption Spectrophotometer (Model 2830 Perkin-Elmer, Inc., Norwalk, CT, USA). The instrument was calibrated using manually prepared standard solution of respective heavy metals. Acetylene gas was used as the fuel and air as the support. An oxidizing flame was used in all cases.
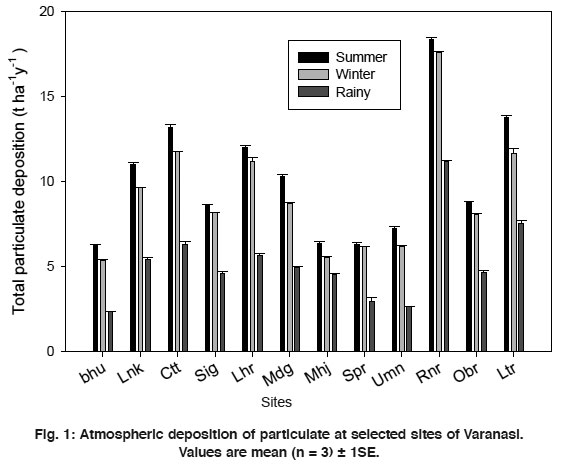 |
Figure 1: Atmospheric deposition of particulate at selected sites of Varanasi. Values are mean (n = 3) ± 1SE. Click here to view figure |
Statistical Analysis
Mean values are supported with SE and range to justify the variability. All statistical analyses were performed using the Microsoft SPSS (version-10. and all graphs were plotted through sigma plot -8.0.
Results and Discussion
The annual dust deposition rates at 12 selected sampling locations in urban and sub-urban areas of Varanasi. (Fig. 1) showed seasonal variations of dust deposition rate which presented in mean ± 1SE (n=3). The seasonal variations of dust deposition rate are higher during the summer and winter seasons as compared to rainy season. Wong et al. (2003) ascribed the reason for the lowest deposition rates in rainy season to washout effects of frequent rainfall events. The result showed that Rng, Ltr and Ctt, which are heavy traffic areas, receives high amount of dust load 18.36 ± 0.099, 13.77±0.077 and 13.12±0.132 t ha-1 yr-1 respectively in summer season. These sampling location receive high dust load in other seasons too. In winter season these sites received 17.58±0.038, 11.66±0.030 and 11.74±0.045 and in rainy season, 11.17±0.056, 7.54±0.172 and 6.30 ± 0.169 t ha-1 yr-1 respectively.
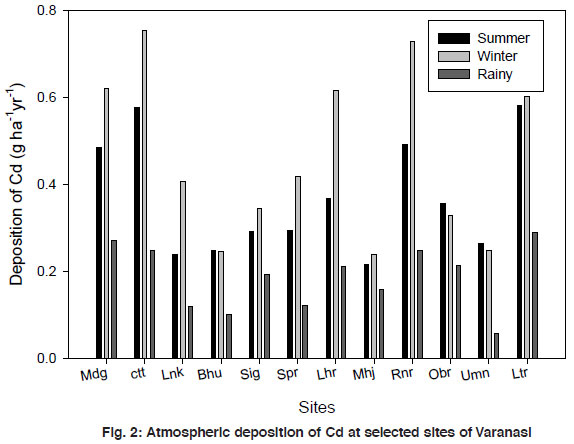 |
Figure 2: Atmospheric deposition of Cd at selected sites of Varanasi Click here to view figure |
Minimum dust deposition were found in Bhu, Mhj and Spr in summer which is 6.23±0.086, 6.35± 0.120 and 6.32±0.101 t ha-1 yr-1 respectively. But in winter season, minimum dust load was found in Bhu, Mhj and Spr, which are 5.34 ± 0.066, 5.53 ± 0.034 and 6.15 ± 0.041 respectively. In rainy season the minimum dust deposition receiving sites are Bhu, Umh and Spr, which received 2.32 ± 0.054, 2.63 ± 0.034 and 2.92 ± 0.279 t ha-1 yr-1 respectively. The dust deposition rate varied between 18.36 t ha-1 yr-1 at Rng in summer and 2.32 T ha-1 yr-1 at Bhu campus during the rainy season. Minimum values were found during rainy and maximum in summer. During the rainy season, dust deposition rate decreases 50% as compared to summer season. During March June, high rate of dust fall could be due to air borne dust as a result of frequent nor-western. During rainy season they are washed out more or less efficiently by rain but in other season dry deposition is predominant. According to the US researchers, dust fall rates in tropical environment, like India is found to be many times higher than in temperate countries climate, like USA (Bhowmik,et al.,2000).
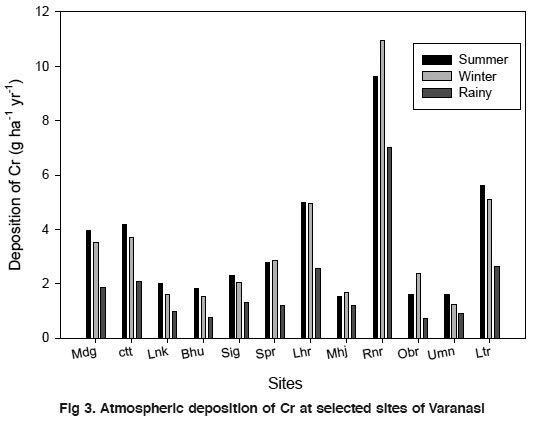 |
Figure 3. Atmospheric deposition of Cr at selected sites of Varanasi Click here to view figure |
Deposition of Heavy Metal
The results showed that, deposition of Cd, Cr, Cu, Mn, Ni and Zn were significantly higher during summer and winter season as compared to rainy season. In summer, atmospheric deposition rates of Cd (g ha-1 yr-1) ranged from a minimum of 0.216 at Mhj to a maximum of 0.580 at Ltr, in winter season, Cd deposition rate ranged, from a minimum of 0.238 at Mhj to maximum of 0.290 g ha-1 yr-1 Ctt. In rainy season deposition of Cd was lowest at Umh which was 0.059 and highest at Ltr, 0.290 g ha-1 yr-1. On an average the Cd deposition is found to be 0.338 g ha-1 yr-1 which is 0.04 × 10⁻⁴ % of total annual dust-fall of Varanasi city. The concentration of Cd in dust-fall was found to be highest at Mdg 0.047 ± 0.003, which ranges between 0.042- 0.051 and the lowest at Lnk 0.021 ± 0.001 which ranges between 0.019-0.024 mg kg-1. Most of the Cd comes from anthropogenic sources. The important sources of Cd are coal and oil combustion. Chronic exposure to Cd can result in respiratory illness, hypertension and heart enlargement resulting in premature death. In summer, Cu deposition was highest at Rng which was 5.786 g ha-1 yr-1, in winter season, deposition rates of Cu (g ha-1 yr-1) maximum at Rng, which was 5.857 and minimum deposition 0.246 g ha-1 yr-1 at Umh. In rainy season, Cu deposition rate ranged maximum at Rng and minimum at Umh, which is 3.769-0.448 g ha-1 yr-1. On an average the Cu deposition rate was found to be 2,907 g ha-1 yr-1, which is 0.349 × 10⁻⁴ % of the total annual dust-fall of the city. The concentration of Cu in dust-fall was found highest at Mdg 0.529 ± 0.0031, which ranges between 0.523-0.533 mg kg-1 and the lowest concentration was found at Umh, 0.177 ± 0.001, which ranges between 0.17500.179 mg kg-1.
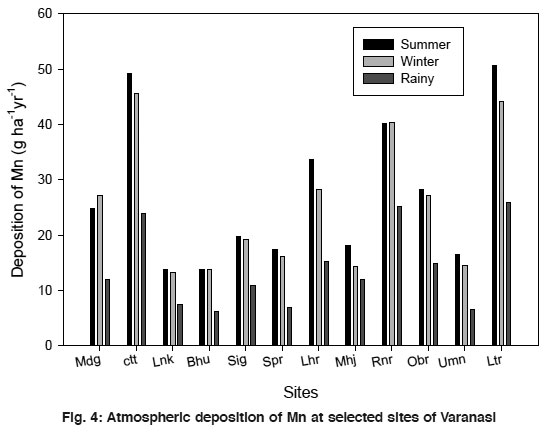 |
Figure 4: Atmospheric deposition of Mn at selected sites of Varanasi Click here to view figure |
In summer, deposition rate of Ni was highest at Ltr which was 6.840 g ha-1 yr-1 and lowest 1.235 g ha-1 yr-1 at Bhu, in winter season, highest deposition at Rng which was 7.899 g ha-1 yr-1 and 1.745 g ha-1 yr-1 lowest deposition at Obr. In rainy season, Ni deposition rate was highest at Ltr, where deposition rate was 4.521 g ha-1 yr-1 and lowest at Umh where deposition rate was 0.631 g ha-1 yr-1. On an average the Ni deposition in city was found to be 2.907 g ha-1 yr-1, which is 0.356 × 10⁻⁴ % of the total annual dust-fall of Varanasi. The concentration of Ni in dust-fall was found highest at Ltr 0.502 ± 0.002, which ranges between 0.500-0.505 mg kg-1 and the lowest concentration was found at Lnk 0.176 ± 0.001, which ranges between 0.175- 0.177 mg kg-1. Ni in the atmosphere originates from the combustion of fossil fuel, smelting, crustal sources and volcano. It is also found that combustion of oil and incineration of waste contributes more than 70 % of total Ni to the atmosphere from man-made sources followed by refining process with 17 % (IPCS, 1991b). Continuous and prolonged exposure to Ni can produce dermatitis and disorders in the respiratory system and it is also a possible carcinogen.
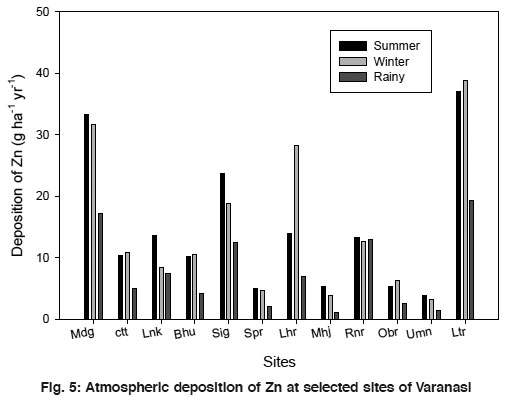 |
Figure 5: Atmospheric deposition of Zn at selected sites of Varanasi Click here to view figure |
Deposition rate of Pb (g ha-1 yr-1) was to be maximum of 9.626 at Ltr to minimum of 1.268 at Umh in summer; in winter, maximum deposition rate of Pb was 8.537 g ha-1 yr-1 at Ltr and minimum deposition rate of Pb 1.473 g ha-1 yr-1 at Mhj. In rainy season, maximum deposition 5.076 g ha-1 yr1 was at Ltr and minimum at Bhu, where deposition rate was 0.555 g ha-1 yr-1. On an average the Pb deposition was found to be 2.883 g ha-1 yr-1, which is 0.352 × 10⁻⁴ % of the total annual dust load of the city. The concentration of Pb in dust-fall was found highest at Ltr, 0.707 ± 0.002, which ranges between 0.704-0.710 mg kg-1 and the lowest concentration was found to 0.185 ± 0.002 at Lnk, which ranges between 0.182-0.188 mg kg-1. The Pb concentration found in various environmental compartments bordering a roadway is a function of a no. of factors, including distance and meteorology (Mielke, 1991). It has been recorded that only 25 % of Pb emitted by vehicles are in coarse fraction and thus, deposit close to roads. The remaining 75 % in fine fraction and so may remain air borne (Hana and Al- Bashan, 1983; Furgusson and Kim, 1991) contaminating areas more remote from the point of its emission. In summer, highest Cr deposition was found at Rng and lowest deposition rate at Mhj where range of deposition was 9.635-1.534 g ha-1 yr-1, in winter season Cr deposition rate was highest at Rng which was 10.944 g ha-1 yr-1 and lowest Cr deposition rate was found at Umh, where deposition rate was 1.242 g. ha-1 yr-1. In rainy season, highest deposition rate was found at Rng where, deposition is 7.013 g ha-1 yr-1 and lowest deposition at Orderly bazaar where deposition rate was 0.725 g ha-1 yr-1. On an average the deposition of Cr in city was found to 2.964 g ha-1 yr-1, which is 0.362 × 10⁻⁴ % of total annual dust deposition of Varanasi. The concentration of Cr in dust-fall was found highest at Rng 0.522 ± 0.002 which ranges between 0.519 – 0.526 mg kg-1 and the lowest concentration was found 0.178 ± 0.0006, which ranges between 0.177-0.179 mg kg-1.
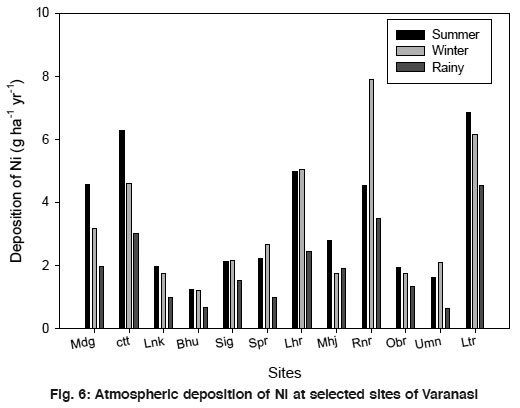 |
Figure 6: Atmospheric deposition of Ni at selected sites of Varanasi Click here to view figure |
Cr originates from combustion of fossil fuel and industrial activities. Long exposure of Cr to workers and neighbors of industries can cause irritation of respiratory system; perforation of nasal passage and lung cancer, chronic exposure may also lead to liver and kidney damages.
In summer, highest deposition rate of Zn was found at Ltr, which was 36.980 g ha-1 yr-1 and lowest 3.814 g ha-1 yr-1 at Umh. In winter, highest deposition rate was found at Ltr and lowest at Umh which was 38.814 to 3.193 g ha-1 yr-1 and in rainy season, highest deposition rate of Zn was found at Ltr which was 19.322 and lowest at Mhj which was found to 12.220 g ha-1 yr-1 which is1.473 × 10-4 % of total dust deposition per year in Varanasi. The concentration of Zn in dust-fall was found highest at Ltr, 3.634 ± 0.0645, which ranges between 3.520-3.741 mg kg-1 and lowest concentration was found to 0.350 ± 0.009 at Rng, which ranges between 0.211 - 0.530 mg kg -1.
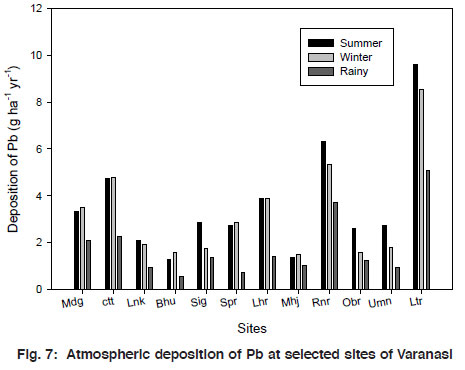 |
Figure 7: Atmospheric deposition of Pb at selected sites of Varanasi Click here to view figure |
Atmospheric deposition rate of Mn, highest at Ltr, which is 50.723 g ha-1 y-1 and lowest at Bhu, which is 13.717 g ha-1 y-1 in summer, in winter season, highest Mn deposition rate was found at Ctt, where, deposition rate was 45.494 g ha-1 y-1 and lowest rate was found at Lnk, which was 13.205 g ha-1 y-1 , in rainy season, highest deposition rate was 25.933 g ha-1 y -1 found at Ltr and lowest deposition rate was found at Bhu, which was 6.178 g h-1 y-1. On an average the deposition of Mn in city was found to 22.275 g h-1 y-1 which is 2.672×10⁻⁴% of total annual dust deposition of Varanasi. The concentration of Mn in dust-fall was found highest at Ctt 3.795 ± 0.010, which ranges between 3.598-3.912 mg kg-1, and lowest concentration was found at Lnk 1.23 ± 0.031 which ranges between 1.179-1.288 mg kg-1.
 |
Figure 8: Atmospheric deposition of Cu at selected sites of Varanasi Click here to view figure |
The deposition rate of Ni, Pb, Mn and Cr were significantly higher during summer and winter season as compared to rainy Cd, Cu and Zn deposition rate was significantly higher in winter and summer as to rainy season. Depositions of all heavy metals were lowest in rainy season. The results of seasonal variations in heavy metal deposition rates showed that frequent rain fall during rainy season removed the particulates containing heavy metals from the atmosphere that resulted into least deposition rates of all ascribed the season for the lowest deposition rate in rainy season to washout effects of frequent rain fall events. During late summer season, when rain fall starts, fine particulates attached to rain droplets can also gather contaminants from wider area and from greater heights than sampling locations (Sweet et al., 1998; Wong et al., 2003). These factors could lead to an increase in atmospheric deposition heavy metals in summer.
Conclusion
The present study showed that atmospheric deposition rate of metals and dust load in urban areas of varanasi were significantly elevated reflecting strong anthropogenic inputs through urban, vehicular and industrial activities. In urban areas of the city normally dust deposition and metal deposition (Mn, Cr, Pb, Ni, Zn, Cu and Cd) are higher in compression to sub-urban areas. The elemental composition of deposit dust shows highest level for Mn and lowest for Cd. The seasonal variation had shown that deposition of dust and mostly metals significantly higher in summer and lowest during rainy.
References
- Allen, S. E., Grimshaw, H. M. and Rowland, A.P., Methods in Plant Ecology. 285-344. Oxford: Blackwell Scientific Publication (1986).
- Bhowmik, R., Mondal, R., Jana, T. K., Sen, B. K. and Sen, S., Indian J. Environ. Protect, (2000) 20(1): 54-58.
- Biblos,C., Colombo, J. C., Skorupka, C. N. and Rodrguex, Presa, M.J., Environmental Pollution, (2001) 111: 149-158.
- Christophe, M., Blandine, J. and Emmanual, N., Atmospheric Environment, (1997) 6: 889-896.
- Fergusson, J.E. and Kim, N. D., The Science of the Total Environment, (1991) 100: 125-150.
- Hana, A. A. K. and Al Basham, K. S., Water, Air and Soil Pollution, (1983)19: 3-14.
- Mielke, H. W., Water, Air and Soil Pollution, (1991) 57-58: 111-119.
- Momani, K. A., Jiries, A. G., and Jaradat, Q. M., Turk. J. Chem., (2000) 24: 231-237.
- Pandey, J., Environ. Monit. Assess., (2005) 100: 249-266.
- Pandey, J. and pandey, U., Environ. Monit. Assess. DOI 10.1007 / s10661- 007- 0139-8 (2007).
- Pandey, J., and Agrawal, M., The New Phytologists, (1994) 126: 53-61.
- Pandey, J., Agrawal, M., Khanam, N., Narayan, D., and Rao, D. N., Atmospheric Environment, (1992) 26B: 91-98.
- Pilgrim, W. and Hughes, R., Environ. Monit. Assess., (1994) 32: 1-20.
- Sharma, R. K.,Agrawal, M., marshall, F. M., Environ. Monit. Assess. DOI 10.1007/ s10661-007-9924-7(2007).
- Sweet, C. W., Vermette, S. J. and Landsberg, S., Environ. Sci. Technol. (1993) 28: 1273-1285.
- Sweet, C. W., Weiss, A and Vermette, S.J., Water Air and Soil Pollution, (1998) 103: 423-439.
- Verma, P. C., Indian J. Environ. Prot., (1989) 9(10): 781-785.
- Voutsa, D., Grimanis, A. and Samara, C., Environmental Pollution, (1996) 94: 325-335.
- Wong, C. S. C., Li, X. D., Zhang, G., Qi, S. H., & Peng, X.Z., Atmospheric Environment, (2003) 37: 767-776.


