Evaluation of water quality of river Tawi with reference to physico-chemical parameters of district Jammu (J&K), India
Roopma Gandotra1 * , J.P. Sharma2 , Hina 1 and Payal Andotra1
1
IIIM,
Canal road,
Jammu,
India
http://dx.doi.org/10.12944/CWE.3.1.08
The physico-chemical parameters (pH, temperature, Free CO2, DO, CO3-, HCO3-, Ca++, Mg++ and Cl-) were carried out for one year (April 2006 to March 2007) to evaluate the water quality of river Tawi (J&K). Four sampling stations (I to IV) were selected within the city limits of Jammu. Physico-chemical parameters were within the permissible limits but showed a regular trend of increase with increase of sewage contamination, as we move from Station I to IV. Contamination of river water suggests certain control measures to protect the riverine ecosystem for health, hygiene and sustainable environment.
Copy the following to cite this article:
Gandotra R, Sharma J.P, Hina, Andotra P. Evaluation of water quality of river Tawi with reference to Physico-chemical parameters of district Jammu (J&K), India. Curr World Environ 2008;3(1):55-66 DOI:http://dx.doi.org/10.12944/CWE.3.1.08
Copy the following to cite this URL:
Gandotra R, Sharma J.P, Hina, Andotra P. Evaluation of water quality of river Tawi with reference to Physico-chemical parameters of district Jammu (J&K), India. Curr World Environ 2008;3(1):55-66. Available from: http://www.cwejournal.org/?p=742
Download article (pdf)
Citation Manager
Publish History
Introduction
Water, as ubiquitous on earth as is imperative for life, seems to be loosing its ages old natural purity. Even though water is abundant, the amount of potable fresh water available is a tiny fraction of the total amount of water in the world. Rivers are the most important water resource. Unfortunately, the worldwide rivers are being polluted by indiscriminate disposable of sewage, industrial waste and plethora of human activities, which affects its physico-chemical characteristics and microbiological quality, making it unsafe for consumption.
Prevention of river pollution requires monitoring of physico-chemical parameters. So, physico-chemical parameters were taken for analysis of water quality of river Tawi. Earlier works on physico-chemical parameters of rivers from Indian waters were those of Aggarwal et al. (1976), Joshi & Pathak (1991), Pandey et al. (1992), Joshi & Bisht (1993), Chopra & Patrick (1994), Prasanakumari et al. (2003), Kumar et al. (2004) and Sanap et al. (2006).
Methodology
Study Area
The state of J&K, situated in the extreme north India and lying at 36°58' N - 32°17' N and 80°20' E- 76°20' E, is an extensive hilly area interspersed with a host of lentic and lotic waters. Main drainage of Jammu province is effected by river Chenab. Tawi river is a major left bank tributary of river Chenab draining Jammu from Dudu in north up to Ghomanasan in south. Tawi river catchment is delineated by latitude 32° 35' N- 33° 5' and longitude 74° 35' E- 75 °45' E.
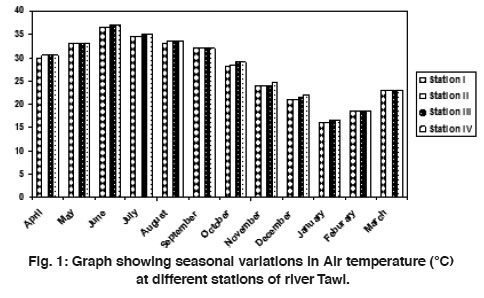 |
Figure 1: Graph showing seasonal variations in Air temperature (°C) at different stations of river Tawi. Click here to view figure |
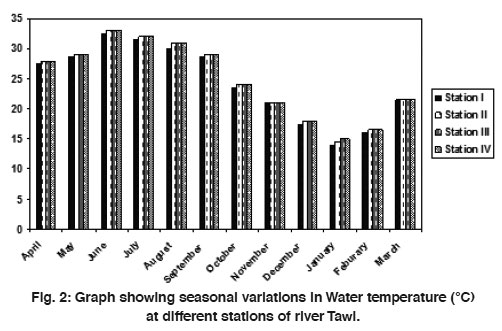 |
Figure 2: Graph showing seasonal variations in Water temperature (°C) at different stations of river Tawi. Click here to view figure |
Sewage and other effluents are introduced in Tawi along its whole course, mainly at Jammu city. River Tawi is the main source of drinking water supplies for Jammu city and its outskirts. As river is being polluted day by day, it is therefore necessary to know the degree of pollution load so as to assess its potability.
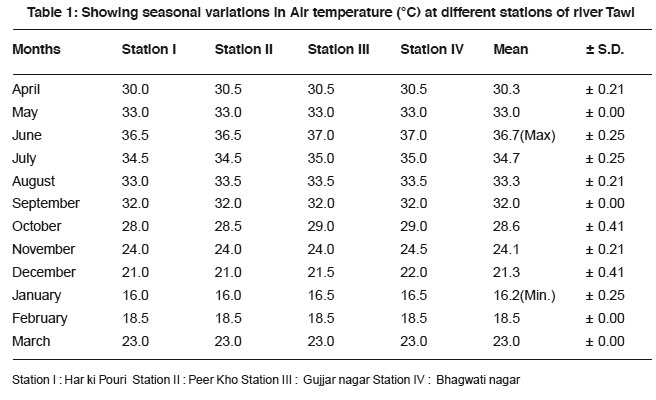 |
Table 1: Showing seasonal variations in Air temperature (°C) at different stations of river Tawi Click here to view table |
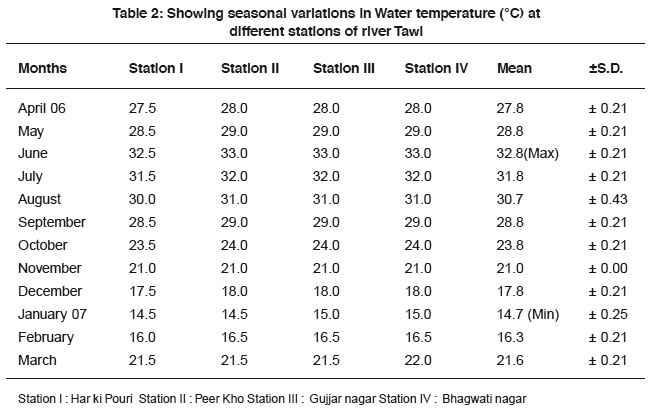 |
Table 2: Showing seasonal variations in Water temperature (°C) at different stations of river Tawi Click here to view table |
Sampling Sites
During the study period, four sampling stations were selected along the river Tawi (within the city limits of Jammu) viz., Station I (Har ki Pouri), Station II (Peer Kho), Station III (Gujjar Nagar) and Station IV (Bhagwati Nagar).
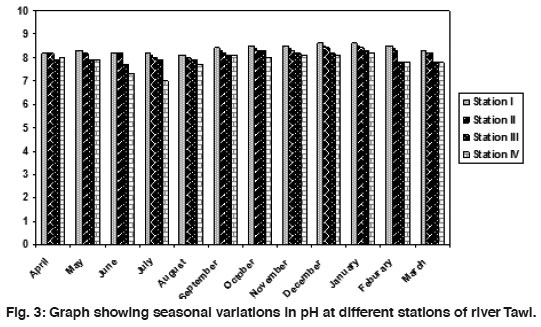 |
Figure 3: Graph showing seasonal variations in pH at different stations of river Tawi. Click here to view figure |
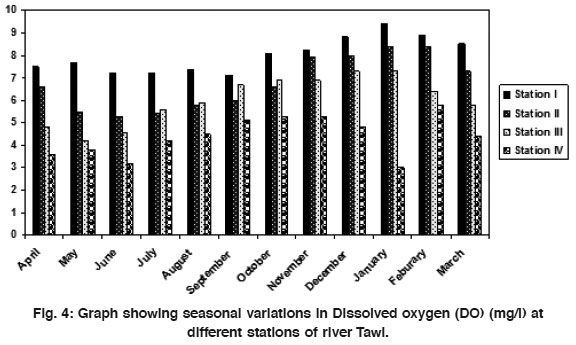 |
Figure 4: Graph showing seasonal variations in Dissolved oxygen (DO) (mg/l) at different stations of river Tawi. Click here to view figure |
Sample Collection
Sampling was according to the procedure recommended by American Public Health Association (APHA, 1998). Samples were collected monthly during the year (April 06-March 2007).
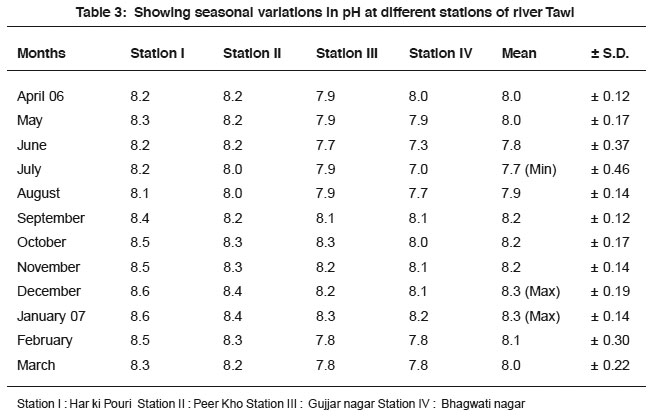 |
Table 3: Showing seasonal variations in pH at different stations of river Tawi Click here to view table |
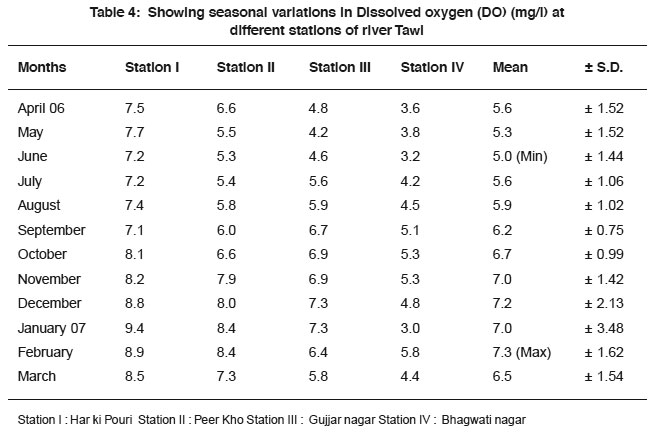 |
Table 4: Showing seasonal variations in Dissolved oxygen (DO) (mg/l) at different stations of river Tawi Click here to view table |
Physico-Chemical Analysis
The physical parameters determined were atmospheric temperature and water temperature. The chemical analysis performed includes pH, Free CO2, DO, CO3—, HCO3-, Ca++, Mg++ and Cl- (ISI, 1973 and APHA, 1998).
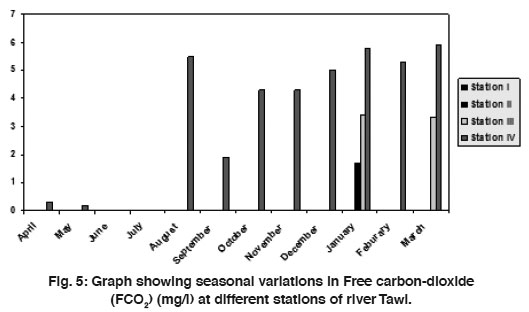 |
Figure 5: Graph showing seasonal variations in Free carbon-dioxide (FCO2) (mg/l) at different stations of river Tawi. Click here to view figure |
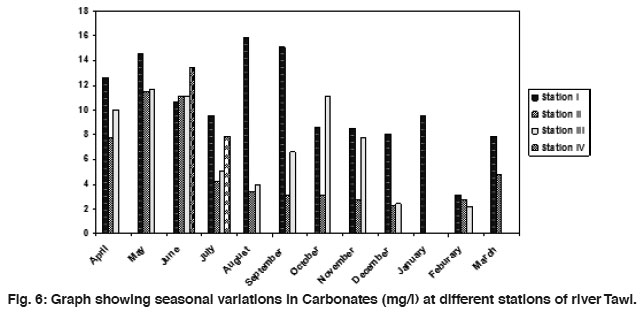 |
Figure 6: Graph showing seasonal variations in Carbonates (mg/l) at different stations of river Tawi. Click here to view figure |
Results and Discussion
The seasonal distribution of air and water temperature is depicted in fig. 1 and 2 respectively. The mean value of air temperature at all the four (I-IV) sampling stations fluctuated between 16.2°C (Jan.) to 36.7°C (June) and that of water temperature varied from 14.7°C (Jan.) to 32.8°C in (June). Both showed highest recordings during summers and lowest during winters. A positive relation between air and water temperature was observed. Similar observations were also advocated by Dutta (1978) and Zutshi (1992).
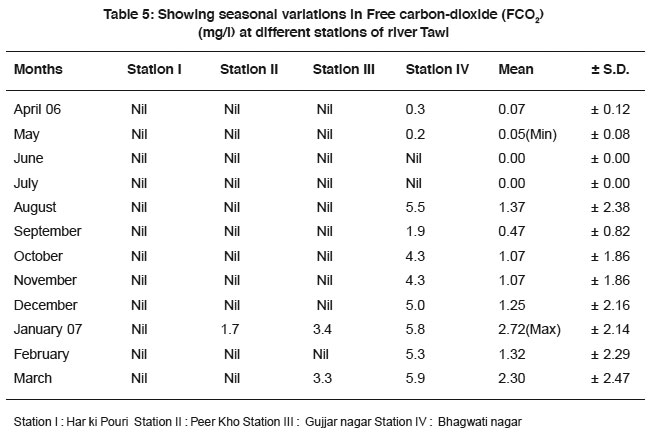 |
Table 5: Showing seasonal variations in Free carbon-dioxide (FCO2) (mg/l) at different stations of river Tawi Click here to view table |
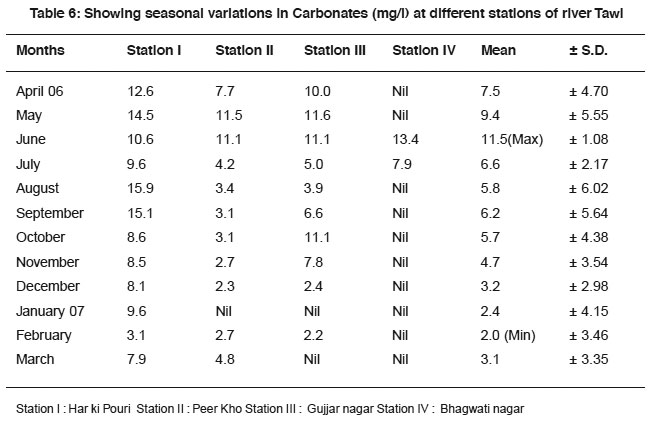 |
Table 6: Showing seasonal variations in Carbonates (mg/l) at different stations of river Tawi Click here to view table |
The distribution of pH is presented in fig. 3. The annual average of pH varied from 7.7 to 8.3. pH showed less variation and remained alkaline throughout the year. Seasonal studies of pH clearly indicate that it was in low regime during summer and rainy season and in high regime during winter season. Similar findings were also reported by Bhanja & Patra (2000) and Prasannakumari et al. (2003). Stationwise picture of pH shows a decreasing trend as we move from Station I (no marked sewage entry) to Station IV (sewage polluted station). Low record of pH at the pollutant mixing stations has also been reported by Saxena et al. (1966), Zutshi (1992) and Chopra & Patrick (1994).
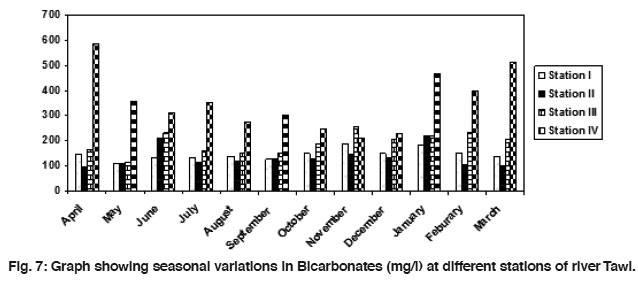 |
Figure 7: Graph showing seasonal variations in Bicarbonates (mg/l) at different stations of river Tawi. Click here to view figure |
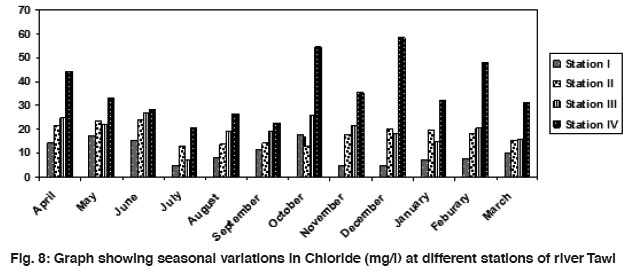 |
Figure 8: Graph showing seasonal variations in Chloride (mg/l) at different stations of river Tawi Click here to view figure |
Seasonal data on the dissolved oxygen (DO) is depicted in fig. 4. Annual average recorded a minimum of 5.0 mg/l (June) and maximum of 7.3 mg/l (Feb.) at the selected sampling stations. In the present study, DO showed highest records during winters and lowest value during summers. Higher values of DO can be attributed to low temperature which permits higher retention of air, thereby causing rise in oxygen level during winter months and rise in temperature lowers the oxygen retention capacity of water, resulting in low values of DO during summer. The results are in agreement with Joshi et al. (1993), Kataria et al. (1995), Parashar et al. (2003) and Thilaga et al. (2004).Data revealed low DO level at sewage mixing stations (Station III & IV) as compared to less polluted stations (Station I& II). Similar observations were also suggested by Khanna et al. (1997).
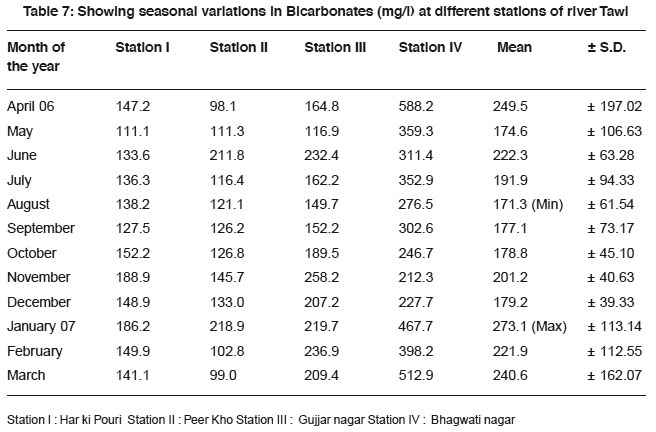 |
Table 7: Showing seasonal variations in Bicarbonates (mg/l) at different stations of river Tawi Click here to view table |
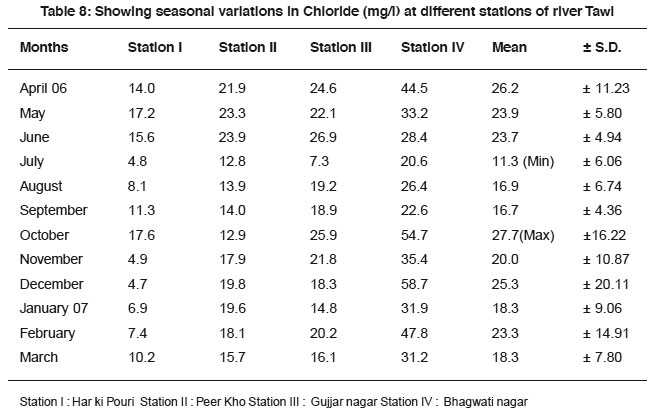 |
Table 8: Showing seasonal variations in Chloride (mg/l) at different stations of river Tawi Click here to view table |
The annual data of FCO2 is presented in fig. 5. The annual averages ranged between 0.05 mg/l (May) to 2.72 mg/l (Jan.) in the study stations. An inverse relationship between DO and FCO2 was recorded. FCO2 exhibit an increasing trend from Station I to Station IV, which may be due to addition of faecal matter and domestic sewage. Present observation gets support from the findings of Welch (1952) and Dutta (1978).
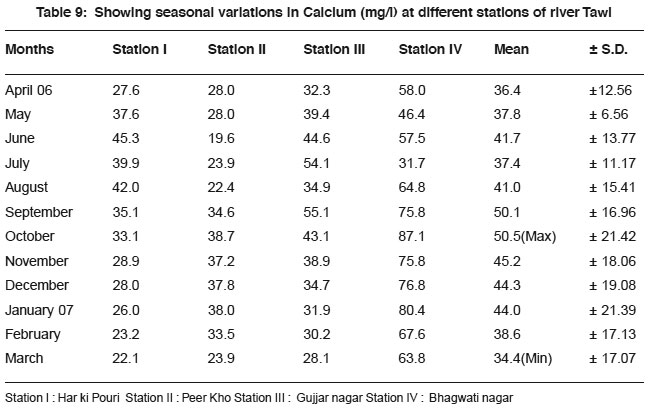 |
Table 9: Showing seasonal variations in Calcium (mg/l) at different stations of river Tawi Click here to view table |
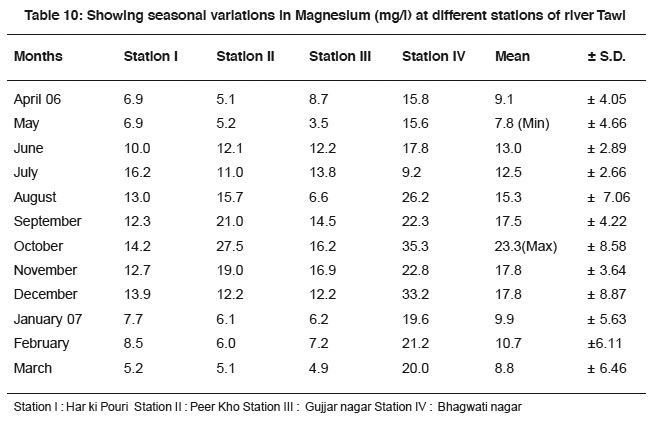 |
Table 10: Showing seasonal variations in Magnesium (mg/l) at different stations of river Tawi Click here to view table |
In the presently selected stations (I-IV), the mean value of carbonate varied from 2.0 mg/l (Feb.) to 11.5 mg/l (June) - Fig. 6 and bicarbonate showed a mean fluctuation between 171.3 mg/l (Aug.) to 273.1 mg/l (Jan.) – Fig. 7. An inverse relation was noticed between FCO2 and carbonates at Station IV. The high values of carbonates and bicarbonates recorded at Station IV may be due to addition of more sewage at this particular site. The results are in accordance with the findings of Singh and Rai (2003) who also suggested high conc. of sewage as the cause of high alkalinity.
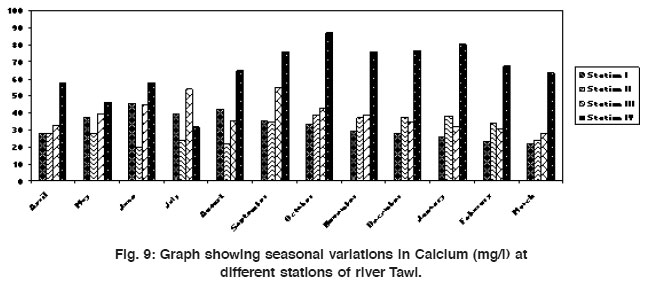 |
Figure 9: Graph showing seasonal variations in Calcium (mg/l) at different stations of river Tawi. Click here to view figure |
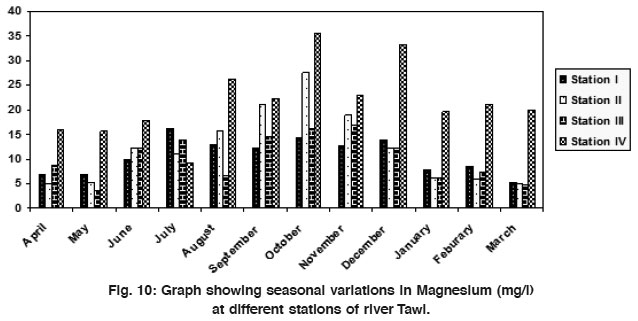 |
Figure 10: Graph showing seasonal variations in Magnesium (mg/l) at different stations of river Tawi. Click here to view figure |
Chloride is one of the most important indicators of pollution. Chlorides are present in sewage, sewage effluents and farm drainage. It showed a mean fluctuation between 11.3 mg/l (July) and 27.7 mg/l (Oct.) – Fig. 8. Monsoon fall in chloride concentration is due to dilution effect caused by direct rainfall and inundation of water from catchment area, which corroborate with the earlier observations of Kumar (1990) and Sharma (2004). Rise in chloride was noticed at Station III & IV, which can be attributed to increased pollution level due to addition of sewage at these stations. Similar observations have also put forth by Zutshi (1992) and Chopra & Rehman (1995).
Mean annual variation of calcium content in the selected study area (I-IV) varied from 34.4 mg/l (Mar.) to 50.5 mg/l (Oct.) - Fig. 9 and mean value of magnesium varied from 7.8 mg/l (May) to 23.3 mg/l (Oct.) - Fig. 10. Stationwise, both cations showed their highest recording at Station III & IV which could be attributed to entry of sewage from adjoining areas and also due to pollution of other sorts (Bhanja and Patra, 2000).
Conclusion
In the present investigation on river Tawi (J&K), all physico-chemical parameters were within permissible limits but show a regular trend of increase as we move from Station I to IV. Raised values of certain parameters like alkalinity, chlorides and low values of pH & DO at some stations indicate pollution at river water. To protect this water ecosystem, there should be proper management and planning of deposition of municipal sewage and domestic wastage for health hygiene and sustainable environment.
References
- Agarwal, D.K., Gaur, S.D., Tiwari, I.C., Narayan Sawmi, N. and Magwah, S.M., Physico-chemical characteristics of Ganges water at Varanasi. Ind. J. Env. Hlth., (1976) 18: 201-206.
- APHA, American Public Health Association Standard Methods for the Examination of Water and Wastewater, 19th ed., Washington, DC (1998).
- Bhanja, K.M. and Patra, A., Studies on the water quality index of River Sanamachha-kandana at Keonjhar garh, Orissa (India). Poll. Res., (2000) 19(3): 377-385.
- Chopra, A.K. and Patrick, N.J., Effect of domestic sewage on self- purification of Ganga water at Rishikesh, I. Physico-chemical parameters. Ad. Bios., (1994) 13(2): 75-82.
- Chopra, A.K. and Rehman, A., A study on self-purification of physico-chemical properties of Ganga canal water at Jawalpur, Haridwar. Him. J. Env. Zool., (1995) 9: 11-13.
- Dutta, S.P.S., Limnology of Gadigarh Stream (Miransahib) with special reference to consumers inhabiting the stream. Ph.D. Thesis, University of Jammu (J&K) (1978).
- ISI, Indian Standard Methods for Sampling and Test (Physical and Chemical) for water used in Industry. Indian Standard Institute, Manak Bhawan, 9, New Delhi (1973).
- Joshi, B.D. and Bisht, R.C.S., Some aspects of physico-chemical characteristics of western Ganga canal near Jwalapur at Haridwar. Him. J. Env. Zool., (1993) 7: 76-82.
- Joshi, B.D. and Pathak, J.K., A relative study of some physico-chemical parameters of sewage water at Uttarkashi. Him. J. Env. Zool., (1991) 5: 56.
- Joshi, B.D., Pathak, J.K., Singh, Y.N., Bisht, R.C.S. and Joshi, P.C., On the physico-chemical characteristics of river Bhagirathi: In the uplands of Ganhwal Himalaya. Him. J. Env. Zool., (1993) 7: 64-75.
- Kataria, H.C., Jain, O.P., Gupta, S.S., Srivastava, R.M. and Shandilya, A.K., Physico-chemical analysis of water of Kubza river of Hoshangabad. Oriental J. Chem., (1995) 11(2): 157-159.
- Khanna, D.R., Malik, D.S. and Vasish, R., Bio-monitoring of sewage water of a treatment plant at Haridwar(India). J. Natcon., (1997) 9(2): 197-202.
- Kumar, A., Saxena, K.K. and Chauhan, S., Study of physico-chemical characteristics of the river Jamuna in district Auraiya (U.P.). Him. J. Env. Zool. (2004) 18(1): 85-88.
- Pandey, B.N., Lal, R.N., Mishra, P. K. and Jha, A.K., Seasonal Rhythm in the physico-chemical properties of Mahananda River, Katihar, Bihar. Env. and Ecol., (1992) 10(2): 354- 357.
- Parashar, N.B., Kaushik, P. and Pandey, S., Physico-chemical and Microbiological Studies of Ganga Canal at Haridwar during Kumbh period-1998. Him. J. Env. Zool. (2003) 17(2): 167-171.
- Prasannakumari, A.A., Ganga Devi, T. and Sukeskumar, C.P., Surface water quality of River Neyyar- Thiruvananthapuram, Kerala (India). Poll. Res., (2003)22(4): 515-525.
- Sanap, R.R., Mohite, A.K., Pingle, S.D. and Gunale, V.R., Evaluation of water qualities of Godavari river with reference to physico-chemical parameters, Dist. Nasik (M.S.), India. Poll. Res., (2006) 25(4): 775-778.
- Saxena, K.L., Chakraborty, R.N., Khan, A.Q. and Chattopadhya, S.N., Pollution studies of the river Ganges near Kanpur. Indian. J. Env. Hlth., (1966) 8: 270-285.
- Singh, S.K. and Rai, J.P.N., Pollution studies on river Ganga in Allahabad district. Poll. Res., (2003) 22(4): 469-472.
- Thilaga, A., Subhashini, S., Logan Kumar, K. and Shobana, S., Studies of the variation in the physico-chemical parameters of a lake at Ooty (The Nilgiris). Him. J. Env. Zool., (2004) 18(1): 81-84.
- Welch, P.C., Limnology, McGraw Hill Book Co. Inc. New York: 539 (1952).
- Zutshi, N., Effect of Jammu City Sewage water on abiotic and biotic factors of the river Tawi, Jammu. Ph.D. Thesis, University of Jammu, Jammu (1992).


