Studies on water quality of Kaliyasot Dam, Madhya Pradesh, India
Yogesh Singh1 and H. C. Kataria1 *
1
Department of Chemistry,
Government Geetanjali Girls P.G. Collage,
Bhopal,
462 038
India
http://dx.doi.org/10.12944/CWE.3.1.22
It is important to make assessment of water resources their magnitude, distribution and scope of utilization. It is also important to have an idea of the present and future demands of water for various uses e.g. industrial, irrigational and domestic purposes in public health point of view. In the present study it has attempted to assess water quality of ‘Kaliasot dam’ for a period of one year 2007-08 in monsoon, winter and summer seasons. The samples were collected from different points to cover complete dam area. The parameters observed are temperature, pH, Electrical conductance, turbidity, Total solids, TDS, SS, Nitrates, Phosphate, chloride, Alkalinity, Total hardness, Ca-H, Mg-H, D.O., BOD, COD, Na, K, Sulphate & Fluoride, all physico-chemical parameters
Copy the following to cite this article:
Singh Y, Kataria H.C. Studies on water quality of Kaliyasot Dam, Madhya Pradesh, India. Curr World Environ 2008;3(1):147-152 DOI:http://dx.doi.org/10.12944/CWE.3.1.22
Copy the following to cite this URL:
Singh Y, Kataria H.C. Studies on water quality of Kaliyasot Dam, Madhya Pradesh, India. Curr World Environ 2008;3(1):147-152. Available from: http://www.cwejournal.org/?p=789
Download article (pdf)
Citation Manager
Publish History
Introduction
Water resources are essential for existence and development of the global community. The Mineral components present in water are directly related to agricultural utilisation and its parameters value decides the suitability of water for agriculture purpose.
To control the water quality for health &hygienic point of view the present study of Kaliyasot dam water has been done during 2006-07 The Kaliasot dam based on Kaliasot River that is a tributary of River Betwa. Kaliasot dam is situated at Bhopal, co-ordinates it Latitude 23°12"3' N and longitude 77° 24"29’ E. The dam is near Chuna Bhatti village, constructed for irrigation purpose, it irrigates about 10425 h areas annually of Bhopal and Raisen District of M.P. The Kaliasot dam is an earthen homogeneous dam and its height 34.25 m, length 1080 m, top width 6.30 m, FRL (full Reservoir Level) is 505.67m, and MWL (Maximum Water Level) is 505.67m. The dam has gross storage capacity of 35.387 m cum; live storage 34.41 m cum, discharging capacity is 1355 cumeces with 13 radial gates of size 6.40 × 4.57 m.
The study has utmost importance and will help to further plan for irrigation water supply schemes for sustainable development.
Kaliasot reservoir is under environmental stress due to siltation, human encroachment, high macrophytic population and sewage input from various resources. Higher value of pH, chloride, alkalinity, hardness, nitrate, phosphate and sulphate indicates eutrophication but water quality of reservoir is suitable for fish culture. The biological productivity of reservoir is greatly influenced by their hydro biological features. The soil inflow from the catchments area and basin affects the water quality of a reservoir.
Description of Sampling Stations
North-east of dam near guest house Near pump house
Near office of Jalbhumi Saranksham Sansthan
Near Shiv Temple
Near exit gate of dam
Near Sanskar Valley School
Near Gol Ghar, Mendora Villege
Near law college &Research centre
Material and Methods
Eight sampling station were chosen at different points of the Kaliasot dam. The object of sampling is to collect small quantity of water from the body of water source for the purpose of water analysis and to analyse the physico–chemical constituents existing in water. The methods for water analysis were applied as prescribed by APHA (1985) and NEERI (1986).
Results and Discussion
The results are summarised in table-1
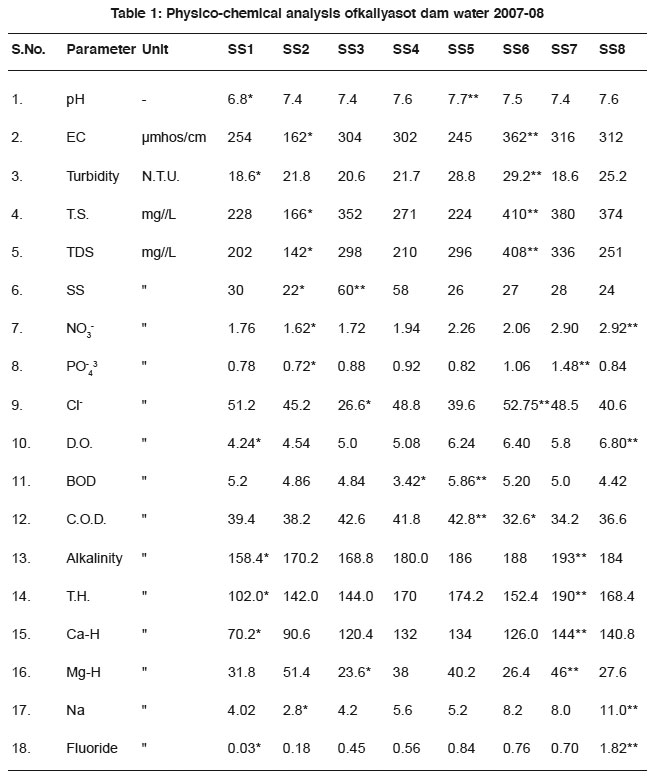 |
Table 1: Physico-chemical analysis of kaliyasot dam water 2007-08 Click here to view table |
pH
Acidic natures of water reduce the appetite of fish and reduce the growth of fish. In this study, pH ranged from 6.8 -7.7, lower values recorded at SS1 and higher values of 7.7 at SS5. Higher pH favours the fish production in reservoir. The EPA criteria for pH are 6.5-9.0 for fish water aquatic life.The findings of the study are similar with those are kataria (1994, 2006), Raina et al (1984).
Specific Conductivity
Electrical conductivity in water is due to ionisation of dissolved solids and becomes a measure of total dissolved solids. Electrical conductivity is used as a basic index to select the suitability of water for agricultural purposes. Upadhyay and Ray (1982) reported EC 150 -256. Kataria (1994), Jain et al., (1996) noted EC range of 151-227 µmhos/cm in Hathainkheda dam water and 320-1860 µmhos /cm in Betwa River and 319-4116 µmhos /cm in Kaliasot River. In the present study, minimum value was recorded 162 at SS2 while higher value of 362 was found at SS6, E.C. of a sample. On the other hand, water is related to the natural and concentration of ionized substances present in the sample. Higher the concentration of acid, base and salts in water, a higher will be the EC. No permissible limit has been set up for EC in drinking water in its absence, the need of autotrophs are fulfilled by bicarbonates.
Turbidity
Turbidity is caused due to the presence of suspended matters, clay silt, colloidal organic particles plankton and other microscopic organism. It is an expression of certain light scattering and light absorbing properties of water. It has significant effect and microbiological quality of drinking water and irrigation water. It may create Jaundice and polio in man. WHO recommended 5.0 NTU and Indian standards up to 10 NTU for drinking water (ISI 1983). High turbidity of River water was reported 85 NTU after confluence of industrial wastes by Trivedi (1979), Kataria (1994) noted 12.8 -180 NTU turbidity in Betwa River. In the present study turbidity has noted minimum 18.60 at S.S1 and maximum of 29.9 at SS6. The standard is a suspension of silica of specified particle size selected such that a 1.0 mg/L suspension is one unit of turbidity. In general maximum values of turbidity were recorded during rainy season. The surface run off along with silt and organic debris resulted in increasing the turbidity value during monsoon period.
Total Solids
Contain different type of nutrients and it determines the suitability of drinking water. Increasing value of TDS (Total dissolved solids) indicates pollution by extraneous resource (Aboo and Shastry 1968). In the present study, Total solids, Total dissolved solids and dissolved solids are found minimum 166, 142, 122 mg/L at SS2 while maximum value of 408, 380, 60 mg/L noted at SS7 and 60 mg/L at SS3 given in table-1. Total solids were found raining from 166 to 410 mg/L minimum values were recorded at SS2 due to various streams forming in the river bring about considerable amount of TS into rivers and then into dam. (Jain et al.1996). This is in conformity with the studies conducted by Kulshreshtha and Adholia (1989). Suspended solids (SS) interfere with the transition of light and a settle out of suspension covering a streamed or dam bottom. Excess SS, adversely affects fish by reducing. Their growth rate and resistance to disease, preventing the successful development of fish and larvae, and reducing the amount of food available Dissolved solids are calculated from total and suspended solid analysis. Dora et al. (1987) in Subernarekha River noted 84 -1725 mg/L TDS, Kataria (1996) noted TS, TDS and SS ranged from 216 -378, 132 -198, 28 -246 mg/L respectively in Tawa reservoir of Hoshangabad district. Jain et al. (1996) noted D.S. and S.S. ranged from 110 - 380, 16 - 46 mg/L in Kerwan dam water.
Nitrate
Nitrate Concentration in reservoir water depends upon geochemical condition such as the extent to which nitrogenous fertilizers are used in agriculture. Kataria (995) noted nitrate range of 1.8 -3.0 ppm in drinking water of piparia, Kataria (996) noted 0.2 - 0.8 ppm nitrate in Kolar reservoir (MP). In the presents study nitrate ranged from 1.62mg/L at SS2 to 2.92mg/L at SS8. Kataria (1994) noted nitrate range of 1.18 to 5.0 mg/L in confluence of industrial wasters of Betawa River. Kataria (1996) noted range from 0.030-1.48 ppm of Nitrate in Tawa reservoir. Kataria (2006) reported nitrate 0.08 -0.48 ppm range in drinking water of piparia.
Phosphate
Phosphate is readily taken by phytoplankton. It varied from 0.006-1.20 mg/L in Kolar reservoir. Phosphate is very essential plant nutrient. Higher value of phosphate in reservoir water is due to agriculture wastes and use of fertilizers. Phosphate may enter to surface water from man- generated wastes and land run off. Domestic wastes contains approximately (1.6Kg) of phosphorous / capita/ year of which 64% is from p- builders used in synthetic detergents. In this study phosphate was noted ranged from 0.72 mg/L minimum at SS2 and 1.48 mg/L maximum at SS7. The findings are similar with Kataria (1996) noted phosphate ranged 0.064 -1.04 ppm in Tawa reservoir.
Chloride
Chloride label of water pollution indicates the pollutional degradation of water pollution. It is found in the form of Na, K and Ca salts. Higher concentration of chloride is hazardous to human consumption creates health problems. Desirable recommended limit for chloride is 250 mg/L by ISI (1983). In the present study it varied from 26.6 mg/ L at SS3 to 52.75 at SS6. The findings are similar with those of Katariya (1995) and Mitra (1982). Kataria (2001) noted chloride range of 50.4 -120.4 mg/L in drinking water of Pipariya (M.P.) and 17 -54 mg/L in reservoir dam water and Dwivedi & Sonar (2004) noted chloride range 20.4 – 56.8 mg/L in water reservoir of Arunachal Pradesh.
Dissolved Oxygen
important parameter in water quality assessment. It reflects the physical and biological processes prevailing in the water. Depletion of DO in water due to high temperature to increased microbial activity. Oxygen is soluble in good water (Kudeshia,) V.P. (1995) 7 mg/L at 30°C. The DO of Kaliasot dam was observed in the range of 4.24 mg/L minimum at SS1 to 6.8 mg/L maximum at SS8. Lower than the permissible limit of DO, water becomes unfit for the aquatic animal. The findings are similar to Vaishnav and Sahu (2006).
Biochemical Oxygen Demand
Biochemical oxygen demand acceptable limit of B.O.D. is 6.0 -100 mg/L In the presents study BOD levels of Kaliasot dam water were found in the range 3.42-5.86. The values of BOD were much above the permissible limit indicating presence of decomposable organic matter in the reservoir. BOD depicts the pollution of water source due to pollutants organic origin. In summer season the volume of dam water decreases with the increases of concentration of organic matter.
Chemical Oxygen Demand
COD increases due to pollution of input 30 nos. In the present study ranged from 32.6 - 42.8 mg/L. COD depicts the pollution of water source due to pollutants organic origin. In summer season the volume of dam water decreases with the increases of concentration of organic matter. The limit of COD generally specify by various authorities in 250 ppm.
Total Alkalinity
Total alkalinity due to salt of weak acid and bicarbonate to highly alkaline water is unpotable. Alkalinity in this study ranged from158.4 -193 mg/L.
Hardness
Hardness mainly causes from cations of Ca++, Mg++, Sr++, and Fe++. Total hardness recorded in Jhelam River was from 80.6 -20.36 mg/L by raina et al., (1984). In the present study total hardness, Ca-H and Mg-H ranged from 102-190, 70.2 -144 and 23.6 – 46.0 mg/L respectively
Sodium (Na)
Sodium plays a vital role in water analysis. Dissolved oxygen is one of the most It ranges from 2.8-11.00 mg/L at different sampling stations, minimum at SS2 and maximum value at SS8.
Fluoride (F)
Fluoride is important content of water to teeth and other pathological changes and has assumed considerable importance in public water supply. The value of 0.8 to1.0 mg/L of F- has been recommended by WHO (1970). Fluoride in the study area may develop by natural occurrence of higher levels of fluoride. Control measures are suggested in this study. In the present study fluoride has ranged from 0.03-1.82 mg/L minimum value at SS1 and maximum value are observed at SS8 is beyond the permissible limits. Kataria et al.,(2006).
Conclusion
The result of different physico-chemical parameter shows that Kaliasot reservoir water is affected by various human activities domestic wastes effluents the present study is an humble approach to study a piece of man mad reservoir to present a living picture to fresh water body. Values of some parameter are beyond the permissible limits while some others are well within the limit. The result of most of the parameters has concluded that the water of kaliasot dam is less polluted and is suitable for irrigational purposes.
References
-
Aboo. K.M. Shastry, C.A. and Alex, P.G. A study of well water on Bhopal city. J. Environ Hlth. (1968) 189-203.
-
Adholia, U.N., Studies on Hydrology of Rivers Betwa and its Fishery Resources. Ph.D. Theses, Vikram University, Ujjain (1981).
-
APHA. Standard Method for the Examination of water and Waste Water (16th Ect.) APHA, AWWA, WPCF, New York (1985).
-
Dora, MM and N.N. Ray. Investigation of water quality of Subernarekha River for irrigation. India. J. Environ Hlth. (1987) 29(4): 292-298.
-
ISI. Specification for Drinking water to 10500 ISI 1983. Indian Standard Institutes of New Delhi (1983).
-
Jain, Praveen, Khatwari, Geeta Pillai, S.A. Water quality of Hathaikheda dam. Irrigation. Orient J. Chem. (1996) 12(2): 213-214.
-
Kataria, H.C., A bio-Chemical analysis of drinking water of Raisen district (M.P.). Asian J.Chem. Revs. (1994) 5(1-2): 66-68.
-
Mitra, A.K. Chemical characteristics of Surface water of selected gayging station on the River Godavari, Krishna and Tungabhadra. Ind. J. Environ. Hlth (1982) 24(9):165-179.
-
Padmanabh Dwivedi and Santosi sonar Evaluation of physico-Chemical and Biological parameters in water Reservoir around Hills, Doimukh (Dist. Papum pare) Arunachal Pradesh, Poll. Res., (2004) 23 (I): 101-104.
-
NEERI, Manual on Water and Waste Water Analysis. National Environmental Engineering Resources Institute, Nagpur (1986) 340.
-
Rama, V.A.R. Shah and R.A. Shakti., Pollution studies on River Jhelum. I.J.E. Health (1984) 26(3): 187-201.
-
Saraf R.V. and S.C. Shenoy., Assessment of Wardha River water quality upstream and downstream, Ballapur Industries Ltd. IAWPC, Tech. Annual (1986) 13: 129-135.
-
Trivedi, R.C. Pollution study of Chambal River and Surrounding due to Nagda Industrial Area Ph.D. Thesis, Vikram. Univ. Ujjain Upadhyay, N.P. and N.N. Ray (1982) Studies on river pollution Kathmandu Valley. Indian J. Environ Hlth, (1979) 24(2): 124-135.
-
Kudesia V.P. Water pollution, Pragati Prakashan, Meerut, (1995).
-
M.M.Vaishnav and Dineshwari Sahu, Study of some, physicochemical characteristics of Hasdeo river water at Korba (India) JERAD, Vol 1 No 2 pp 140-142, Oct-Dec (2006).
-
WHO, Fluoride and Human health, Manogr. Serious No. 05, WHO Geneerva (1970).
-
Kataria, H.C. et al., Studies of water quality of Dahod dam, India, Poll Res., (2006) 25(3): 553-556.


