Study of physicochemical quality of pond water in Bilaspur, Chhattisgarh
S.K. Shrivastava2 * , V.K. gupta3 , Kiran Vajpai4 , D.K. Shrivastava1 and Sharad K. Vajpai1
1
Chemistry Department,
C.M.Dubey Postgraduate College,
Bilaspur,
495 001
India
2
Regional Office, C.G. Environment Conservation Board,
Near Shiv Temple, Avanti Vihar Colony,
Rajpur,
Chhattisgarh
India
3
Zoology Department,
C.M.Dubey Postgraduate College,
Bilaspur,
495 001
India
4
Chemistry Department,
Government Girls Postgraduate College,
Bilaspur,
495 001
India
http://dx.doi.org/10.12944/CWE.3.1.13
Physico-chemical quality of water samples form four major ponds, i.e. pond near Depotpara, Vinobanagar (S1); pond near Old Power House, Torwa (S2); pond near Family Planning center, Sarkanda (S3); and pond near Devnandannagar (S4) situated in Bilaspur city has been evaluated on monthly basis in between January - 2007 and December - 2007. Water samples collected were analysed for their physics chemical characteristics viz. Temperature, pH, Electrical Conductivity, Turbidity, Total Solids, Total Dissolved Solids, Total suspanded solids, Dissolved Oxygen, BOD, COD, Total Hardness, Calcium Hardness, Magnesium Hardness, Chloride, Fluoride, Nitrate, Sulphate and Phosphate. Data obtained from these analyses were statistically analysed to determine the correlation between various water quality parameters.
Copy the following to cite this article:
Shrivastava S.K, Gupta V.K, Vajpai K, Shrivastava D.K, Vajpai S.K. Study of physicochemical quality of pond water in Bilaspur, Chhattisgarh.Curr World Environ 2008;3(1):97-107 DOI:http://dx.doi.org/10.12944/CWE.3.1.13
Copy the following to cite this URL:
Shrivastava S.K, Gupta V.K, Vajpai K, Shrivastava D.K, Vajpai S.K. Study of physicochemical quality of pond water in Bilaspur, Chhattisgarh.Curr World Environ 2008;3(1):97-107. Available from: http://www.cwejournal.org/?p=771
Download article (pdf)
Citation Manager
Publish History
Introduction
Bilaspur is the second largest city of state of Chhattisgarh. The population of the city is around 3 lacs and is located at 25°5'N latitude and 82°25' longitude.¹ The fast pace of industrial and other developmental activities and consequent rapid urban growth have low ever, invariably brought with them unplanned and haphazard human settlements and problem of water supply, sanitation as well as environmental degradation. An understanding of water chemistry forms the basis of most of the modern day developmental activities undertaken to improve the living conditions of human beings. Water quality of surface and ground waters of many places in India have recently been reported.2-8 The present communication reports results of study of physico chemical quality of water from four major water ponds in Bilaspur viz., pond near Depotpara, Vinobanagar (S1); pond near Old Power House, Torwa (S2); pond near Family Planning center, Sarkanda (S3); and pond near Devnandannagar (S4) on monthly basis over a period of one year i.e. 2007. These ponds are situated in populated areas of the city and water from these ponds is used for various human activities except drinking. Therefore it becomes very important to assess periodically the quality of water from these water bodies to ascertain their pollution load.
Experimental
For the present study, four major water pons of Bilaspur were selected. All these four ponds receive rain water and domestic waste water from nearby settlements. These domestic waste and rain water make these ponds highly polluted. There are a few water hand pumps set in close vicinity of these ponds and water from these hand pumps is being used by people residing in those areas even for drinking purpose and they are pond to water related ailments. Therefore it was interesting to assess the extent of pollution load on these ponds. For the same, water samples were collected in the first week of every month during the study period and the parameters like pH, Electrical Conductivity, Temperature, Dissolved Oxygen were determined on the collection site itself using Elico make PE-136 Water and Soil Analysis kit. Other parameters like BOD, COD, Total Solids, Total Dissolved Solids, Total Suspended Solid, Sulphate, Nitrate, Chloride, Fluoride and Phosphate were also determined using standard methods recommended by APHA9 and NEERI.10 All the chemicals used during present investigations were of analytical grade and double distilled water from all glass was used during present study. The results obtained from these analyses were statistically treated to calculate correlation between various parameters of study.
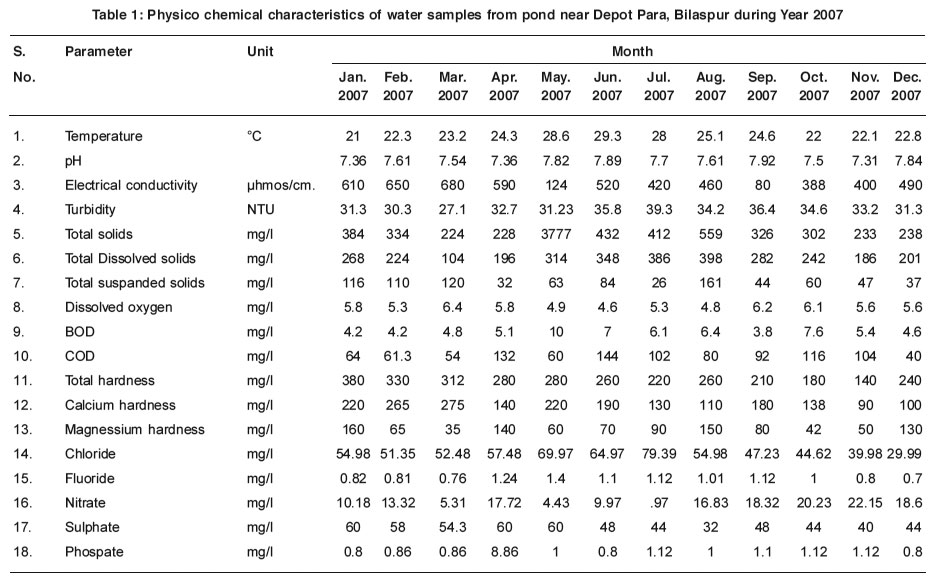 |
Table 1: Physico chemical characteristics of water samples from pond near Depot Para, Bilaspur during Year 2007 Click here to view table |
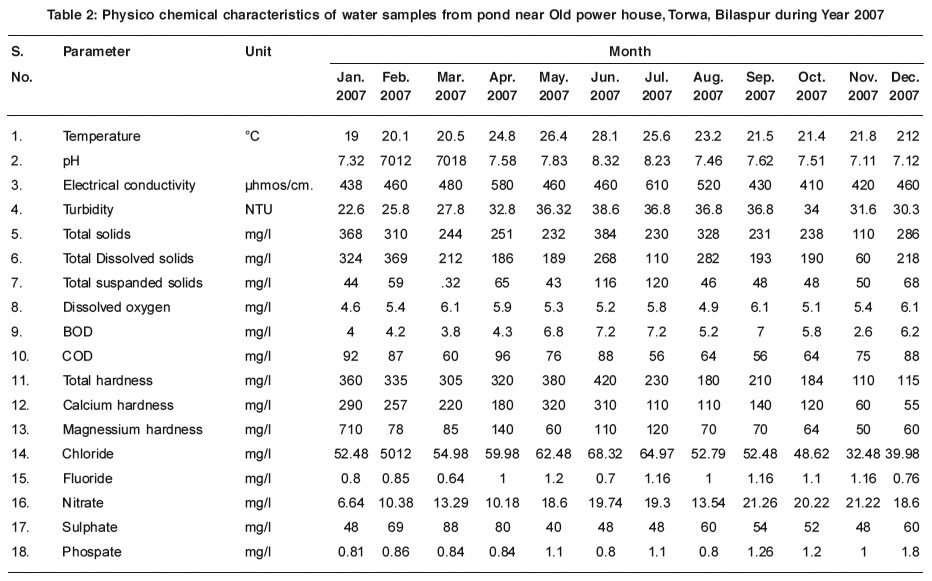 |
Table 2: Physico chemical characteristics of water samples from pond near Old power house, Torwa, Bilaspur during Year 2007 Click here to view table |
Results and Discussion
Results of analyses of water from these ponds are recorded in tables 1 to 4 and correlation between various physico chemical parameters thus calculated area given in table 5 to 8. A persual of tables 1-4 indicates that the pH of the water from all the sampling stations ranged between 8.43 (at pond near family Planning Center in the month of July 2007) and 7.02 (at pond near Devnandan Nagar in the month of January-2007). This was well within the maximum permissible limit for pH, as recommended by WHO* (6.9-9.2). Electrical conductivity of water samples, which is a measure of presence of ionic constituents, was found maximum at Devnandan Nagar pond and at Depot Para pond in the month of March-07 (680µmhos/cm). This was much above the maximum permissible limit of 500 µmhos/cm as recommended by WHO.
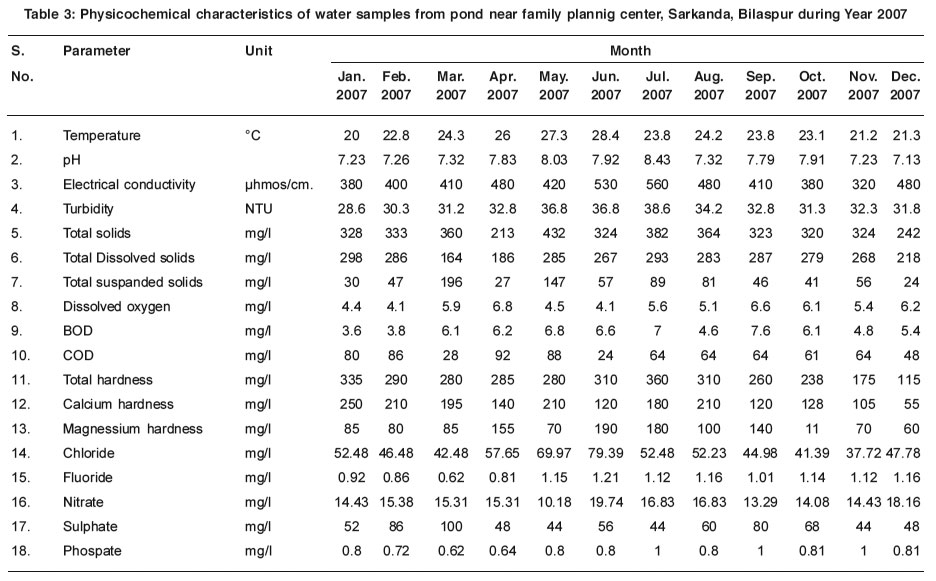 |
Table 3: Physicochemical characteristics of water samples from pond near family plannig center, Sarkanda, Bilaspur during Year 2007 Click here to view table |
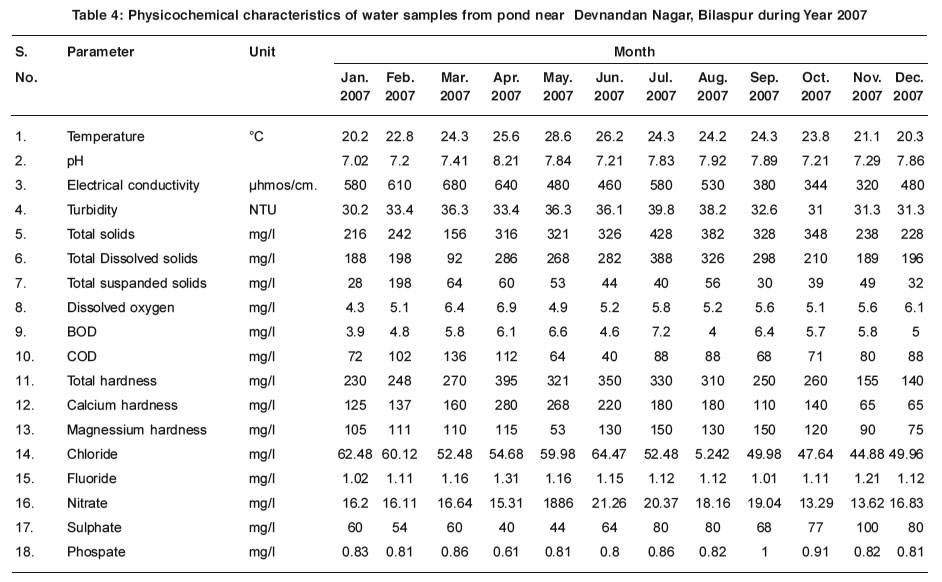 |
Table 4: Physicochemical characteristics of water samples from pond near Devnandan Nagar, Bilaspur during Year 2007 Click here to view table |
Turbidity in water samples is due to suspended solids present in them and is a primary indication of the extent of pollution As per WHO recommendation 25 NTU is the maximum permissible limit for turbidity in drinking waters. All the water samples were found to contain this exceeding the maximum permissible limit. Solids, suspended and dissolved, if present in large amounts may affect water quality as it may induce unfavorable physiological reactions in the transient consumer. WHO has 500 mg/l as maximum tolerance limit for this.¹¹ Among the collected water samples, the samples form Depot Para pond were found to contain maximum solid contents i.e.559 mg/l. Dissolved Oxygen in water samples is an important parameters as this is indicative of desirable conditions for favorable growth and reproduction of auqatic organisms. This condition requires the maintenance of dissolved oxygen levels that can support the desired auqatic life in healthy conditions. During study period maximum DO levels (6.9 mg/l) were found in the water from pond near Devnandan Nagar in the month of April-2007. BOD of water samples is essentially a bioassay method which is indicative of pollution load on the water body. USPHS (United States Public Health Service) and WHO.¹¹ Both have proposed a maximum permissible limit of 5mg/l for BOD. During the present study BOD levels in most of the samples were much more beyond the permissible limit and at many places it was as high as>7. In the month of May 2007, in the samples from pond near Depot Para, BOD was recorded as high as 10mg/l.
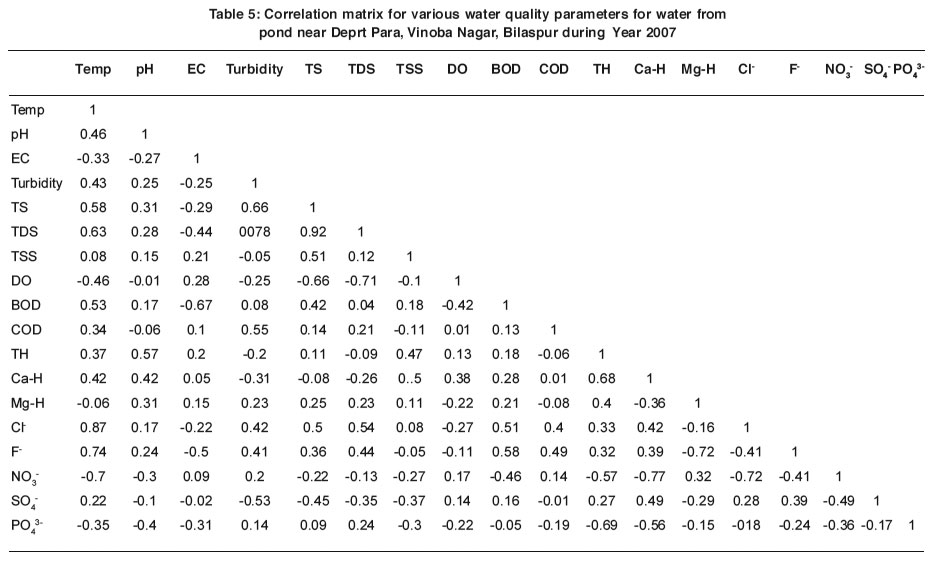 |
Table 5: Correlation matrix for various water quality parameters for water from pond near Deprt Para, Vinoba Nagar, Bilaspur during Year 2007 Click here to view table |
 |
Table 6: Correlation matrix for various water quality parameters for pond near old power houese, Torwa, Bilaspur during Year 2007 Click here to view table |
This clearly showed that these ponds are bearing appreciable high load of bio degradable organic pollutants. COD measurements give us an indication of total organic matter (both biologically oxidisable and inert) in the water. A threshold value of 4mg/l has been proposed by USPHS.¹² A persual of all the tables revealed that COD levels in all the water samples and during entire study period was much above this limit. Maximum value of 144mg/l was recorded at Depot Para pond in the month of June 2007. On the other hand minimum value of 28mg/l was found at Family Planning center pond in the month of March-2007. Fluoride in water samples is the cause of fluorosis and dental caries. Safe limit for fluoride in drinking water is as per WHO recommendations is in between 1 and 1.5mg/l.¹¹ In all the four ponds fluoride levels were below this 1.5 mg/l mark. Nitrate is a key issue in the drinking water as its level in ground water have shown alarming increase during past two/three decades due to extensive use of nitrogenous fertilizers. Due to increase in nitrate levels in water bodies, nutrient enrichment also occurs and this ultimately results in enormous growth of auqatic filamentous green algae leading to eutrophication. This huge algal growth creates unaesthetic conditions in the water body.¹³ Water from pond water Depot Para in the month of November - 2007 recorded maximum nitrate i.e. 22.15mg/l.
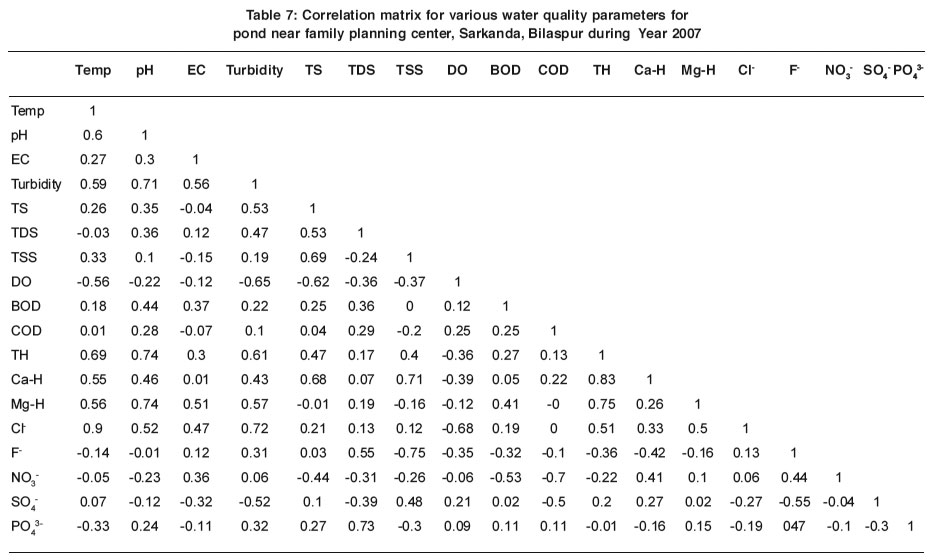 |
Table 7: Correlation matrix for various water quality parameters for pond near family planning center, Sarkanda, Bilaspur during Year 2007 Click here to view table |
 |
Table 7a: Correlation matrix for various water quality parameters for pond near family planning center, Sarkanda, Bilaspur during Year 2007 Click here to view table |
During the study period correlation analysis was conducted and perusal of tables 5-8 shows that strong positive correlations existed between turbidity -TDS, TS-TDS, Chloride-Fluoride at pond near Depot Para. On the other hand strong negative correlations were recorded at the same pond between DO-TDS, DO-TS and nitrate-chloride. Strong positive correlations were observed in the water from pond near old power house between pH-turbidity, ph-TSS, and pH-Chloride, BOD-turbidity, TS-TDS, TH-Ca-H, TH-chloride. At pond near Family Planning Center pH was found to correlation existed between nitrate and COD. Strong positive correlations were existed in the water from pond near Devnandan Nagar between EC and COD, TS and TDS, DO and COD, Ca-H and TH.
Conclusion
The present study indicated that the waters from the four major ponds situated in Bilaspur were quite heavily polluted particularly with organic pollutants and the water from these ponds is very unsafe and must be used only after suitable treatment process.
References
1. Chandrakar, P.L. and Tripahti, K., "Chhattisgarh Atlas"; 2nd Ed. Beni Gupta Publishers, Bilaspur, (2000) 58-59.
2. Sahu, B.K., Rao, R.J. and Behera, S.K., "Ecol. Environ. Conser., (1995) 1(1-4): 35-38.
3. Wilcock, R.J. and Nagel's J.W., "Water Science Technology" (2001) 43: 163-168.
4. Nayak, B.B., Panda, U.C., Panigrahi, P.K. and Achrya, B.C., "Chem. Environ. Res." (2001) 10(3-4): 203-218.
5. Hussain, M.F. and Ahmed, I. "Ind. J. Environ. Health" (2002) 44(1): 41-49.
6. Baptise, A.R. and Altaf, K., "Indian J. Aquatic Biol.," (2002) 17(1): 23-25.
7. Bhandra, B., Mukherjee, S., Chakravotry, R and Nanda, A.K., "J. Environ. Biol." (2003) 24(2): 59-68.
8. Garg, V.K. and Totawat, K.L., "Journ. Environ. Science and Engg.," (2004) 46(1): 61-64.
9. APHA "Standard Methods of Examination of Water and Waste" American Public Health Association; Washington D.C., (1989).
10. NEERI "Manual of Water and Waste Analysis" NEERI Publication (1988).
11. WHO "Guidelines for Dinking Water Quality" Vol. 1, Recommendations in Geneva WHO (1984) 130.
12. Ciaccio, Leonad L. "Water and Water Pollution-Handbook", Vol. 1 Marcel Dekker Inc. New York., (1971)
13. Handa, B.K., Kumar, A., Goyal, D.K. and Sondhi, T.N., "Pollution of Natural Waters in UP, Technical Report #6, CGWB; Lucknow. 280.


