A Study on Physical Characterization of Municipal Solid Waste of Jammu City on the basis of Socioeconomic Status of the Population
Bhawana Sharma
 , Pankaj Mehta
*
and Preeti Verma
, Pankaj Mehta
*
and Preeti Verma
1
Department of Environmental Sciences,
Central University of Jammu,
Samba,
Jammu and Kashmir
India
http://dx.doi.org/10.12944/CWE.18.3.36
Copy the following to cite this article:
Sharma B, Mehta P, Verma P. A Study on Physical Characterization of Municipal Solid Waste of Jammu City on the basis of Socioeconomic Status of the Population. Curr World Environ 2023;18(3). DOI:http://dx.doi.org/10.12944/CWE.18.3.36
Copy the following to cite this URL:
Sharma B, Mehta P, Verma P. A Study on Physical Characterization of Municipal Solid Waste of Jammu City on the basis of Socioeconomic Status of the Population. Curr World Environ 2023;18(3).
Download article (pdf) Citation Manager Publish History

Introduction
Generation of waste is one of the unavoidable factors of the human existence on planet earth. Waste has been generated since ancient times in the households. These waste material usually consisted of food waste, fruit and vegetable peels etc. These material were organic and return to soil or fed to cattle. But with the introduction of plastic the nature of waste started to change gradually. Also increasing population and urbanization led to generation of large quantities of waste 1. This waste falls into one of three categories: solid, liquid, or gaseous wastes. However gaseous emissions into the atmosphere were given serious emphasis along with liquid waste but the area of solid waste is often neglected. Solid waste is the useless, undesirable, discarded solid materials generated by humans in residential, industrial, and commercial areas. It consists of innumerable distinct components, including vegetable refuse, papers, glass, plastics, wood, garden clippings, food waste, radioactive wastes, and hazardous waste. The term also refers to the accumulation of agricultural, industrial, commercial, and mineral residues, among others 2. MSW is defined as waste that consists of all domestic refuse, commercial waste, institutional waste, street cleansing and construction wastes, and sanitation residue, and is primarily generated by residential and commercial complexes.
The composition and quantity of municipal solid wastes differ greatly for different municipalities and at different seasons in the year. The important factors responsible for these variations are industrialization and urbanization, festivals, per capita income, climate, social customs, geography, geology etc. Urbanization is responsible for more solid waste generation because generation rates of MSW of urban population are more than that of rural ones. SWM involves the procedures of collecting, treating, transportation and disposal of solid material that is discarded 3. The main objectives of SWM are to control, collect, process, utilize and disposal of solid wastes such that the health of human being and natural environment is protected in an economical manner 4. Serious environmental issues are caused by the improper handling and disposal of these waste products. Nevertheless, numerous waste materials possess the potential for reuse, presenting an opportunity for energy generation when managed effectively. The Earth Summit (1992, 2002) organized by the UNCED introduced the notion of sustainable waste management, aiming to integrate ecological, economic, and social advancements 5.
India is 2nd largest country in terms of population, having a population of 1.30 billion which accounts for about 18% of total population of world. As India is experiencing rapid growth of population and also experiencing upliftment in terms of economic, technology as well as in socio-economic status, which has direct effect on the waste generation 6. India produces approx. 1,50,000 tons of MSW per day with 0.17 kg/capita/day in small towns and 0.62 kg/capita/day in big cities 7. Big cities like Bangalore, Hyderabad, Delhi, Kolkata, Chennai, Mumbai and Ahmadabad accounts for about 70% of population of India and are among top producers of MSW in India 8. MSW of India has a major fraction of organic constituents i.e. 40%-50% 9.
The generation of municipal solid waste (MSW) exhibits a robust relationship with the demographic size. As India experiences growth, the corresponding surge in waste production from both cities and villages is notable. Economic development, geographical factors, seasonal fluctuations, lifestyle, standard of living, and population dynamics significantly influence the quantities of MSW produced 10. Therefore, it is imperative to gather data on generation patterns and quantity variations to implement efficient MSW management practices and achieve resource recovery effectively 11.
The collection of MSW involves gathering waste from diverse sources such as residential areas, commercial zones, and institutions, transporting it to the waste disposal site 12. Methods for waste collection are generally classified based on the type of waste and the mechanism of action. Numerous studies indicate that MSW is often gathered and stored in common bins without segregation. In India, waste collection bins include reinforced cement concrete (RCC), masonry, plastic, and metallic containers. Inefficient design and installation of waste collection bins in many cities contribute to poor collection efficiency. To address this, municipal authorities have implemented strategies such as pre-informed collection timings, house-to-house collection and community bin collection to enhance collection efficiency. Studies suggest that the collection efficiency of waste in Indian cities is approximately 70% 13.
Transportation in waste management involves utilizing various means or facilities to move waste from one location to another. Typically employed vehicles include compactors, tippers, dumpers, trailers, semi-trailers, hand carts, electric carts, trucks, and trolleys. Issues considered for waste transportation encompass cost, waste density, route planning, vehicle capacity, and design 14. In India, about 70% of cities face insufficient transportation facilities. Numerous studies highlight outdated vehicles and inadequate design in waste transportation vehicles in Indian cities. Municipalities typically provide vehicles for waste transportation, although some cities opt for private contractors. Remarkably, the collection and transportation alone consume approx.. 80 to 90% of the overall budget allotted for SWM in most cities, which leads to limited resources for waste treatment and disposal 15.
Currently, the sole feasible approach for the long-term management of waste involves its disposal on or within the earth's crust. In many regions of the world, land filling MSW is recognized as the very practical and economical approach for managing waste16. In India greater than 90% of MSW disposal involve the dumping of MSW on unplanned or open landfills. Although methods of treatment such recycling, composting, and incineration are frequently employed, dumping on landfill sites continues to be the most popular method of disposing of solid waste 17. Studies on environmental inequality also reveal that such garbage facilities are frequently disproportionately set up in deprived areas or in communities with a high concentration of minorities, which results in unequal pollutant exposure. Unscientific disposal of solid wastes causes a number of environmental risks, including: air, soil, and groundwater pollution, which have a negative influence on human health 18. As a result of the disposal of MSW in open dumping sites, pollution of groundwater by leachate from unlined landfill sites is very common and is frequently seen in developing countries.
The MSW produced in Asian nations, particularly India, contains a significant proportion of organic materials. Because of the tropical environment, these materials disintegrate in rainwater and produce leachate, which, depending on the penetrability of the soil, might contaminate groundwater. The characteristics of leachate are influenced by the composition of the MSW, rainfall, hydrology of the region, interaction leachate’s interaction with underlying rocks strata, landfill design, and operating protocols 19, 20. The contamination of groundwater by leachate poses a significant and prolonged environmental threat, often remaining undetected for extended periods. Achieving sustainable waste management is acknowledged to require a multifaceted approach due to the diversified characteristics of waste. Hence, amalgamation of technologies such as sanitary landfilling, composting, RDF, recycling, and incineration is imperative for establishing an integrated waste management system. In the context of India, the predominant components of waste consist of organics, followed by paper and plastics. Consequently, waste treatment methods in Indian cities primarily involve composting and waste-to-energy processes. This comprehensive strategy addresses the varied nature of waste constituents, ensuring a more effective and sustainable management system.
MSW is one of the major concerns, particularly in developing countries, and is the reason behind many environmental concerns, like – pollution of air, water and soil and greenhouse gases emissions from landfill sites. Improper handling of solid waste has a variety of detrimental effects. Diseases are frequently spread as a result of the contamination of land and water resources caused by inappropriate waste disposal. Unscientific disposal techniques are most prevalent in developing nations, including India, where it has been estimated that 90% of the country's solid waste is thrown straight into landfills in an unacceptable manner, especially in larger cities and towns 19. The release of gases from landfills contributes significantly to global climate changes. With a substantial portion of municipal solid waste (MSW) comprising organic fractions, the disposal of waste initiates processes that transform the biodegradable components, resulting in the production of harmful gases and leachate. This rapid decomposition of the organic waste within landfills gives rise to the emission of gases, contributing to environmental issues such as greenhouse gas accumulation. The interconnected processes of waste breakdown and gas generation underscore the importance of adopting effective waste management strategies that address both environmental and public health concerns associated with landfill activities. Gases found in landfills include NH3, CO, CO2, H2S and CH4. The primary gases produced by anaerobic digestion of the organic waste components are methane and carbon dioxide. The emission of landfill gases during waste disposal poses a significant environmental threat.
To address the issue of waste and reduce its threats to health and the environment, numerous rules and policies have been developed over time. In ancient times, polluting the air, water, or land was considered a sin, as these elements were revered as 'God' and 'Goddesses.' The focus was on maintaining hygiene, cleanliness, and an uncontaminated environment. The Government of India (GOI) took early steps towards solid waste management by providing monetary support to municipalities, particularly according to the 4th five-year plan (1964-1974). In 2000, the MoEFCC formulated guidelines encompassing the collection, segregation, storage, transportation, processing, treatment technologies, and disposal of waste. These guidelines have been recently revised and are now known as the SWM Rules, 2016. Table 1 provides an indication of the rules established for various categories of waste.
Table 1: Waste management rules in India
Rules | Objectives |
EPA ,1986 | Environment protection, prevention of hazards to people, other living things, plants, and property21, 22 |
The Hazardous Wastes Management Rules, 2016 | To promote the appropriate handling of hazardous waste and prevent any harm to human health and the environment23 |
Plastic Waste Management Rules, 2016 | Prohibit the production and sale of recycled plastic bags for food packaging, and enforce a ban on the use and disposal of plastic items in drains or public spaces24 |
Bio-Medical Waste Management Rules, 2016 | Regulate the unsystematic disposal of hospital or biomedical waste25 |
SWM Rules, 2016 | Establishing guidelines for the collection, storage, transportation, treatment, and disposal of municipal solid waste (MSW), also aims to mitigate its environmental impacts 26 |
E-Waste Management Rules, 2016 | Facilitating the recovery and reuse of valuable materials from Electronic Equipments which is essential for achieving environmentally sound management27 |
C&D Waste Management Rules, 2016 | Regulate the undiscerning dumping of C&D waste along with MSW by establishing separate disposal sites dedicated specifically to the dumping of such waste28 |
Study Area
Jammu is situated along the banks of river Tawi. Due to the numerous historical temples that are located in the city, Jammu is also known as the "City of Temples". With its fast growing urban agglomerations and booming infrastructure Jammu is the second largest city in the UT. Jammu lies at 74.87°E longitude and 32.73°N Latitude sprawling in an area of 240 sq. km. Jammu is the capital of UT of J&K (winter) with a population of 5,76,195 in the year 201129.
Jammu Municipal Corporation oversees all aspects of SWM in the city. The location map of Jammu City is illustrated in Figure 1. The city has been divided into 3 Zones and 75 wards for proper and effective management.
Zone 1
Zone 1 comprises of old city area of Jammu city. Total population of zone 1 is 165059. The population density in zone 1 is high making the collection & transportation of waste a big challenge. Due to the narrow lanes, the movement of vehicles (even for handcarts) is very difficult in this zone. This zone is mostly inhibited by low and middle income group of people.
Zone 2
The extended and some peri-urban parts of the old city up to Shazadpur and Barnai comes under Zone 2. Compared to Zone 1, zone 2 has a much lower population density. Total population of zone 2 is 200318. It consists of large area wards making collection & transportation a costly preposition.
Zone 3
As mentioned above, this zone is located at the southern part of Tawi River and locally known as Trikuta region. Total population of zone 3 is 216036. This zone consists of posh areas of city and is largely consisting of high-income group population.
For present study different localities were selected as shown in Table 2 on the basis of socioeconomic status and grouped into three categories HIG, MIG and LIG as shown in Table 3. A preliminary questionnaire survey was carried out in different administrative wards of Jammu City to assess the socioeconomic status of population. Average monthly income of each socioeconomic group is shown in Table 3.
Table 2: Area (sq. Km.) and Population of selected localities
Name of Locality | Area in (sq. Km.) | Population |
Gandhi Nagar(N) | 2.8 | 8773 |
Gandhi Nagar(S) | 2.6 | 7145 |
Shastri Nagar | 2.5 | 5391 |
Channi Himmat | 4.1 | 8151 |
Trikuta Nagar | 3.9 | 7062 |
Panjtirthi | 1.9 | 6207 |
Jullaka Mohalla | 2.1 | 5888 |
Talab Khatikan | 1.98 | 4392 |
Gujjar Nagar | 2.8 | 4416 |
Kanji House | 3.1 | 7538 |
Bahu(E) | 3.4 | 11008 |
Bahu(W) | 3.3 | 4593 |
Malhotra Mohalla | 2.2 | 2072 |
Nai Basti | 3.2 | 10391 |
Paloura | 3.7 | 6653 |
Table 3: Localities and their Socioeconomic Group along with Average Household Income
Socioeconomic Group | Locality | Average income of Household (in Rupees) |
HIG | Gandhi Nagar (N), Gandhi Nagar (S), Shastri Nagar, Channi Himmat and Trikuta Nagar | Above 80000 per month |
MIG | Panjtirthi, Jullaka Mohalla,Talab Khatikan, Gujjar Nagar and Kanji House | Between Rs 15000 to Rs 80000 Per Month |
LIG | Bahu(E), Bahu(W), Malhotea Mohalla, Nai Basti and Paloura | Below Rs 15000 Per Month |
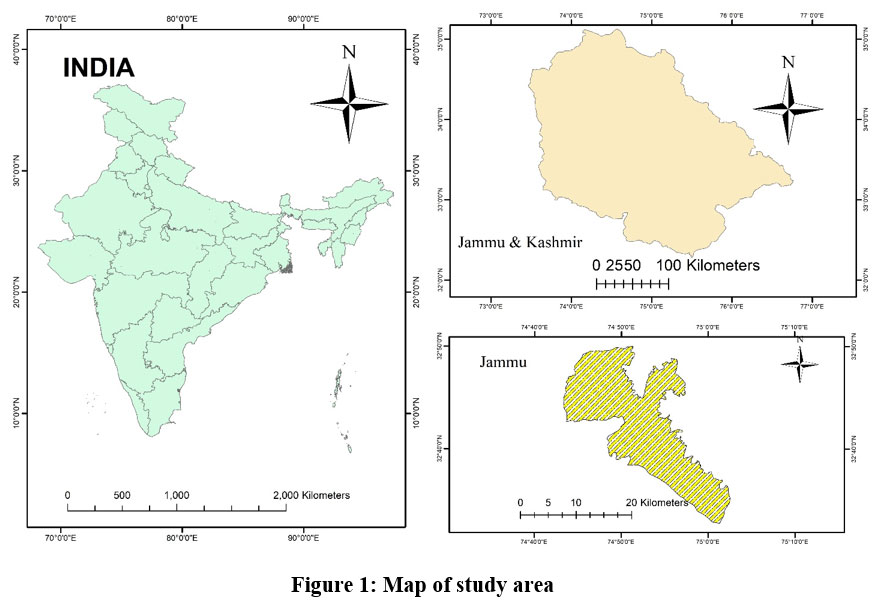 | Figure 1: Map of study area.
|
Methodology
The sampling procedures used in the present study were pursuant with the ASTM-D5231-92 guidelines30. Sampling was conducted in the month of July, 2022 during the monsoon season and samples were collected and analyzed on wet weight basis (without removal of moisture or drying of waste samples). Five representative localities were selected from each Socioeconomic group (HIG, MIG and LIG) to ensure adequate representation of the study area. A preliminary survey was carried out in the study area and socioeconomic status was decided on the basis of family income. Samples were gathered from secondary storage points during unloading of vehicles (load carriers). and segregated into their components manually. Digital weighing balance was used to measure the weight of different fractions of MSW. The segregated component includes Organic Waste (kitchen waste, food waste, fruit/vegetable peels and flowers), Paper/cardboard, Plastic/Polythene, Wooden pieces/Dry leaves, Rubber/Leather, glass, metal, Textile waste, Inert and Miscellaneous waste which includes sugarcane bagasse, human hair, coconut shells, straw/hay and thermocol. In general, inert wastes are defined as wastes that is chemically nonreactive and could not be degraded by microorganisms. The inert components present in the current study included street sweeping waste, drains cleaning waste, waste from construction and demolition of buildings which includes gravel, sand and stones. Statistical analysis is performed using MS excel and presented as pie-charts.
Results and Discussion
Physical characterization is crucial for estimating the fraction of recyclables, inert materials, and organic materials in the waste stream. This information can be utilized to determine the best methods for treating MSW. MSW production varies depending on factors including income, socioeconomic status, social trends, and cultural practices. The results of physical characterization of MSW from three different socioeconomic groups HIG, MIG, LIG of Jammu city are presented in Table 4, Table 5 and Table 6.
Table 4: Physical Characterization of MSW in High Income Group (HIG)
Components of MSW
| Gandhi Nagar(N) | Gandhi Nagar(S) | Shastri Nagar | Channi Himmat | Trikuta Nagar | Mean Value |
Organic Matter (%) | 49.97 | 49.53 | 51.19 | 51.19 | 52.55 | 50.85 |
Paper/cardboard (%) | 8.45 | 7.45 | 5.69 | 5.91 | 5.31 | 6.59 |
Plastic/Polythene (%) | 7.52 | 9.47 | 8.51 | 5.52 | 7.88 | 7.82 |
Wooden pieces/Dry leaves (%) | 3.32 | 1.92 | 4.18 | 2.00 | 1.56 | 2.62 |
Rubber/Leather (%) | 0.2 | 0.86 | 0.30 | 0.36 | 0.06 | 0.37 |
Glass (%) | 3.2 | 3.64 | 1.49 | 1.85 | 2.21 | 2.52 |
Metal (%) | 1.4 | 2.35 | 0.87 | 1.34 | 0.65 | 1.34 |
Textile Waste (%) | 0.13 | 0.73 | 0.33 | 0.36 | 0.12 | 0.34 |
Inert (%) | 19.8 | 18.34 | 18.71 | 24.46 | 23.66 | 20.89 |
Miscellaneous (%) | 5.8 | 5.72 | 8.73 | 7.01 | 5.99 | 6.66 |
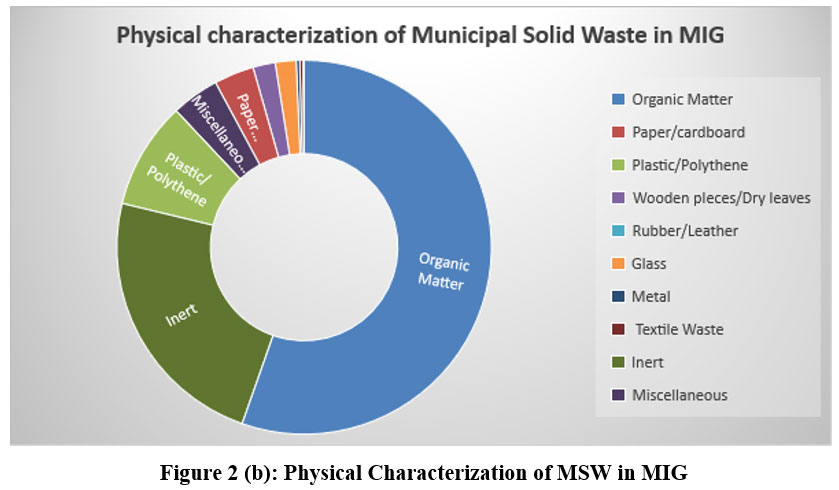
Table 5: Physical Characterization of MSW in Middle Income Group (MIG)
Components of MSW
| Panjtirthi | Jullaka Mohalla | Talab Khatikan | Gujjar Nagar | Kanji House | Mean Value |
Organic Matter(%) | 61.80 | 51.24 | 57.50 | 56.36 | 49.90 | 55.36 |
Paper/cardboard(%) | 2.36 | 3.67 | 3.62 | 4.57 | 3.05 | 3.45 |
Plastic/Polythene (%) | 8.41 | 10.33 | 7.63 | 9.40 | 10.50 | 9.25 |
Wooden pieces/Dry leaves (%) | 0.50 | 0.45 | 3.19 | 2.53 | 2.93 | 1.92 |
Rubber/Leather (%) | 0.21 | 0.07 | 0.00 | 0.00 | 0.16 | 0.09 |
Glass (%) | 1.47 | 2.43 | 1.24 | 1.70 | 2.15 | 1.80 |
Metal (%) | 0.29 | 0.41 | 0.11 | 0.26 | 0.47 | 0.31 |
Textile Waste (%) | 0.50 | 0.41 | 0.28 | 0.00 | 0.23 | 0.29 |
Inert (%) | 21.88 | 25.82 | 21.36 | 22.23 | 25.69 | 23.40 |
Miscellaneous (%) | 2.52 | 5.16 | 5.07 | 2.94 | 4.92 | 4.13 |
Table 6: Physical Characterization of MSW in Low Income Group (LIG)
Components of MSW | Bahu(E) | Bahu(W) | Malhotra Mohalla | Nai Basti | Paloura | Mean |
Organic Matter (%) | 46 | 44 | 42 | 45.3 | 44 | 44.26 |
Paper/cardboard (%) | 2 | 1.5 | 1.7 | 0.3 | 1 | 1.3 |
Plastic/Polythene (%) | 4 | 4.5 | 5 | 3.5 | 7 | 4.8 |
Wooden pieces/Dry leaves (%) | 1 | 1.2 | 0 | 0.05 | 1 | 0.65 |
Rubber/Leather (%) | 0 | 0 | 0.05 | 0 | 0.1 | 0.03 |
Glass (%) | 0 | 0 | 0.5 | 0 | 0.5 | 0.2 |
Metal (%) | 0 | 0 | 0 | 1 | 0.5 | 0.3 |
Textile Waste (%) | 0.1 | 0.09 | 0.11 | 0.08 | 0.12 | 0.1 |
Inert (%) | 43.9 | 45 | 46 | 45 | 41.8 | 44.34 |
Miscellaneous (%) | 3 | 4.07 | 4.8 | 4.7 | 4 | 4.114 |
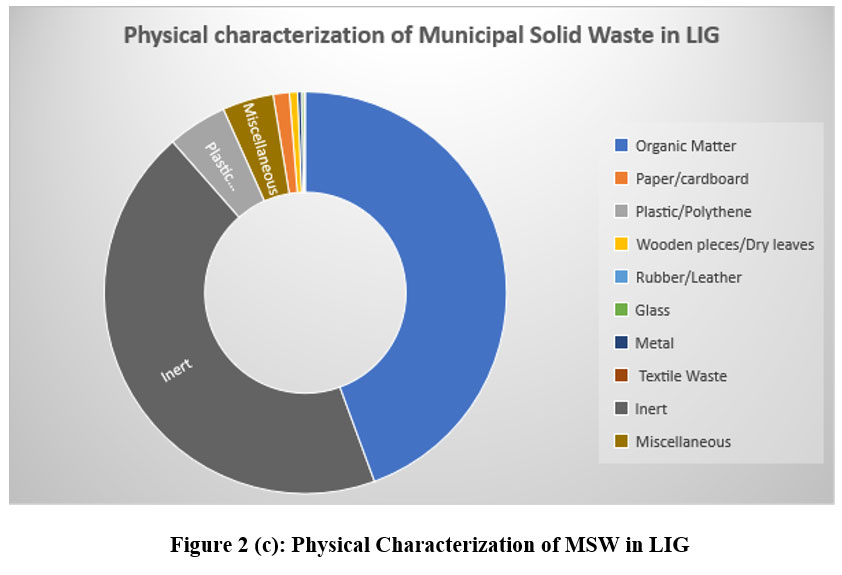
The organic/biodegradable waste comprises mainly kitchen waste, fruits and vegetables peels, green leaves and flowers generated from diverse socioeconomic groups of the city. Organic matter is found to be dominating in all socioeconomic groups (HIG, MIG and LIG) as reflected in Table 4, Table 5 and Table 6. MSW from MIG contains maximum proportion of organic waste (55%) followed by HIG (51%) and LIG (44%). Second most abundant component of MSW of Jammu city is inert waste. Jammu City's high inert fraction composition is mostly the result of an ongoing, unrestricted practice of mixing MSW with waste generated from street sweeping along with C&D waste. The fraction of inert waste is highest in LIG (44.34%) followed by MIG (23%) and HIG (21%). High percentage of inert waste is found in LIG is probably due to unpaved roads and unfurnished floors in houses.
The inorganic/non-compostable fraction of MSW in Jammu city include paper/cardboard, plastic/polythene, textiles, rubber/leather, glass and metals. It has been observed that the amount of inorganic constituents in MSW decreases with decrease in socioeconomic status. Paper/cardboard, metals and glass is found to be highest in HIG followed by MIG. MSW from LIG contains very minute fractions of Paper/cardboard, metals and glass. The probable reason for the lower proportion of paper/cardboard, metals, and glass in the waste generated by individuals from low-income groups (LIG) is the practice of selling recyclable materials to informal waste dealers. Textile waste is also found to be high in HIG as compared to MIG and LIG.
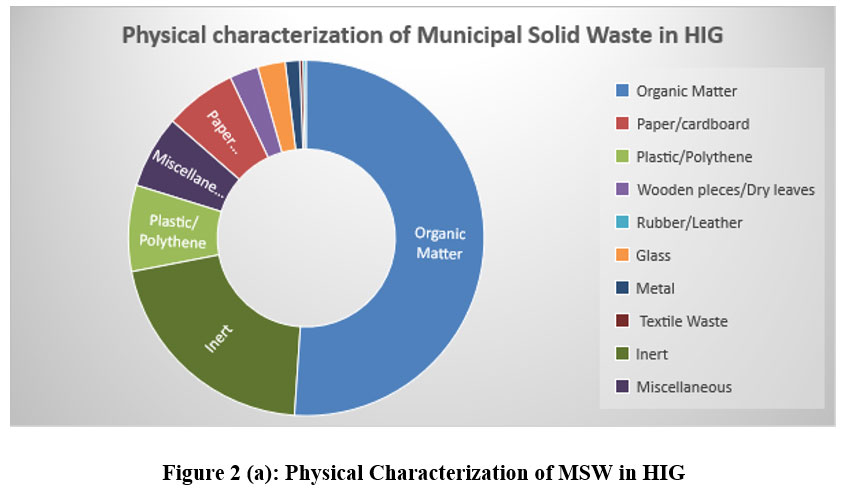 | Figure 2(a): Physical Characterization of MSW in HIG
|
 | Figure 2(b): Physical Characterization of MSW in MIG
|
 | Figure 2(c): Physical Characterization of MSW in LIG
|
Table 7: Decreasing Trend of Different Components of MSW in Different Socioeconomic Groups
Socioeconomic Group | Decreasing Trend of Different Components of MSW |
HIG | Organic Matter>Inert> Plastic/Polythene> Miscellaneous> Paper/cardboard> Wooden pieces/Dry leaves> Glass> Metal> Rubber/Leather> Textile Waste |
MIG | Organic Matter>Inert> Plastic/Polythene> Miscellaneous> Paper/cardboard> Wooden pieces/Dry leaves> Glass> Metal> Textile Waste> Rubber/Leather |
LIG | Organic Matter> Inert> Plastic/Polythene> Miscellaneous> Paper/cardboard> Wooden pieces/Dry leaves> Metal> Glass> Textile Waste> Rubber/Leather |
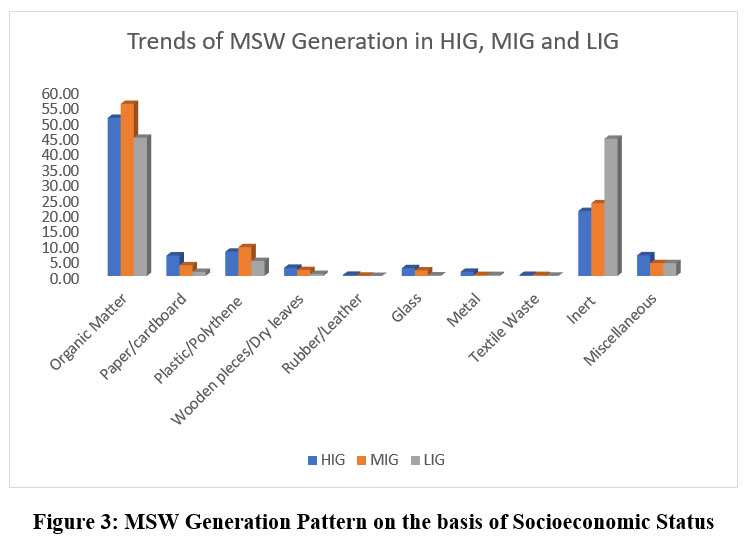 | Figure 3 : MSW Generation Pattern on the basis of Socioeconomic Status
|
The mean values obtained from five different wards in three different socioeconomic groups (HIG, MIG and LIG) are shown as pie charts in Figure 2(a, b and c) respectively. Decreasing trend of different components of waste generation in HIG, MIG and LIG is follows- Organic Matter>Inert> Plastic/Polythene> Miscellaneous> Paper/cardboard> Wooden pieces/Dry leaves> Glass> Metal> Rubber/Leather> Textile Waste ; Organic Matter>Inert> Plastic/Polythene> Miscellaneous> Paper/cardboard> Wooden pieces/Dry leaves> Glass> Metal> Textile Waste> Rubber/Leather ; Organic Matter> Inert> Plastic/Polythene> Miscellaneous> Paper/cardboard> Wooden pieces/Dry leaves> Metal> Glass> Textile Waste> Rubber/Leather. Waste generation pattern varies with socioeconomic status as reflected in Figure 3. Organic matter and Inert waste are dominating components in MSW of Jammu city in all socioeconomic groups (HIG, MIG and LIG). When amount of waste generation is observed in different socioeconomic groups, it was found that MIG is leading producer of MSW followed by HIG and LIG. The percentage of inorganic components varies with socioeconomic status. HIG is leading producer of inorganic components in MSW. LIG generates least amount of inorganic components among HIG, MIG and LIG. The percentage of inert fraction is comparatively high in LIG as compared to organic fractions and inorganic matter. Similar characterization studies performed in Shimla,31 Jalandhar, 32 Pune, 33 and almost similar results were reported 34.
Current Scenario of MSW Management in Jammu City
Present study is focused on MSW management in Jammu city. MSW management in Jammu City is handled by the Jammu Municipal Corporation (JMC). In the city, MSW collection, transportation, and disposal are all handled by JMC. The amount of MSW produced is influenced by a number of variables, including dietary preferences, societal norms, seasonal fluctuations, and the extent of economic activities. With an individual generation rate of approximately 0.55 kg per day, Jammu City produces an enormous 350–400 metric tons (MT) of solid waste every day [20]. The collection capacity must be more than or equal to the rates of solid waste generation for an efficient SWM system. However, in India, especially in Jammu the available collection capacity is frequently less than the actual waste generated, which is a major barrier to the successful execution of SWM systems. Door to Door collection of waste in Jammu city is still in infancy stage. Due to a unawareness among members of the community, segregation of waste at source is not currently being done.
Collection and transportation of MSW is done by using hand carts, rikshas or auto tippers. Waste is collected using hand carts in zone 1, where there is the highest population density in the city and the lanes are narrow. However in zone 2 and 3 where density of population less, waste is transported by auto tippers from primary collecting sites to secondary storage sites. The secondary storage sites are open areas from which waste relocated physically by JMC workers or with the use of JCBs, Front-end loaders into Dumper Placers or Refuse Compactors. Final step of MSW management is waste disposal. MSW of Jammu city is disposed at Kot Bhalwal which is 10-15 km from the city 21. It is a 19.5 acre trenching ground that is covered in legacy waste. At this time, this site has received roughly 3.00 lakh tons of waste.
Existing Problems in the Present MSWM Practices in Jammu
The current waste management practices in Jammu are not efficient as JMC is lacking in many aspects of holistic management of MSW.
Segregation of MSW at household level is not being practiced by locals. Door-to-door collection of MSW is practiced in most parts of city. This is because of the narrow lanes at certain places like in old city area, and even at some places handcarts are not viable for door to door collection.
There are 67 primary collection points and 6 secondary collection points in the city. All of them are overflowing with waste and are invaded by stray animals.
The primary to secondary waste transfer requires either manual transfer or transfer by JCB/front-end loaders by tipping the waste on to the open ground. No mechanical/automatic transfer exists. Also in both the collection phases (primary and secondary) no routing has been done to optimize the cost of transportation.
As there is no source segregation, mixed waste reaching Kot-Bhalwal is dumped in trenches without any prior treatment or processing. Recovery of resources is marginal except informal segregation of recyclables by Rag pickers.
There are no waste processing plants in JMC area, so there is huge gap to fill the National Green Tribunal compliances.
Recommendations
The results of physical characterization of MSW suggest that Jammu city has an urgent need to establish an integrated MSW management facility. This unified facility for waste management must comply with the guidelines provided in SWM Rules, 2016 12. The following alternatives are recommended based on the results attained from the physical characterization of MSW conducted for the Jammu city:
Source segregation
The physical characterization data of Jammu city stipulates that the MSW contains about 42% to 61% of the organic matter and around 20% to 45% inert waste. Therefore, the practice of segregation of waste at source should be executed promptly. This can be accomplished by briefing local residents on the significance of segregation of MSW at home and its contribution in effective MSW management. Waste generated from construction activities and street sweeping should not be mixed with MSW. This waste reduces the total energy content of MSW. To further aid in source segregation of the waste, color coded dustbins must be installed at different locations in Jammu city and at homes. For an efficacious management system, the carrying capacity of each container and bin must be estimated according to the rates of waste generation, population, and the density of population in different parts of Jammu city.
Recycling and recovery
In order to save resources and stop environmental deterioration, recycling and garbage recovery are strongly encouraged. India has a plastic recovery rate of about 40%, which is substantially greater than many other developed countries, many of which have recycling rates of only 10-15% 35,36. Unfortunately, Jammu City lacks formal facilities for recovery or recycling. In order to reap the rewards of the recycling process, it is suggested that formal recycling units be introduced. In these units, waste should be properly recycled. In Jammu City, there are currently some informal recyclers who participate in the recycling process at local level. These recyclers are largely unorganized, unrecognized businesses and they do not contribute to the local economy.
Composting
The total management of MSW cannot be accomplished by adopting a single technique. Composting at home or at community level ought to be promoted because it would decrease the load on dumping grounds. Composting or even vermi-composting has been advocated by many researches in India as well as abroad 37,38 as it has significant impact on the management of organic waste. According to the results obtained from physical characterization of the MSW from Jammu City, greater than 50% of the MSW was organic and was disposed in open dumping areas without following any scientific procedures. Composting is a good technique to use in the city in this situation. The best way to dispose of urban solid waste is to compost it and use it as organic fertilizer for the soil since it stabilizes the organic matter and reduces the quantity of waste that needs to be disposed of in landfills. The SWM Rules, 2016 identify waste segregation as a requirement for efficacious composting, yet many municipalities do not take this into account when setting composting units 12,38.
Engineered landfill
For Jammu city, it is recommended that a properly engineered, sanitary landfill site should be constructed. This landfill site should also have suitable system for leachate collection and extraction, which would assist control ground water pollution39.
Other recommendations
Finally yet importantly, public involvement is essential for the integrated solid waste management strategy to be implemented successfully. The public has to be informed about waste minimization strategies, waste segregation, and garbage recycling or reuse on a regular basis. The workers who participate in waste management activities in the city need to receive appropriate training, which should include information on potential occupational health risks. The waste handlers should get regular medical checkup. In order to inform and educate the public about waste management issues, there is also a critical need for the active participation of the media, NGO's, schools, and other educational institutions. All vehicles involved in the city's MSWM should be equipped with GPS tracking and route optimization system as well.40
Conclusion
In conclusion, constantly rising volume of solid waste is a vital issue at the local, national, and international levels. Prediction and estimation of different components in MSW play a vital role in designing future waste management plans. Results obtained from present study reveal that MSW of all socioeconomic groups of Jammu city (HIG, MIG and LIG) contain high percentage of organic matter (42% to 61%) followed by inert waste (20% to 45%). Inorganic components in MSW of Jammu city varies with socioeconomic status. Percentage of paper/cardboard, metals and glass is found to be highest in HIG followed by MIG and LIG. Based on these results it is suggested that a single technology would not be suitable for proper MSW management in Jammu. For complete management of MSW of Jammu city integrated technologies need to be adopted like RDF facility along with composting/bio-methanation plant. MSW from HIG contains large quantities of inorganic components (paper/cardboard, Plastic, polythene) therefore it is suitable for RDF. However MSW from MIG contains high concentration of organic matter and thus it is suitable for composting/bio-methanation. Inert fraction should not be mixed with MSW as it just increases the volume and weight of MSW and can be disposed off easily. It's high time that authorities change their perspective about waste. Rather than treating it as a burden to be disposed of, we should recognize that waste contains valuable materials and energy that can be recovered and reused. By adopting a circular economy approach to waste management, waste can be turned into wealth thus creating a more sustainable and prosperous future.
Acknowledgements
The authors are thankful to Department of Environmental Sciences, Central University of Jammu for necessary guidance and support. The authors are also grateful to officials from Jammu Municipal Corporation for providing data and information as required by the authors. The cooperation and help extended by the workers at the dump site is also acknowledged
Conflict of Interest
The authors do not have any conflict of interest.
Funding Sources
The author(s) received no financial support for the research, authorship, and/or publication of this article.
References
- Gour AA, Singh SK. Solid Waste Management in India: A State-of-the-Art Review. Environmental Engineering Research. 2023;28(4).
CrossRef - Das S, Bhattacharyya BK. Estimation of municipal solid waste generation and future trends in greater metropolitan regions of Kolkata, India. Journal of industrial engineering and management innovation. 2014 30;1(1):31-8.
CrossRef - Sharholy M, Ahmad K, Mahmood G, Trivedi RC. Municipal solid waste management in Indian cities–A review. Waste management. 2008 1;28(2):459-67.
CrossRef - Keisham S, Paul B. A review on the recent scenario of municipal solid waste management in India. International Journal of Engineering Research and General Science. 2015;3(3):528-42.
- Vij D. Urbanization and solid waste management in India: present practices and future challenges. Procedia-Social and Behavioral Sciences. 2012 1;37:437-47.
CrossRef - Kumar S, Smith SR, Fowler G, Velis C, Kumar SJ, Arya S, Rena, Kumar R, Cheeseman C. Challenges and opportunities associated with waste management in India. Royal Society open science. 2017 Mar 22;4(3):160764.
CrossRef - Kumar S, Bhattacharyya JK, Vaidya AN, Chakrabarti T, Devotta S, Akolkar AB. Assessment of the status of municipal solid waste management in metro cities, state capitals, class I cities, and class II towns in India: An insight. Waste management. 2009 1;29(2):883-95.
CrossRef - Central Pollution Control Board (Cpcb), Delhi “Status of Solid Waste Generation, Collection, Treatment and Disposal In Metro Cities” 2011, 2012, 2016
- World Bank “What A Waste: Solid Waste Management in Asia” Urban Development Sector Unit East Asia and Pacific Region, 1999, 2014, 2016.
- Giusti L. A review of waste management practices and their impact on human health. Waste management. 2009 1;29(8):2227-39.
CrossRef - Nandan A, Yadav BP, Baksi S, Bose D. Recent scenario of solid waste management in India. World Scientific News. 2017(66):56-74.
- Ministry Of Environment, Forest And Climate Change Notification New Delhi (2016) The Gazette Of India: Extraordinary.
- Rana R, Ganguly R, Gupta AK. An assessment of solid waste management system in Chandigarh City, India. Electron. J. Geotech. Eng. 2015;20(6):1547-72.
- Kumar A, Agrawal A. Recent trends in solid waste management status, challenges, and potential for the future Indian cities–A review. Current Research in Environmental Sustainability. 2020 1;2:100011.
CrossRef - Odunlami MO. Investigation of groundwater quality near a municipal landfill site (IGQMLS). International Journal of Chemical Engineering and Applications. 2012 1;3(6):366.
CrossRef - Saarela J. Pilot investigations of surface parts of three closed landfills and factors affecting them. Environmental monitoring and assessment. 2003 ;84:183-92.
CrossRef - Talalaj IA, Biedka P. Use of the landfill water pollution index (LWPI) for groundwater quality assessment near the landfill sites. Environmental science and pollution research. 2016 ;23:24601-13.
CrossRef - Singh UK, Kumar M, Chauhan R, Jha PK, Ramanathan AL, Subramanian V. Assessment of the impact of landfill on groundwater quality: a case study of the Pirana site in western India. Environmental monitoring and assessment. 2008;141(1-3):309-21.
CrossRef - Sharma G, Sinha B. Future emissions of greenhouse gases, particulate matter and volatile organic compounds from municipal solid waste burning in India. Science of The Total Environment. 2023 1;858:159708.
CrossRef - Masood A, Ahmad K. Assessment of municipal solid waste management in Jammu city: problems, prospects and solutions. In Smart Cities—Opportunities and Challenges: Select Proceedings of ICSC 2019 2020 (pp. 257-275).
CrossRef - Alam P, Mazhar MA, Khan AH, Khan NA, Mahmoud AE. Seasonal characterization of municipal solid waste in the city of Jammu, India. InIOP Conference Series: Materials Science and Engineering 2021 1 (Vol. 1058, No. 1, p. 012061). IOP Publishing.
CrossRef - EPA,1986.https://www.indiacode.nic.in/bitstream/123456789/4316/1/ep_act_1986.pdf Accessed on 18-09-2023.
- The Hazardous Wastes Management Rules, 2016. https://www.npcindia.gov.in/NPC/Files/delhiOFC/EM/Hazardous-waste-management-rules-2016.pdf Accessed on 18-09-2023.
- Plastic Waste Management Rules, 2016. https://thc.nic.in/Central%20Governmental%20Rules/Plastic%20Waste%20Management%20Rules,%202016.pdf Accessed on 18-09-2023.
- Bio-Medical Waste Management Rules, 2016. https://cpcb.nic.in/uploads/Projects/Bio-Medical-Waste/Bio-medical_Waste_Management_Rules_2016.pdf Accessed on 18-09-2023.
- Solid Waste Management Rules, 2016. https://cpcb.nic.in/uploads/MSW/SWM_2016.pdf Accessed on 18-09-2023.
- E-Waste Management Rules, 2016. https://cpcb.nic.in/displaypdf.php?id=RS1XYXN0ZS9FLVdhc3RlTV9SdWxlc18yMDE2LnBkZg== Accessed on 18-09-2023.
- C&D Waste Management Rules, 2016. https://cpcb.nic.in/displaypdf.php?id=d2FzdGUvQyZEX3J1bGVzXzIwMTYucGRm Accessed on 18-09-2023.
- Census of India, 2011 Office of Registrar Census: Govt. of India. https://censusindia.gov.in/
- ASTM (2008) Standard test method for determination of the composition of unprocessed municipal solid waste. D5231-92, ASTM International, West Conshohocken
- Rathor RS, Khosla PK. Physico-chemical Characteristics of Solid Waste Generated in Shimla City. Journal of Tree Sciences. 2014;33(2):53-65.
- Sethi S, Kothiyal NC, Nema AK, Kaushik MK. Characterization of municipal solid waste in Jalandhar city, Punjab, India. Journal of hazardous, toxic, and radioactive waste. 2013 1;17(2):97-106.
CrossRef - Mane TT, Hingane Hemalata N. Existing situation of Solid waste management in pune city, India. Research Journal of Recent Sciences 2012 1:348–351
- Singh G, Pal Y, Juneja P, Singh A, Rameshwar R. Solid waste management scenario of Punjab: a case study. InInternational Conference on latest development in material, manufacturing and quality control 2016.
- AkhtarI MN. Prospective assessment for long-term impact of excessive solid waste generation on the environment. Int J Adv Earth Environ Sci 2000 2(2):39–45
- Hossain R, Islam MT, Shanker R, Khan D, Locock KE, Ghose A, Schandl H, Dhodapkar R, Sahajwalla V. Plastic waste management in India: Challenges, opportunities, and roadmap for circular economy. Sustainability. 2022 8;14(8):4425.
CrossRef - Pathania RA, Bhardwaj SK, Verma SU. Analysis of urban solid waste generation in Solan Town and its biorecycling through composting. Agriculture for Sustainable Development. 2014;2(2):149-52.
- Saha JK, Panwar N, Singh MV. An assessment of municipal solid waste compost quality produced in different cities of India in the perspective of developing quality control indices. Waste Management. 2010 1;30(2):192-201.
CrossRef - Ma, S., Zhou, C., Pan, J., Yang, G., Sun, C., Liu, Y., ... & Zhao, Z. Leachate from municipal solid waste landfills in a global perspective: Characteristics, influential factors and environmental risks. Journal of Cleaner Production. 2022; 333, 130234.
CrossRef - Prajapati, K. K., Yadav, M., Singh, R. M., Parikh, P., Pareek, N., & Vivekanand, V. An overview of municipal solid waste management in Jaipur city, India-Current status, challenges and recommendations. Renewable and Sustainable Energy Reviews. 2021; 152, 111703.
CrossRef


