Climate Change Mitigation Potential of Forestry Sector for Sustainability of Agro-Ecosystem: A Review
M K Tripathi1
, Hemant Kumar2
*
 and P. K. Tyagi3
1
College of Horticulture,
RVSKVV,
Mandsaur,
Madhya Pradesh
India
2
College of Forestry,
SHUATS,
Prayagraj,
Uttar Pradesh
India
3
College of Agriculture,
JNKVV,
Tikamgarh,
Madhya Pradesh
India
http://dx.doi.org/10.12944/CWE.18.3.02
Copy the following to cite this article:
Tripathi M. K, Kumar H, Tyagi P. K. Climate Change Mitigation Potential of Forestry Sector for Sustainability of Agro-Ecosystem: A Review. Curr World Environ 2023;18(3). DOI:http://dx.doi.org/10.12944/CWE.18.3.02
Copy the following to cite this URL:
Tripathi M. K, Kumar H, Tyagi P. K. Climate Change Mitigation Potential of Forestry Sector for Sustainability of Agro-Ecosystem: A Review. Curr World Environ 2023;18(3).
Download article (pdf) Citation Manager Publish History

Introduction
When compared to other terrestrial ecosystems, forests stand out as the most pervasive, diverse, and ecologically productive. These biotic components of ecosystem services are crucial because of the carbon they store and the resilience they add to the ecosystem1. The total worth of the ecosystem benefits from their involvement as well. They provide food and water for a mass of people and protect the world’s biodiversity31. The ecosystems are in danger because of the fluctuating weather patterns. The presence of forests is crucial to the process of storing carbon and cycling it through the environment. Forests can achieve this goal through several mechanisms, the most important of which are the storage of organic carbon in biomass and the exchange of atmospheric carbon dioxide (CO2) through photosynthesis, respiration, and decomposition. Both of these actions occur at some point in a plant's life cycle. Older forests can store significantly more carbon than younger forests do because the trees have perineal habits, accumulating higher carbon stocks. This is because higher carbon reserves can be found in older forests. After all, they have had more time to grow. The concentration of CO2 has risen to over 400 ppm as of recent measurements. This increase of 31% (when compared to pre-industrial levels) is a significant driver of the warming of the planet, as CO2 is a greenhouse gas that traps heat in the surrounding air, leading to the greenhouse effect and higher average temperatures in two centuries2, 3. This expansion took place over two hundred years. Emissions from activities related to changes in landscape and land cover, the combustion of fossil fuels, were the two most important contributors to this anthropogenic CO2 enrichment. There are two primary anthropogenic sources of GHGs that significantly contribute to the phenomenon of global warming. The first is the combustion of fossil fuels inside industrialized nations, while the second involves the conversion of natural grasslands and forests into agricultural systems that necessitate rigorous upkeep. Natural grasslands and woodlands are converted to croplands and pastures by agricultural production systems that are intensively managed. Throughout the world, the amount of soil organic matter (SOM) is decreasing as a direct result of these kinds of activities, which also increase the amount of greenhouse gases in the atmosphere. The results of this are detrimental to both soil fertility and agricultural output and contribute to the acceleration of climate change; these carbon losses threaten the sustainability of agricultural ecologies4, 5. Especially in the biomes that are now classified as temperate and tropical, it is expected that climate change would have an impact on the distribution and production of agricultural products and animals around the world. This might lead to millions of people going hungry and the further depletion of our agricultural resources. These two possibilities would follow from the current scenario. Several contests must be overcome to meet the current and future demands for food production. Maintaining current agricultural productivity while decreasing GHG emissions, increasing carbon sequestration, and protecting soil fertility are all challenges. Carbon dioxide levels in the atmosphere are lowered overall by both afforestation and reforestation. Furthermore, agricultural ecosystems can either contribute to atmospheric CO2 levels or remove CO2 from the atmosphere. Changing land use from grassland or forest to one more conducive to agriculture causes a substantial loss of soil organic carbon13. The emission of carbon dioxide into the atmosphere is to blame for this wasting away. This occurs because plant biomass and soil organic carbon undergo a catalytic breakdown and/or combustion during the process. When soil is farmed, the top layer is often stripped of its organic matter. Soft-path agricultural technology, such as complex agroecosystems like agroforestry systems, may greatly contribute to lowering greenhouse gas emissions, storing carbon, and other ecological benefits, all while sustaining long-term sustainable output. Aquaponics and permaculture are two further examples of "soft path" agricultural methods. Permaculture and aquaponics are two further examples of environmentally friendly farming techniques. Land management solutions from an ecological perspective need to be developed and refined rapidly if we are to close the current knowledge gaps. Therefore, recognizing the significance of sustainable farming practices as a way forward in reducing the overall quantity of carbon in the atmosphere is essential, as is the development and refinement of ecologically-based land management systems for our current understanding. This connects our current knowledge with the information we'll need in the future.
Climate Change: Global and India’s Perspective
At present, the world is seeing a rapid, broad climatic shift that is speeding up. The average earth surface temp has increased by 0.65 to 1.06 °C between 1880 and 2012, as measured by a linear trend 6. Between 1880 and 2012, this growth occurred. Human-caused global warming is expected to raise average surface temperatures by an average of 1.0 °C over pre-industrial times in a range of 0.8 °C to 1.2 °C7. If the current trend of warming persists, the global average temperature is now projected to increase by 1.50 degrees Celsius between 2030 and 2052 8. Global warming's effects on natural and man-made systems are expected to worsen if the average temperature of the world were to rise by 1.50 degrees Celsius, according to predictions. Climatic models indicate a significant rise and a global warming scenario has been observed. Between a 1.5 and 2 degree Celsius global warming scenario, these shifts are also anticipated. The IPCC has reported various manifestations of climate change, including the upward trend in average global temperatures, the occurrence of extreme heat events in densely populated areas, significant precipitation in numerous regions, and the potential for drought and precipitation deficits in other parts of the world9. The IPCC also notes that we can anticipate these variations to persist into the foreseeable future. Between 1850 and 1900 and 2006 and 2015, the average surface temperature of the Earth rose by 0.87 degrees Celsius, whereas the average temperature of the air near the land surface rose by 1.53 degrees Celsius (Fig. 1). In the year 2020, global average surface temperatures were 1.2±0.1degrees Celsius above the reference period of 1850-1900. The year 2020 has been predicted to have one of the three highest average worldwide temperatures in recorded history10. The six-year period from 2015 to 2020 has a good chance of being the warmest period ever recorded. The period will begin in 2015 and run until 2020. It is now certain that the decade between 2011 and 2020 will be remembered as the warmest in recorded history. The IPCC predicts that in the 21st century, many parts of the world would see an increase in the frequency of instances of intense precipitations11.
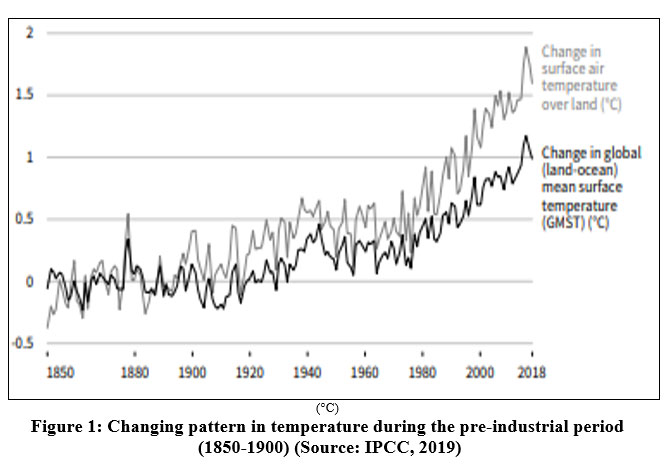 | Figure 1:Changing pattern in temperature during the pre-industrial period (1850-1900) (Source: IPCC, 2019).
|
When considering India, the vast majority of studies have shown an increase in temperature throughout a wide variety of time periods12, 13,14,15,16,17,18,19,20,21,22,23,24,25. Temperature increases like these have been linked to human-caused global warming. 2019 is the fifth warmest year, according to data compiled by the India Meteorological Department. Eleven of the warmest fifteen years on record have happened since 2005, and that pattern is projected to continue through 2019. The average annual temperature increased by 0.61 degrees Celsius between 1901 and 2019 (Fig. 2). The CMIP5 model ensemble means temperature projections for the 2030s, 2060s, and 2080s are all higher than those of the pre-industrial era. All of these forecasts are based on the year 2030, the year 2060, and the year 2080 (1880s). The study found that by the year 2030, the mean annual temperature in India is expected to rise by anywhere from 1.7 degrees Celsius to 2.02 degrees Celsius under a range of RCP scenarios, and by somewhere between 2 degrees Celsius and 4.8 degrees Celsius by the year 2080, compared to the pre-industrial base (the 1880s). This warming trend is projected to occur under a wide range of RCP scenarios. The northern half of the United States is predicted to warm up more than the southern part as a result of global warming 26. The average annual temperature in India increased by about 0.7 degrees Celsius between 1901 and 201827. Between 1986 and 2015, there was an increase in the annual mean, maximum, and lowest temperature, with values of 0.15 °C, 0.15 °C, and 0.13 °C per decade, respectively as shown in Table 1. They also discovered that, during this century, the pre-monsoon season warmed noticeably more than any other season. Pre-monsoon season temperature increases ranged from 0.20 degrees Celsius to 0.29 degrees Celsius, with an average rate of 0.26 degrees Celsius. After the end of the pre-monsoon season, the actual monsoon season began. Warmer days and nights are expected to become more common and extreme in India during the next few decades. These trends are expected to continue. More heat waves, hot days and nights are predicted under the RCP 8.5 scenario has compared to evidence from more recent epochs of history. A positive side effect of this is that really cold days and nights will occur less frequently. Multiple studies have concluded that India will experience an increase in the frequency of the events and severity of exceptionally hot temperatures28,29,30. There was a substantial drop in rainfall across most of India during the southwest monsoon season, particularly in the Indo-Gangetic Plain areas and the West Ghats region. This resulted in increased incidence and severity for both dry and wet periods over the region. As a result, there were more extended periods of drought and more intense periods of rainfall. In addition, the CMIP5 model has concluded that the increasing temperature due to human activity will have an increasing impact on the variability of monsoon season precipitation in the future31. The India Meteorological Department's review of observed variability and changes in monsoon rainfall indicates a notable decrease in annual precipitation in the north, central and north eastern states of of the country since 1989. In 2018, this data was included in a report that was made available to the public. There has been an observed increase in the frequency of heavy rainfall occurrences in various regions of India, such as Saurashtra and Kutch, the southeastern, parts of west central and the adjacent states of India. The amount of rain that falls during India's monsoon season has reportedly been decreasing in recent years32,33,34,35,36. This phenomenon has been observed in many nations, including India37,38,39,40.
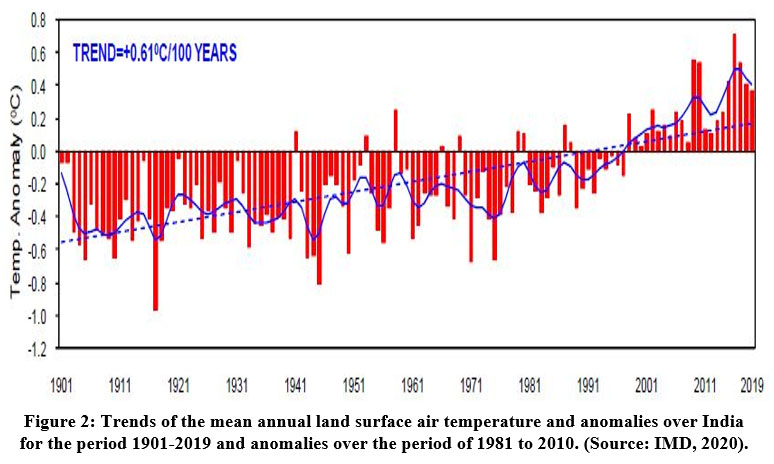 | Figure 2: Trends of the mean annual land surface air temperature and anomalies over India for the period 1901-2019 and anomalies over the period of 1981 to 2010. (Source: IMD, 2020).
|
Table 1: Observed changes in India land mean annual and seasonal surface air temperature between 1986 and 2015.
Season | Temperature trends 1986–2015 (°C per decade) | ||
| Mean | Maximum | Minimum |
Annual | 0.15*± 0.09 | 0.15*± 0.10 | 0.13*± 0.10 |
Winter (Dec–Feb) | 0.05 ± 0.16 | 0.03 ± 0.20 | 0.07 ± 0.18 |
Pre-monsoon (Mar–May) | 0.26*± 0.17 | 0.29*± 0.20 | 0.20*± 0.16 |
Monsoon (Jun–Sep) | 0.11 ± 0.12 | 0.10 ± 0.17 | 0.11*± 0.08 |
Post-monsoon (Oct–Nov) | 0.17 ± 0.17 | 0.14 ± 0.22 | 0.19 ± 0.20 |
This is especially true for carbon dioxide, which is released not only through the combustion of fossil fuels but also due to changes in land use, such as the clearing of forests. Greenhouse gases (GHGs) like carbon dioxide have been gradually increasing in the atmosphere since the beginning of the industrial revolution41. The production of aerosols and the precursors to those aerosols had and will continue to affect the climate due to human activity. As long as people keep on doing these things, we'll keep on feeling this effect. In 2019, the levels of CO2, methane gas, and nitrous oxide attained unprecedented peaks, as determined by the in-situ monitoring network established by the Global Atmosphere Watch of the World Meteorological Organization. CO2 was found to be at 410.5±0.2 ppm, CH4 at 1877±2 ppb, and N2O at 332.0±0.1ppb (Figure 3). Table 2 shows that these figures represent 148%, 260%, and 123%, respectively, of pre-industrial levels. Most of the world's greenhouse gas emissions came from just a few nations in 2018: China (26%), the US (13%), the EU (almost 8%), India (7%), and the Russian countries (5%). China has the fifth-highest share of the global total. There were a total of emissions, but these five countries were responsible for 62% of them. The proportion of Japanese contributions was around 3%. As a measure of the balance between emissions and removals, the average atmospheric concentration of carbon dioxide is a useful proxy for this equilibrium42. Carbon dioxide levels in the atmosphere are quantified by this concentration. The atmospheric buildup of carbon dioxide will take place over a far longer time frame than was previously believed. Human-caused CO2 emissions have been rising at a rate of about one percent per year over the past decade, and this trend has been going strong since the beginning of the industrial age in the years before 1750. Emissions of carbon dioxide were modest before 1750 but have increased continuously ever since. As a result, the atmospheric concentration of CO2 has been increasing at a pace of two to three parts per million each year during the past decade. Changes in how much carbon dioxide is soaked up by ecosystems and oceans each year account for nearly all of the 1 ppm annual swing in the atmospheric growth rate. About half of the CO2 produced by humans each year is taken up by ecosystems and the oceans. The rate of CO2 increase between 2018 and 2019 (2.6 ppm) was higher than the rate of increase between 2017 and 2018 (2.3 ppm) and the annual rate of increase during the preceding decade (2.37 ppm)1. India contributed 6.8% of global CO2 emissions and 7.1% of global greenhouse gas emissions in 2019. In terms of GHG emissions, carbon dioxide was responsible for roughly 70%, while other gases contributed the remaining 30%. Emissions of methane makeup 23% of non-CO2 greenhouse gas production, followed by nitrous oxide emissions (6%) and F-gas emissions (0.9%). Moreover, it was reported that India's total CO2 emissions rose by 1.6% in 2019, the slowest annual increase since 2016 when compared to the prior three years. The increase in CO2 emissions in 2016 was 1.3% compared to the previous year (Table 3). Compared to the typical annual increases that have happened since 2001, which have been greater than 5%, this is a much more controllable increase. The very low increase (1.6%) of total CO2 emissions in 2019 compared to the relatively high growth of 5.4% in emissions in 2018 is mostly because of the extremely small increases in coal consumption in India of 0.3%, oil product consumption of 2.9%, and natural gas consumption of 2.7%. About 70% of India's CO2 emissions come from coal combustion while the remaining 30% comes from the burning of oil products and natural gas. Furthermore, around half of India's CO2 emissions come from the combustion of fossil fuels, with 95% of energy coming from coal-based power plants (70% of India's coal consumption). These air pollutants are produced when fossil fuels like coal, oil, and natural gas are burned. The principal drivers of other greenhouse gases showed that India's CH4 emissions climbed by 0.6%, or 5 GtCO2 eq, in 2019, this following an average spike of 1.5% in both 2018 and 2019 (Table 4). Emissions from wastewater treatment and discharge points (+1.5%) and landfill (+2.1%) also climbed in 2019, continuing a trend of rising emissions seen in previous years, whereas the rate of enteric fermentation from cattle increased by 0.7% in 2019. Of all the causes of CH4 emissions, these three account for 41%, 18%, and 8%, respectively. There is rapid growth in all three of these areas. The triple increase in India's greenhouse gas emissions during the previous three decades, to a total of 3 gigatons of carbon dioxide equivalent, is a clear indication of the country's rapid economic development. While waste management and industrial operations are responsible for the first two types of emissions, the third type-the burning of fossil fuels in the energy sector—is the source. Roughly 20% of these emissions can be traced back to agricultural operations. In the energy sector, about 45% are attributable to emissions from power generation, 30% to emissions from industry, and 15% to emissions from transportation43. Of the remaining 10% of new jobs, agriculture and building construction account for the vast majority. Emissions have surpassed 2 tCO2e per person and are predicted to rise by another 3% to 4% annually. In 2017, we reached this milestone. Climate forcing results from a change in the Earth's energy balance, brought on by human activities such as the emission of greenhouse gases and aerosols into the atmosphere11. The process of global warming is accelerated and made more severe due to the increasing levels of greenhouse gases, which absorb an increasing quantity of infrared radiation from the globe and prevent heat from escaping into space 44. As a result of an external disruption, the Earth's energy balances shifted, and this is what we call "radiant force." This is a helpful method to conceptualize the idea of radiative force. Radiative force and radiant flux are directly correlated with the rate of change in the surface temperature. Human activities are responsible for the vast majority of atmospheric radiative forcing agent increases (including greenhouse gases and aerosols)45. Emissions of these GHGs and aerosols are included in these human activities. Because of the increased levels of these gases in the atmosphere, the greenhouse effect has been greatly magnified, and the forcing caused by this effect is increasing. The radiative forcing due to GHGs since pre-industrial times was calculated to be 2.45 Wm-2 in 1996, with an uncertainty of 15%, according to the Working Group on Intercomparison of Methods' Second Assessment Report of the IPCC46. The Working Group on Intercomparison of Methods compiled the data used to produce this estimate. Between 1750 and 1998, there was an increase of 1.48 watts per cubic meter in CO2, 0.48 watts per cubic meter in CH4, and 0.15 watts per cubic meter in N2O. As a result, powerful radiation was released. Higher concentrations of well-mixed greenhouse gases (WMGHGs) have increased the radiative forcing of 0.20 (0.18 to 0.22) W m-2 from the AR4 estimate for 2005. This might represent a rise of 8%. Radiative forcing of WMGHG over the industrial era was expected to be 2.83 (2.54 to 3.12) W m-2; the majority of the increase in human forcing since the 1960s can be attributed to increases in CO2 emissions. CO2 has a strong impact on radiative forcing, according to the vast majority of scientific opinion47,48,49. As can be seen in Figure 4, CO2 is responsible for almost 66% of the total radiative forcing that is induced by greenhouse gas emissions. Human-caused increases in carbon dioxide emissions are directly responsible for a roughly 82% rise in radiative force during the past decade. In 2014, the top three donors to worldwide RF were the United States (21.9 3.1%), the first 15 countries of the European Union (13.7 1.6%), and China (8.6 7.0%). In 2014, China was the primary offender when it came to radio frequency emissions50.
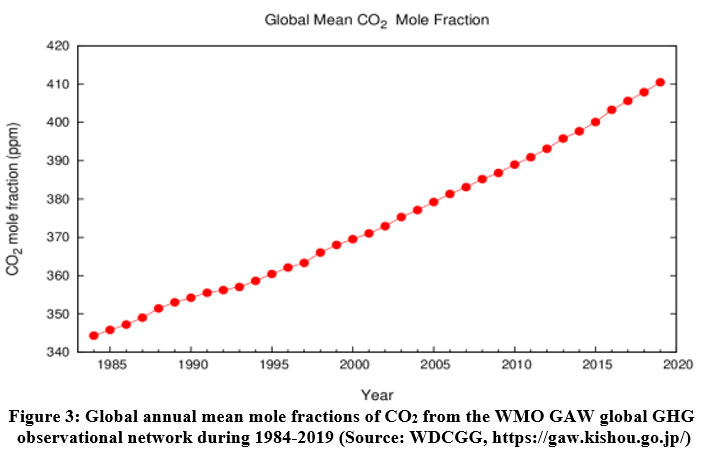 | Figure 3: Global annual mean mole fractions of CO2 from the WMO GAW global GHG observational network during 1984-2019 (Source: WDCGG, https://gaw.kishou.go.jp/).
|
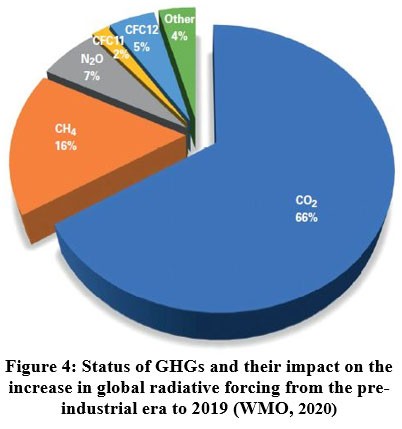 | Figure 4: Status of GHGs and their impact on the increase in global radiative forcing from the pre-industrial era to 2019 (WMO, 2020)
|
Table 2: Global annual surface mean abundances and trends of key greenhouse gases in 2019.
Description | CO2 | CH4 | N2O |
2019 global mean abundance | 410.5±0.2 ppm | 1877±2 ppb | 332.0±0.1 ppb |
2019 abundance relative to 1750* | 148% | 260% | 123% |
2018–2019 absolute increase | 2.6 ppm | 8 ppb | 0.9 ppb |
2018–2019 relative increase | 0.64% | 0.43% | 0.27% |
Mean annual absolute increase over the last 10 years | 2.37 ppm yr–1 | 7.3 ppb yr–1 | 0.96 ppb yr–1 |
Table 3: Trend markers for India's annual change in CO2 emissions over a period of time.
Indicator | Average 2001-11 | Average 2012-16 | 2015 | 2016 | 2017 | 2018 | 2019 |
CO2 | 5.9% | 4.6% | 2.6% | 1.3% | 4.5% | 5.4% | 1.6% |
TPES* | 4.5% | 3.2% | 2.0% | 3.4% | 3.2% | 5.1% | 1.8% |
1A-Coal | 6.6% | 4.5% | -2.6% | -0.5% | 4.7% | 6.3% | 0.3% |
1A-Oil | -2.8% | 5.7% | 10.1% | 5.9% | 5.1% | 4.9% | 2.9% |
1A-Gas | -15.3% | -6.6% | -1.6% | 12.1% | 13.7% | 8.1% | 2.7% |
Cement | 8.8% | 3.9% | 7.1% | -3.3% | -3.6% | -3.6% | 3.4% |
* Total Primary Energy Supply (Source: Olivier and Peters, 2020)
Table 4: Annual changes in main drivers of CH4 and N2O emissions in India.
Code | Main driver of CH4 or N2O | Average 2001-11 | Average 12-16 | 2017 | 2018 | 2019 |
1B1 | Coal production (CH4) | 4.9% | 3.8% | 0.7% | 6.9% | -0.5% |
1B2a1 | Oil production (CH4) | 1.5% | -1.2% | 0.0% | -2.3% | -5.2% |
1B2b1 | Natural gas production (CH4) | 4.9% | -7.9% | 2.9% | 0.7% | -2.1% |
4A1-d | Dairy cattle (CH4, N2O) | 2.6% | 2.4% | 3.6% | 3.8% | 3.6% |
4A1-n | Non-dairy cattle (CH4, N2O) | -0.6% | -1.7% | -2.0% | -1.9% | -1.7% |
4C | Rice cultivation (CH4) | -0.1% | -0.4% | 1.4% | 1.6% | -1.3% |
4D11 | Synthetic N fertiliser use (N2O) | 0.0% | -0.7% | 1.3% | 1.3% | 1.3% |
4D12 | Manure on soils (N2O) | 0.0% | 0.5% | 0.4% | 0.4% | 0.4% |
(Source: Olivier and Peters, 2020)
Change in Forest Lands
The process of maintaining forest ecosystems so that they may give environmental benefits to civilization now includes close monitoring of forest resources. The need to accurately detect the changes occurring in the woods has grown in importance as more and more demands are placed on the nation's forests. There are enough trees to forestall 4.06 billion ha, or 31% of the Earth's surface area. The boreal region is home to 27% of the world's woodlands, making it the second-large forest type after the temperate zone (16%). Eleven percent of the world's forests inhabits in the subtropics. About 45% of the planet's forest cover is located in the tropics. According to the United Nations' FAO, 25% of the world's forest land will be located in Europe by the year 202051. Then comes North and Central America at 19%, Africa at 16%, Asia at 15%, and Oceania at 5%. South America accounts for 21%. Forest coverage will be lowest (5%) in Oceania52. Human activity has led to the loss of 178 million ha (Table 5) of forest cover around the world since 1990. As a result of decreased tree felling in many countries and increased plantation in others and natural extension of forest cover, the rate of net forest loss has dramatically decreased between 1990 and 2020. In other words, the rate of deforestation slowed in certain countries while it accelerated in others, and vice versa. From a high of 7.8 million hectares per year in the decade 1990 to2000, the rate of net forest loss is expected to fall to 5.2 m ha per year for 2000–2010 and 4.7 million ha per year during 2010 to 2020. It is expected that the rate will decrease by this amount. Between 2010 and 2020, Africa experienced the largest yearly rate of net forest loss at 3.9 million hectares, followed by South American countries at 2.6 million hectares. In the span of three decades since 1990, the rate at which Africa's forests have been cleared has increased, leading to a record level of forest loss on the continent. However, in South America, the rate has dropped significantly compared to the period between 2000 and 2010, and it is expected to remain around 50% between 2010 and 2020. Between 2010 and 2020, the three continents with the largest absolute gains in total forest area are expected to be Oceania, Europe, and Asia. ISFR (2021) estimates that the overall forest and tree cover area in the country is 80,9 million hectares. This amounts to 24.62% of the entire land area in the country being covered. There has been a net gain of 2,261 square kilometers of forest cover across the country since the last inventory in 2019. The first form of forest cover to expand is open forest, and the last type to expand is a very dense forest. Andhra Pradesh is one of the top three states in India that has seen a rise in forest cover, with 647 square kilometers of new area. A further 632 square kilometers have been added to Telangana, and 537 square kilometers have been added to Odisha. The state of Madhya Pradesh, on the other hand, has the smallest proportion of forest cover. Mizoram, Arunachal Pradesh, Meghalaya, and Nagaland are the first through fifth states in terms of the proportion of land area that is covered by forests. With a forest cover percentage of 79.33%, Arunachal Pradesh is second only to Mizoram, which has a forest cover percentage of 84.53%53.
Table 5: Geographical area of forest under different region during1990–2020.
Region | Forest area (1000 ha) | |||
1990 | 2000 | 2010 | 2020 | |
Africa | 742801 | 710049 | 676015 | 636639 |
Asia | 585393 | 587410 | 610960 | 622687 |
Europe | 994319 | 1002268 | 1013982 | 1017461 |
North and Central America | 755279 | 752349 | 754190 | 752710 |
Oceania | 184974 | 183328 | 181015 | 185248 |
South America | 973666 | 922645 | 870154 | 844186 |
World | 4236433 | 4158050 | 4106317 | 4058931 |
(Source: FAO. 2020. GFRA 2020)
Forest Carbon Stock
Forests have the potential ability to sink CO2 from the air and store it as biomass through carbon sequestration54. Forests are a major carbon sink due to their potential to absorb roughly one-third of all biotic emissions. After that, the carbon is used to grow new plant biomass, which can be anything from the plant's leaves and roots to its wood. Cellulose from the plant may also be present in this biomass55. The carbon extent is under half of the wood's total dry weight. Because they mature more quickly, younger forests are more effective carbon sinks than their more established counterparts56. While they are quite effective at capturing carbon from the air, they lack the infrastructure to store significant amounts of the gas just yet. Due to their long growth and development cycles, the trees that make up older forests can store significantly more carbon than younger forests. This makes the more mature woods more resistant to the effects of global warming. The ability of a tree to absorb carbon from the atmosphere, on the other hand, gradually decreases as the tree ages and lives for a greater length of time. Plants store carbon both in their living biomass (such as leaves and branches) and in the stuff they produce after they die. According to estimates (Table 6), forests may hold a total of 662 Gt (163 tonnes/ha) of carbon: 68.0 Gt in decayed matter, 300 Gt in soil OM, and 295 Gt in live biomass. Global forest carbon stock lowered by 668 Gt to 662 Gt between 1990 and 2020 as the total amount of land covered in forest cover typically decreased over that time. Parts of East Asian, Western and Central Asian, Europe, and North American regions have all had substantial increases in the amount of carbon sink in their forest as biomass, whereas South American and Western and Central Africa have also witnessed major decreases. The reason for this is that the total carbon stock in forests is directly correlated to the amount of biomass found there. Carbon stock estimates are presented in Table 7 below, with the levels of forest cover over time as evaluated by the Forest Health Index (FSI). You may see these tiers in the table below. The table shows that carbon stock tends to increase steadily over time, just like the rate at which forests and tree cover are expanding. This is so because carbon stock typically displays a correlational relationship with tree and forest cover. The 2019 Indian Forest Survey estimates that 3121 GtC of biomass and an additional 4003 GtC of soil organic carbon reservoir in India's forests. Total forest carbon reserves increased from 6663 Mt in 2004 to 7204 Mt in 2021, as reported by the Forest Survey of India44. By contrasting the years 2004 and 2021, we were able to gather the data presented here. The increase can be attributed to a confluence of factors between 2004 and 2019. About 117 MtCO2e were sequestered on land, which includes forests, in 2015, creating a net sink for carbon dioxide. Reduced quantities of atmospheric carbon are indicated by this value. Having stated that it is crucial to bring to your attention the fact that in 2012 and 2013 (respectively 65 million t CO2e), estimates of CO2 absorption related to land suffered a considerable reduction. Despite this, it continued to grow in the year that followed and was much bigger than it had been in 2011. India's massive carbon deposit (7124 GtC, or 26,145 billion tonnes of CO2) has significant positive effects on both world and Indian climates. Both climates depend critically on these ecosystem services57.
Table 6: Forest carbon stock in carbon pools, by region, 2020.
Region | Carbon in living biomass | Carbon in dead wood and litter | Carbon in soil | Total carbon | ||||
Million tonnes | Tonnes/ha | Million tonnes | Tonnes/ha | Million tonnes | Tonnes/ha | Million tonnes | Tonnes/ha | |
Africa | 50 567 | 79.4 | 2 927 | 4.6 | 27 392 | 43.0 | 80 886 | 127.1 |
Asia | 37 547 | 60.3 | 6 426 | 10.3 | 40 760 | 65.5 | 84 733 | 136.1 |
Europe | 54 574 | 53.6 | 17 191 | 16.9 | 100 677 | 98.9 | 172 442 | 169.5 |
North and Central America | 41 634 | 55.3 | 31 201 | 41.5 | 73 282 | 97.4 | 146 118 | 194.1 |
Oceania | 13 881 | 74.9 | 3 247 | 17.5 | 15 935 | 86.0 | 33 063 | 178.5 |
South America | 96 331 | 114.1 | 7 057 | 8.4 | 41 457 | 49.1 | 144 846 | 171.6 |
World | 294 535 | 72.6 | 68 049 | 16.8 | 299 504 | 73.8 | 662 088 | 163.1 |
(Source: FAO, 2020. Global Forest Resources Assessment 2020: Main report, Rome.)
Table 7: Details of Carbon pool reported by FSI in different Years.
S.No. | Year | Carbon pool in Forest ( million ton) |
1 | 2004 | 6663 |
2 | 2011 | 6941 |
3 | 2013 | 7044 |
4 | 2015 | 7083 |
(Source: Source: FSI Technical Information Series, 2019, Vol. I, No. 3)
Carbon Emissions and Reversal
Agriculture, forestry, and other land uses (AFOLU) are bidirectional in their ability to absorb and release carbon dioxide. The AFOLU sector is entitled for almost 25% of global greenhouse gas emissions58,59 (net emissions 12 gigatons equivalent of carbon dioxide per year). Land used under different practices, land use changes, and forestry practices (LULUCF) were responsible for 12.5% of all human-caused carbon based emissions between 1990 and 2010. Net total emissions averaged 1.50 metric tons of carbon per year between 2008 and 2017. The average annual net emissions for that time frame, 1990-2009, were 1.14 0.5 Gt C. The average yearly net emissions during that period was 1.14 0.5 Gt C (2008-2017)60. More than 25% of all human-caused emissions worldwide originate in the AFLOU industry. The annual average of CO2 emissions fell by4.0 Gt CO2 yr-1 between 2001 and 2010 to 2.9 Gt CO2 yr-1 between 2011 and 2015, presumably because of the net conversion of forests61,62. The rate at which the planet is warming was dramatically slowed by this drop in CO2 emissions. The rate at which global warming is occurring has slowed considerably due in part to this drop in emissions. In-depth studies revealed that, even after their initial decline, the world's remaining forests remained a net C sink, offsetting with 2.1 Gt CO2 year from the atmosphere between 2011 and 2015 and 2.2 Gt CO2 annually from 2001 to 2010. Furthermore, the study demonstrated that between 2001 and 2010, the world's surviving forests maintained their annual CO2 absorption rate at 2.2 Gt. Between 2001 and 2010, the surviving forests on Earth absorbed a progressively decreasing amount of carbon dioxide (CO2). From 0.4 Gt CO2 yr-1 in the duration of 1990s to 1.1 Gt CO2 yr-1 from 2001 to 2010 and 1.0 Gt CO2 yr-1in the years 2011 to 2015 and it found that forest degradation is a major contributor to rising global CO2 emissions over the past two decades. CO2 emissions from deforestation, on the other hand, have been fairly constant over the previous few decades. Carbon dioxide emissions throughout the 1990s averaged 1.1 gigatons per year, with deforestation being the primary source63.
The agriculture industry in India was responsible for 407.8 MtCO2e in emissions in 2016, or 14.37% of the total emissions of the country64. The AFOLU sector's share of worldwide emissions in 2015 was only a fraction of what it was in other regions of the world. In India, the sector was responsible for only about 8% of all greenhouse gas emissions. GHG emissions as well removals from changes in the carbon stock in biomass fall under this category of CO2 and non-CO2 emissions from detritus and mineral soils. Changes in detritus and mineral soils also contribute to GHG emissions and removals in this industry. Greenhouse gas emissions and sinks are taken into account in this sector because of their relationship to changes in global surface temperature. Greenhouse gas emissions in Indian farming come mostly from four sources: enteric fermentation; fertilizer and manure management; paddies; food waste and residue burning; and Food scraps and agricultural byproducts also add to the problem63. However, the growth of between 0.4 and 0.6 GtCO2eq/year in global emissions of greenhouse gases caused by fossil fuels can be attributed to the usage of agricultural machinery on croplands68. The use of fossil fuels caused this. Plants, and especially the trees in forests, play a significant role in sequestering carbon dioxide from the air through a process called photosynthesis. The permanent removal of trees, on the other hand, will lead to a rise in emissions, while the rise in forest cover and other systems depending on trees, such as agroforestry have the potential to dramatically reduce emissions. One sort of such production system is agroforestry.
Agro-Ecosystem Response to Climate Change
Fluctuations in precipitation, drought, and flood patterns, as well as the migration of pests and diseases, are only a few examples of the direct as well -indirect effects of the present climate change scenario over the agroecosystem. These are only a handful of the many ways in which the agroecosystem is being largely affected by climate change. One major sector that necessitates the resilience of both social and environmental systems is agriculture, which is particularly vulnerable to climate change. Deviations in the spreading, phenology, and abundance of animal and plant species; stagnant wheat yields in some sub-regions; and forest degradation in other sub-regions are just some of the major impacts of climate change which have been seen over Europe42. These are only a few examples of the documented effects of climate change in Europe. These are only some of the repercussions that have resulted from the climate change that has been observed across Europe. If the projected climate change scenario comes to fulfillment, it is expected that the net productivity of the primary crops grown in North America will fall by the turn of the twenty-first century 65. Central and South American researchers concluded that there will be significant regional variation in the effects of agricultural output changes on food security. Both of these continents were host to the research. Research investigating the effects of climate change in Africa has found that declining cereal crop yields are a predicted outcome due to increased temperatures and altered patterns of precipitation over the areas66. Economically significant perennial crops like roses and rhododendrons could be harmed by an increase in temperature. Pests, weeds, and diseases are already having a significant impact on agricultural production, but climate change is predicted to exacerbate this trend. This is because the transmission of pests, weeds, and diseases is facilitated53. The extreme scarcity of usable water is one of the most pressing issues in Asia and a key factor in the region's development. In certain regions of Asia's terrestrial ecosystems, the recent climate change has altered plant phenologies, growth rates, and distributions25. Plant communities of varying types have been responsible for these shifts. These findings were published in an article in the journal Climate. According to projections, biodiversity, and ecological impacts, such as species extinction, will be less severe at a global warming level of 1.5 degrees Celsius compared to a level of 2 degrees Celsius. This is because a greater variety of organisms can endure in the cold. The services provided by terrestrial, freshwater, and coastal ecosystems to humans are predicted to be more secure if global warming is kept to 1.5 degrees Celsius rather than 2 degrees Celsius36, 79. Wheat and paddy harvests in some parts of India have already begun to show the negative effects of rising temperatures, water stress, and a decrease in the number of days it rains. The decline in precipitation is the root cause of this phenomenon. Precipitation days are decreasing in frequency in certain regions. Under the medium-term (2020-2039) climate change scenario, agriculture sectoral output is predicted to fall by between 4.5 and 9%. Between 2020 and 2039, this will occur. This decrease will be conditional on the intensity and location of warming. In India, dryland farming accounts for about 80% of the country's agricultural land, providing 40% of the country's food grain and at least 65% of its cow population. India, behind China, is the world’s second-largest producer of food69.
Policies for Ecosystem Sustainability
Governments at COP21 of the UNFCC devoted to drafting a new global climate treaty by the end of the summit. It is expected that between 2012 and 2030, global carbon dioxide emissions will total between 700 and 800 Gt, based on the Nationally Determined Contributions (NDCs) submitted by all of the main emitters,11,45. This document outlined the climate actions India intended to take after 2020. One of India's goals is to build an additional carbon sink of between 2.5 and 3.0 bill. tonnes of equivalent CO2, and the country has pledged to increase its forest and tree cover by the year 2030 to achieve this goal. Human efforts to recover naturally occurring forests may be responsible for up to 60% of the overall C sink that can be accomplished by 2030 (Fig. 5). The NDC's policies and programs have many aims, including those listed here: promoting clean energy, especially the renewable sources of energy; improving energy efficiency; creating less carbon-intensive and more robust urban centers; converting waste into wealth; developing smart, and sustainable green transportation networks; reducing pollution; and increasing forest and tree cover to act as carbon sinks. The Forest Conservation Act of 1980 is one of the most effective laws in India for preventing the conversion of forest land into non-forest uses if it is properly administered and enforced. The amount of land changed from its original use to one that does not entail the use of trees has decreased significantly since the introduction of this regulation. Implementing the Green India Mission correctly is one of the eight missions outlined in the National Action Plan to Combat Climate Change (NAPCC), which prioritizes protecting ecosystem services like mangroves, wetlands, and vital habitats and increasing biodiversity70. The National Afforestation Program has been active since 2000-2002 with the intention of both expanding and preserving the existing forest cover. Help from the public is needed to restore the area's woodlands after recent destruction. In 2006-2007, the Indian government launched a program called the National Bamboo Mission (NBM) to increase the amount of non-forested public and private land used for bamboo farming to increase farmer income and make these regions more resilient to the possessions of climate change. It's generally recognized that agroforestry's potential to improve local climates, protect natural resources, and generate supplemental food and cash flows could lessen the severity of climate change's negative impacts. To make the agricultural industry less susceptible to climate change, the Indian government launched the National Agroforestry Policy in 201471,72,73. The policy suggests creating a Mission or Board to help the agroforestry sector grow more systematically, which is necessary to meet the need for the sector to flourish76,77,78.
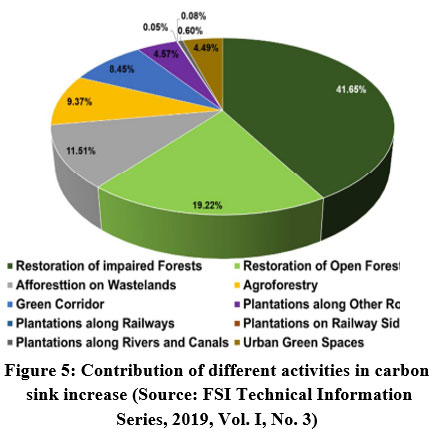 | Figure 5: Contribution of different activities in carbon sink increase (Source: FSI Technical Information Series, 2019, Vol. I, No. 3).
|
Conclusion
Even though the burning of the fossil fuels from all sources, still the key cause of rising GHG levels, agriculture and shifts in land use have substantial impacts and add greatly to the problem. Successful climate change mitigation requires many different actions, but one of the most crucial is the decrease and eventual elimination of greenhouse gas emissions from agricultural land. Given that trees can take up and store a sizable amount of carbon, the forest products sector has a great chance to mitigate climate change's negative effects. Because trees can take in and store a lot of carbon, we have a chance to make use of this. Therefore, all forest-related mitigation activities should aim to cut down on carbon emissions while simultaneously increasing forest carbon sequestration. Many strategies are being explored to improve the carbon sink which can be attained through increased forest and tree cover. These strategies include afforestation of wastelands, reforestation of damaged forests, restoration of open forests, and agroforestry. The objective of these actions is to fortify ecosystems so that more ecosystem services may be provided. Restoring natural forests to their former glory should be a primary focus of any comprehensive plan to protect water and soil. When crafting environmental policy, it's crucial to keep two primary objectives in mind: preserving ecological balance and fostering environmental stability.
Acknowledgements
Authors are grateful to all the concerned authors and digital sources from where the contents
have been quoted.
Declare the conflict of interest
Authors have no conflict of interest.
Funding source and Grant
Authors have not received any grant or funding during course of this research.
References:
- Yadav VS, Yadav SS, Gupta SR, Meena RS, Lal R, Sheoran NS, Jhariya MK, 2022.Carbon sequestration potential and CO2 fluxes in a tropical forest ecosystem, Ecological Engineering 176:1-12
- Houghton RA, House JI, Pongratz J, Van Der Werf GR, DeFries RS, Hansen MC, le Quéré C, and Ramankutty N, 2012. Carbon emissions from land use and land-cover change. Biogeosciences 9:5125–5142.
- Lal R, 2003. Global potential of soil C sequestration to mitigate the greenhouse effect. Critical Reviews in Plant Sciences 22:151–184.
- Guillaume T, Kotowska MM, Hertel D, Knohl A, Krashevska V, Murtilaksono K, Scheu S and Kuzyakov Y, 2018. Carbon costs and benefits of Indonesian rainforest conversion to plantations. Nature Communications 9(1): 1–11.
- Ziegler, AD, Phelps J, Yuen JQ, Webb EL, Lawrence D, Fox JM, Bruun TB, Leisz SJ, Ryan CM, Dressler W, Mertz O, Pascual U, Padoch C and Koh LP, 2012. Carbon outcomes of major land-cover transitions in SE Asia: Great uncertainties and REDD+ policy implications. Global Change Biology 18: 3087–3099.
- Hansen, J., Sato, M., Kharecha, P., Von Schuckmann, K., Beerling, D. J., Cao, J., & Ruedy, R. (2017). Young people's burden: requirement of negative CO 2 emissions. Earth System Dynamics, 8(3), 577-616.
- IPCC, 2014. Climate Change 2014: Summary for policymakers. In: synthesis report. contribution of working groups I, II and III to the fifth assessment report of the Intergovernmental Panel on Climate Change [Core Writing Team, Pachauri RK and Meyer LA (eds.)]. IPCC, Geneva, Switzerland, pp. 2.
- Krishnan, R., Gnanaseelan, C., Sanjay, J., Swapna, P., Dhara, C., Sabin, T. P., ... & Niyogi, D. (2020). Introduction to climate change over the Indian region. Assessment of climate change over the indian region: a report of the ministry of earth sciences (MoES), Government of India, 1-20.
- IPCC, 2018. Summary for policymakers. In: global warming of 1.5°C. An IPCC special report on the impacts of global warming of 1.5°C above pre-industrial levels and related global greenhouse gas emission pathways, in the context of strengthening the global response to the threat of climate change, sustainable development, and efforts to eradicate poverty [Masson-Delmotte, V, Zhai P, Pörtner HO, Roberts D, Skea J, Shukla PR, Pirani A, Moufouma-Okia W, Péan C, Pidcock R, Connors S, Matthews JBR, Chen Y, Zhou X, Gomis MI, Lonnoy E, Maycock T, Tignor M and T. Waterfield (eds.)]. pp. 4-7.
- WMO, 2020: The state of greenhouse gases in the atmosphere based on global observations through 2019, WMO Greenhouse Gas Bulletin No. 16, pp. 1-9
- IPCC, 2012. Managing the risks of extreme events and disasters to advance climate change adaptation. A Special Report of Working Groups I and II of the Intergovernmental Panel on Climate Change, Cambridge University Press, Cambridge, UK, pp. 582.
- Arora M, Goel NK and Singh P, 2005. Evaluation of temperature trends over India. Hydrological Sciences Journal 50(1):93.
- Chattopadhyay S, Jhajharia D and Chattopadhyay G, 2011. Univariate modelling of monthly maximum temperature time series over northeast India: neural network versus Yule-Walker equation based approach. Meteorological Applications 18(1):70–82.
- Dash SK and Hunt JCR, 2007. Variability of climate change in India; Current Science 93(6): 782–788.
- Duhan D, Pandey A, Gahalaut KPS and Pandey RP, 2013. Spatial and temporal variability in maximum, minimum and mean air temperatures at Madhya Pradesh in central India. Comptes Rendus Geoscience 345:3–21.
- Gautam R, Hsu NC, Lau KM, Tsay SC and Kafatos M, 2009. Enhanced pre-monsoon warming over the Himalayan–Gangetic region from 1979 to 2007, Geophysical Research Letters pp. 36.
- Hingane LS, Rupa Kumar K and Ramana Murthy BHV, 1985. Long-term trends of surface air temperature in India. Journal of Climatology 5(5): 521–528.
- Jhajharia D and Singh VP, 2011. Trends in temperature, diurnal temperature range and sunshine duration in northeast India. International Journal of Climatology 31:1353–1367.
- Mathison CM, Wiltshire A, Dimri AP, Falloon P, Jacob D, Kumar P, Moors E, Ridley J, Siderius C, Stoffel M and Yasunari T, 2012. Regional projections of north Indian climate for adaptation studies. Science of the Total Environment pp. 1-14
- Pant GB and Rupa Kumar K, 1997. Climates of south Asia (Chichester: John Wiley & Sons), pp. 320, (ISBN 0-471-94948-5).
- Rao GSP, Murthy MK and Joshi UR, 2005. Climate change over India as revealed by critical extreme temperature analysis, Mausam 56: 601–608.
- Rupa Kumar K, Sahai AK, Krishna Kumar K, Patwardhan SK, Mishra PK, Revadekar JV, Kamala K and Pant GB, 2006. High-resolution climate change scenarios for India for the 21st century. Current Science 90(3): 334-345.
- Srivastava HN, Dewan BN, Dikshit SK, Rao PGS, Singh SS and Rao KR, 1992. Decadal trends in climate over India. Mausam (43): 7–20.
- Subash N, Sikka AK and Ram Mohan HS, 2010. An investigation into observational characteristics of rainfall and temperature in central northeast India – a historical perspective 1889–2008, Theoretical and Applied Climatology, pp. 1-15 doi: 10.1007/s00704-010-0299-2
- Wagholikar NK, Ray Sinha KC, Sen PN and Pradeep Kumar P, 2014. Trends in seasonal temperatures over the Indian region, Journal of Earth System Science 123 (4):673-687.
- Knowles, N., & Cayan, D. R. (2002). Potential effects of global warming on the Sacramento/San Joaquin watershed and the San Francisco estuary. Geophysical Research Letters, 29(18), 38-1.
- Krishnan R, Sanjay J, Gnanaseelan C, Mujumdar M, Kulkarni A, Chakraborty S, 2020. Assessment of climate change over the Indian region: A Report of the Ministry of Earth Sciences (MoES), Government of India. pp. 13, ISBN 978-981-15-4326-5.
- Kothawale DR, Revadekar JV and RupaKumar K, 2010. Recent trends in pre-monsoon daily temperature extremes over India. Journal of Earth System Science 119(1):51–65.
- Revadekar JV, Kothawale DR, Patwardhan SK, Pant GB and Rupa Kumar K, 2012. About the observed and future changes in temperature extremes over India. Natural Hazards 60: 1133–1155.
- Rohini, P, Rajeevan M and Mukhopadhay P, 2019. Future projections of heat waves over India from CMIP5 models. Climate Dynamics 53: 975–988.
- Javadinejad, S., Hannah, D., Ostad-Ali-Askari, K., Krause, S., Zalewski, M., & Boogaard, F. (2019). The impact of future climate change and human activities on hydro-climatological drought, analysis and projections: using CMIP5 climate model simulations. Water Conservation Science and Engineering, 4, 71-88.
- Guhathakurta, P and Rajeevan M, 2008. Trends in the rainfall pattern over India, International Journal of Climatology 28:1453 – 1469.
- Jin Q and Wang C, 2017: A revival of Indian summer monsoon rainfall since 2002. Nature Climate Change 7: 587–594.
- Rao SA, Chaudhari HS, Pokhrel S and Goswami BN, 2010. Unusual central Indian drought of summer monsoon-role of southern tropical Indian Ocean warming. Journal of Climate 23:5163–5174.
- Saha A, Ghosh S, Sahana AS & Rao EP, 2014. Failure of CMIP5 climate models in simulating post-1950 decreasing trend of Indian monsoon. Geophysical Research Letters 41:7323–7330.
- Chaturvedi RK, Joshi J, Jayaraman M, Bala G and Ravindranath NH, 2012. Multi-model climate change projections for India under representative concentration pathways. Current Science 791-802.
- Ghosh S, Das D, Kao SC and Ganguly AR, 2012. Lack of uniform trends but increasing spatial variability in observed Indian rainfall extremes. Nature Climate Change 2:86-91.
- Goswami B, Venugopal V, Sengupta D, Madhusoodanan MS and Prince KX, 2006. Increasing trend of extreme rain events over India in a warming environment. Science 314:1442–1445.
- Jayasankar CB, Surendran S and Rajendran K, 2015. Robust signals of future projections of Indian summer monsoon rainfall by IPCC AR5 climate models: Role of seasonal cycle and interannual variability. Geophysical Research Letter 42:3513–3520.
- Rupa Kumar K, Krishna Kumar K and Pant GB, 1994. Diurnal asymmetry of surface temperature trends over India. Geophysical Research Letters 21(8): 677–680.
- Murphy DM and Ravishankara AR, 2018. Trends and patterns in the contributions to cumulative radiative forcing from different regions of the world. Proceedings of the National Academy of Sciences 115(52):13192-13197.
- Olivier JGJ and Peters JAHW, 2020. Trends in global CO2 and total greenhouse gas emissions: 2019 Report. PBL Netherlands Environmental Assessment Agency pp. 3
- Climate Analytics, 2021. Towards consistency between 1.5°C compatible emissions pathways and the power sector. Cases of Indonesia, Viet Nam, Philippines, India and Japan. pp. 24.
- Bright RM, Zhao K, Jackson RB and Cherubini F, 2015. Quantifying surface albedo and other direct biogeophysical climate forcings of forestry activities. Global Change Biology 21: 3246–3266.
- Byrne B and Goldblatt C, 2014. Radiative forcing at high concentrations of well-mixed greenhouse gases, Geophysical Research Letters 41: 152–160.
- John, J. G., Fiore, A. M., Naik, V., Horowitz, L. W., & Dunne, J. P. (2012). Climate versus emission drivers of methane lifetime against loss by tropospheric OH from 1860–2100. Atmospheric Chemistry and Physics, 12(24), 12021-12036.
- Mlynczak, MG, Daniels TS, Kratz DP, Feldman DR, Collins WD, Mlawer EJ, 2016. The spectroscopic foundation of radiative forcing of climate by carbon dioxide. Geophysical Research Letters 43(10): 5318–5325.
- Hofmann DJ, Butler JH, Dlugokencky E J, Elkins JW, Masarie K, Montzka SA and Tans P, 2006. The role of carbon dioxide in climate forcing from 1979 to 2004: Introduction of the annual greenhouse gas index. 58(5): 614-619 https://doi.org/10.1111/j.1600-0889.2006.00201.x
- Myhre, G, Shindell D,. Bréon FM, Collins W, Fuglestvedt J, Huang J, Koch D, JLamarque F, Lee D, Mendoza B, Nakajima T, Robock A, Stephens G, Takemura T and Zhang H, 2013: Anthropogenic and natural radiative forcing. In: climate change 2013: The Physical Science Basis. Contribution of Working Group I to the Fifth Assessment Report of the Intergovernmental Panel on Climate Change, Cambridge University Press, Cambridge, United Kingdom and New York, NY, USA. PP 664
- Fu B, Li B, Gasser T, Tao S, Ciais P, Piao S, Balkanski Y, Li W, Yin T, Han L, Han Y, Peng S and Xu J, 2021. The contributions of individual countries and regions to the global radiative forcing. Proceedings of the National Academy of Sciences 118(15):1-6.
- Ceccherini, G., Duveiller, G., Grassi, G., Lemoine, G., Avitabile, V., Pilli, R., & Cescatti, A. (2020). Abrupt increase in harvested forest area over Europe after 2015. Nature, 583(7814), 72-77.
- FAO 2020. Forest land emissions and removals. Global, regional and country trends 1990–2020. FAOSTAT Analytical Brief Series No. 12. Rome.
- ISFR, 2019. India State of Forest Report 2019, Forest Survey of India, Ministry of Environment, Forest and Climate Change, Govt. of India, Dehradun, Uttarakhand.
- Canadell JG, Pataki DE, Gifford R , Houghton RA, Luo Y, Raupach MR, Smith P and Steffen W, 2007. Terrestrial Ecosystems in a changing world. Springer, Berlin, Heidelberg, pp. 59-78.
- Peterson St-Laurent, GP and Hoberg, G. 2016. Climate change mitigation options in British Columbia’s forests: A primer. Pacific Institute for Climate Solutions, UBC Faculty of Forestry, pp. 1-26.
- Dymond, CC and Spittlehouse, DL, 2009. Forests in a carbon-constrained world. BC Forest Science Program Extension Note 92, Victoria, BC.
- Anonymous, 2020b. Mapping climate change hotspots in Indian forests based on observed climate change and high-resolution climate model projections. Forest Survey of India. 2(5): 1-63.
- Houghton RA, 1999. The annual net flux of carbon to theatmosphere from changes in land use 1850–1990.Tellus,51B, pp. 298–313.
- Rao, SA Dhakate AR, Saha SK, Mahapatra S, Chaudhari HKS, Pokhrel S and Sahu SK, 2012. Why is Indian Ocean warming consistently? Climate Change 110:709–719.
- Le Quéré C, Andrew RM and Friedlingstein P 2018. Global carbon budget 2018. Earth System Science Data 10:2141– 2194.
- IPCC, 2019. Summary for policymakers. In: climate change and land: an IPCC special report on climate change, desertification, land degradation, sustainable land management, food security, and greenhouse gas fluxes in terrestrial ecosystems [P.R. Shukla, J. Skea, E. Calvo Buendia, V. Masson-Delmotte, H.- O. Pörtner, D. C. Roberts, P. Zhai, R. Slade, S. Connors, R. van Diemen, M. Ferrat, E. Haughey, S. Luz, S. Neogi, M. Pathak, J. Petzold, J. Portugal Pereira, P. Vyas, E. Huntley, K. Kissick, M. Belkacemi, J. Malley, (eds.)], pp.9 .
- Smith, P, Clark H, and Dong H, 2014. Agriculture, forestry and other land use (AFOLU). In: climate change: mitigation of climate change. IPCC Working Group III Contribution to AR5. NY, Cambridge University Press, Chapter 11, p. 811–922.
- Federici S, Tubiello FN, Salvatore, M, Jacobs H and Schmidhuber J, 2015. New estimates of CO2 forest emissions and removals: 1990–2015, Forest Ecology and Management 352: 89-98.
- Kovats R.S., Valentini R, Bouwer LM ,Georgopoulou, E, Jacob D, Martin E, Rounsevell M and Soussana JF, 2014. Europe. In: climate change 2014: impacts, adaptation, and vulnerability. Part B: regional aspects. contribution of working group II to the fifth assessment report of the Intergovernmental Panel on Climate Change [Barros, V.R., C.B. Field, D.J. Dokken, M.D. Mastrandrea, K.J. Mach, T.E. Bilir, M. Chatterjee, K.L. Ebi, Y.O. Estrada, R.C. Genova, B. Girma, E.S. Kissel, A.N. Levy, S. MacCracken, P.R. Mastrandrea, and L.L. White(eds.)]. Cambridge University Press, Cambridge, United Kingdom and New York, NY, USA, pp.1270.
- Romero-Lankao, P, Smith JB, Davidson DJ, Diffenbaugh NS, Kinney PL, Kirshen P, Kovacs P and Villers Ruiz L, 2014. North America. In: climate change 2014: Impacts, Adaptation, and Vulnerability. Part B: Regional Aspects. Contribution of Working Group II to the Fifth Assessment Report of the Intergovernmental Panel on Climate Change [Barros, V.R., C.B. Field, D.J. Dokken, M.D. Mastrandrea, K.J. Mach, T.E. Bilir, M. Chatterjee, K.L. Ebi,Y.O. Estrada, R.C. Genova, B. Girma, E.S. Kissel, A.N. Levy, S. MacCracken, P.R. Mastrandrea, and L.L. White (eds.)].Cambridge University Press, Cambridge, United Kingdom and New York, NY, USA, pp.1443-1444.
- Magrin GO, Marengo JA, Boulanger JP, Buckeridge, MS, Castellanos, E, Poveda G, Scarano, F.R. and Vicuña S 2014. central and south America. In: climate change 2014: Impacts, Adaptation, and Vulnerability. Part B: Regional Aspects. Contribution of Working Group II to the Fifth Assessment Report of the Intergovernmental Panelon Climate Change [Barros, V.R., C.B. Field, D.J. Dokken, M.D. Mastrandrea, K.J. Mach, T.E. Bilir, M. Chatterjee, K.L. Ebi, Y.O. Estrada, R.C. Genova, B. Girma, E.S. Kissel, A.N. Levy, S. MacCracken, P.R. Mastrandrea, and L.L. White(eds.)]. Cambridge University Press, Cambridge, United Kingdom and New York, NY, USA, pp. 1499-1566.
- Niang I, Ruppel OC, Abdrabo MA, Essel A, Lennard C, Padgham J and P. Urquhart, 2014: Africa. In: Climate Change 2014: Impacts, Adaptation, and Vulnerability. Part B: Regional Aspects. Contribution of Working Group II to the Fifth Assessment Report of the Intergovernmental Panel on Climate Change [Barros, V.R., C.B. Field, D.J. Dokken, M.D. Mastrandrea, K.J. Mach, T.E. Bilir, M. Chatterjee, K.L. Ebi, Y.O. Estrada, R.C. Genova, B. Girma, E.S. Kissel, A.N. Levy, S. MacCracken, P.R. Mastrandrea, and L.L.White (eds.)]. Cambridge University Press, Cambridge, United Kingdom and New York, NY, USA, pp. 1199-1265.
- HijiokaY, Lin E, Pereira JJ, Corlett RT, Cui X, Insarov GE, Lasco RD, Lindgren E and. Surjan A, 2014. Asia.In: Climate Change 2014: Impacts, adaptation, and vulnerability. Part B: Regional Aspects. Contribution of Working Group II to the Fifth Assessment Report of the Intergovernmental Panel on Climate Change. Cambridge University Press, Cambridge, United Kingdom and New York, NY, USA, pp. 1330.
- IPCC, 2018. Summary for policymakers. In: global warming of 1.5°C. An IPCC special report on the impacts of global warming of 1.5°C above pre-industrial levels and related global greenhouse gas emission pathways, in the context of strengthening the global response to the threat of climate change, sustainable development, and efforts to eradicate poverty [Masson-Delmotte, V, Zhai P, Pörtner HO, Roberts D, Skea J, Shukla PR, Pirani A, Moufouma-Okia W, Péan C, Pidcock R, Connors S, Matthews JBR, Chen Y, Zhou X, Gomis MI, Lonnoy E, Maycock T, Tignor M and T. Waterfield (eds.)]. pp. 4-7.
- Ravindranath, NH, Rao S, Sharma N, Nair M, Gopalakrishnan R, Rao A, Malaviya S, Tiwar R, Sagadevan A, Munsi M, Krishna N and Bala G, 2011. Climate Change Vulnerability Profiles for North East India, Current Science 101(3): 384-394.
- Subash N, Sikka AK and Ram Mohan HS, 2010. An investigation into observational characteristics of rainfall and temperature in central northeast India – a historical perspective 1889–2008, Theoretical and Applied Climatology, pp. 1-15 doi: 10.1007/s00704-010-0299-2
- Anonymous, 2021. Changing rainfall Pattern in the country. Press Information Bureau
Government of India Ministry of Earth Science, http://www.imdpune.gov.in/hydrology/rainfall%20variability%20page/rainfall%20trend.html. - Ceccherini, G., Duveiller, G., Grassi, G., Lemoine, G., Avitabile, V., Pilli, R., & Cescatti, A. (2020). Abrupt increase in harvested forest area over Europe after 2015. Nature, 583(7814), 72-77.
- Forster P, Ramaswamy V, Artaxo P, Berntsen T, Betts R, Fahey DW, Haywood J, Lean J, Lowe, DC, Myhre, G, Nganga J, Prinn R, Raga G, Schulz M, Van Dorland, R and Miller HL (Ed.). (2007). Changes in atmospheric constituents and in radiative forcing In: Solomon, S., Ed., Climate Change 2007: The Physical Science Basis. Contribution of Working Group I to the Fourth Assessment Report of the Intergovernmental Panel on Climate Change, Cambridge University Press, Cambridge.
- Javadinejad, S., Hannah, D., Ostad-Ali-Askari, K., Krause, S., Zalewski, M., & Boogaard, F. (2019). The impact of future climate change and human activities on hydro-climatological drought, analysis and projections: using CMIP5 climate model simulations. Water Conservation Science and Engineering, 4, 71-88.
- MoEFCC, 2021. India: third biennial update report to the United Nations Framework Convention on climate change. Ministry of environment, forests and climate change, Government of India, New Delhi. Available from: https://unfccc.int/documents/268470.
- Sinha S and Tripathi P, 2021. Trends and challenges in valorization of food waste in developing economies: a case study of India. Case Studies in Chemical and Environmental Engineering 4:100-162
- Kumar B.M and Aravindakshan S, 2022. Carbon footprints of the Indian AFOLU (Agriculture, Forestry, and Other Land Use) sector: a review. Carbon Footprints, 1, 7. http://dx.doi.org/10.20517/cf.2022.04.
- IPCC, 2014a. Climate change 2014: synthesis report. In: Pachauri RL, Meyer LA (eds) Contribution of working groups I, II and III to the fifth assessment report of the Intergovernmental Panel on Climate Change. IPCC, Geneva.
- Anonymous, 2020a: WMO Greenhouse Gas Bulletin no. 16, pp 2.


