Drainage Morphometric analysis of Yagachi watershed area, Karnataka State, India
Sowndarya M
*
 , Annapoorna H
and Janardhana M R
, Annapoorna H
and Janardhana M R
1
Department of Geology,
Yuvaraja’s College, University of Mysore,
Mysuru,
Karnataka
India
http://dx.doi.org/10.12944/CWE.18.3.19
Copy the following to cite this article:
Sowndarya M, Annapoorna H, Janardhana M. R. Drainage Morphometric analysis of Yagachi watershed area, Karnataka State, India. Curr World Environ 2023;18(3). DOI:http://dx.doi.org/10.12944/CWE.18.3.19
Copy the following to cite this URL:
Sowndarya M, Annapoorna H, Janardhana M. R. Drainage Morphometric analysis of Yagachi watershed area, Karnataka State, India. Curr World Environ 2023;18(3).
Download article (pdf) Citation Manager Publish History

Introduction
River networks have been the subject of extensive research by geoscientists, including hydrologists, since 19501. Numerous general bivariate relationships have been found, and a wealth of literature on drainage watershed morphometry has contributed to understanding drainage evolution in the context of controlling variables in a specific geological terrain2. A naturally occurring geohydrologic unit known as a "watershed" distributes precipitation runoff to a single waterway and is categorized according to its geographic location 3. Runoff is a crucial hydrological phenomenon with detrimental impacts, including excessive floods across the river basin area and soil erosion4. Planning for watershed management, recovery, and understanding basin hydrology all depend heavily on the evaluation of watershed morphology5. The study's findings can help with topographic understanding, basin nature, defining a good place for soil preservation and lowering flash floods in the region's flat terrain6. To understand how the basin will behave in different geologic and hydrologic situations, morphometric analysis of the basin is carried out by computing its various aspects5,6. Thus, the quantitative analysis of a watershed’s drainage network offers helpful hints for comprehending the fluvial processes in a region.
The quantitative analysis of a watershed’s drainage network offers helpful hints for comprehending the processes in a region. The physicochemical properties of the exposed rocks and the hydrological nature of the drainage watershed are well-informed by evaluating any drainage watershed using quantitative analysis methods7. Water management is crucial to the sustainability of the livelihoods of all stakeholders in semi-arid and arid areas. It is necessary to have precise knowledge of the topography, geomorphology, drainage system, dividing ridge between drainage, length of the stream, and geological setup of the area in order to manage watersheds effectively and carry out water conservation measures8. Because it offers information on the watershed's slope, physical characteristics of an area, quality of the soil, runoff characteristics, potential for surface water, and other characteristics, watershed planning requires drainage analysis based on morphometric factors.9
Yagachi watershed area is located in Hassan and Chikkamagaluru districts of Karnataka State with an area of about 551.45 sq. kms. The NW (north-western) part of the Yagachi watershed area is characterized by hilly terrain belonging to the Bababudan Group of rocks of the Dharwar Super Group. Yagachi reservoir, located in the SE part of the watershed area, meets the water requirements for drinking and irrigation. Stream erosion from the north-western part and its subsequent deposition reduces the net storage capacity of the reservoir, which ultimately has an impact on socioeconomic conditions of the people living in the downstream area. In order to minimize the downstream impacts, identification of the vulnerable areas for stream erosion is warranted.
Limited research work on the drainage development, morphometry and groundwater potentiality of the Yagachi basin has been carried out by the earlier workers10,11,12,13 (Gopalakrishna et al., (2004); Suresh (2016); Poornima & Nyamathi (2017); (2018) ) and this is the first attempt to comprehend how susceptible the basin is to erosion. The present paper aims to characterize drainage morphometry and to infer the vulnerability of the Yagachi basin to erosion by quantitatively determining various morphological attributes.
Study Area
In the Bababudan hills of the Chikkamagaluru District, the Yagachi River rises. It enters Hassan District in Belur Taluk, and Yagachi is the main tributary of the river Hemavathi. It collects water from the Biranji-halla and Vedavathi-halla in the west as it flows south and enters the river Hemavathi near the Gorur village of the Arkalgud taluk. The Yagachi dam, which spans the Yagachi river, was erected in 2001. The Yagachi watershed covers an area of 551.45 Km2, located between latitudes 1306?28??N and 13023?19??N and longitudes 75038?44??E and 75054?8?? E. (Fig. 1), which falls in Survey of India topographical sheet Nos.48 O/11, 48 O/12, 48 O/15 & 48 O/16. The region is characterised geologically by rocks from the Dharwar Super Group with alluvium along the courses of ephermal streams of the Yagachi river. Archaean granitic gneisses dominate the bedrock. Geomorphologically, the area exhibits pediments, pediplains and plains with the veneer of detritus. A major type of soil in the research area is clayey skeletal, fine loamy soil developed over granitic gneisses. Other types of soils of lesser importance are loamy skeletal and silty clay soils. Alluvial soil covers the banks of the major stream. The research area's climate is categorised as tropical and is dominated by S.W. monsoon rainfall. Other sources of water are springs and underground water. Yagachi has both perennial and non-perennial channels. Most of the streams in the area are of subsequent type; their flow direction is guided by joints in the underlying rocks.
The catchment area of river Yagachi has been subdivided into 4 sub-watersheds, taking the topographic divides into consideration (Fig. 1) and the physical characteristics of the sub-watersheds (Table 1). According to Table 1, the sub-watershed SW03, which is situated on the northern side, is the largest, with sub-watershed SW04, located to the east of the reservoir, being the smallest with an aerial extent of 14.304 sq. km.
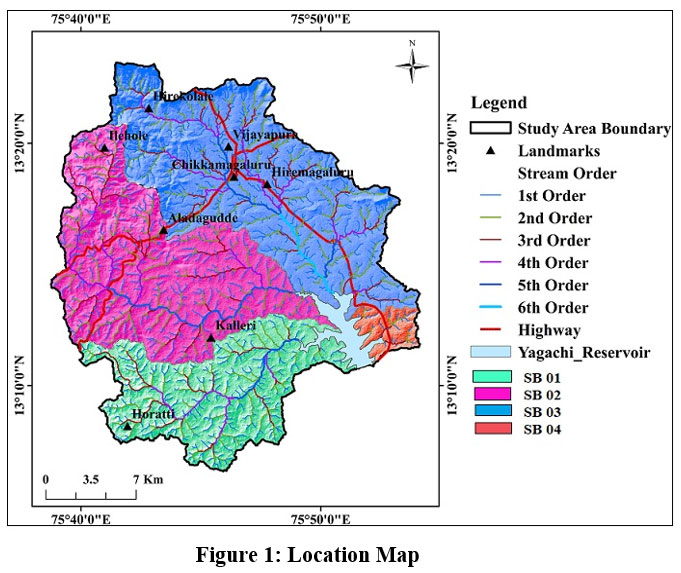 | Figure 1: Location Map
|
Table 1: Physical parameters of Yagachi river drainage watershed.
| Sub-watershed name | Area (A) (Km2) | Watershed length (Lb) (km) | Perimeter (km) |
| SW01 | 122.054 | 19.207 | 91.69 |
| SW02 | 187.448 | 22.017 | 86.105 |
| SW03 | 215.649 | 29.385 | 99.338 |
| SW04 | 14.302 | 5.461 | 28.777 |
| Total | 539.453 | - | - |
Materials and Methods
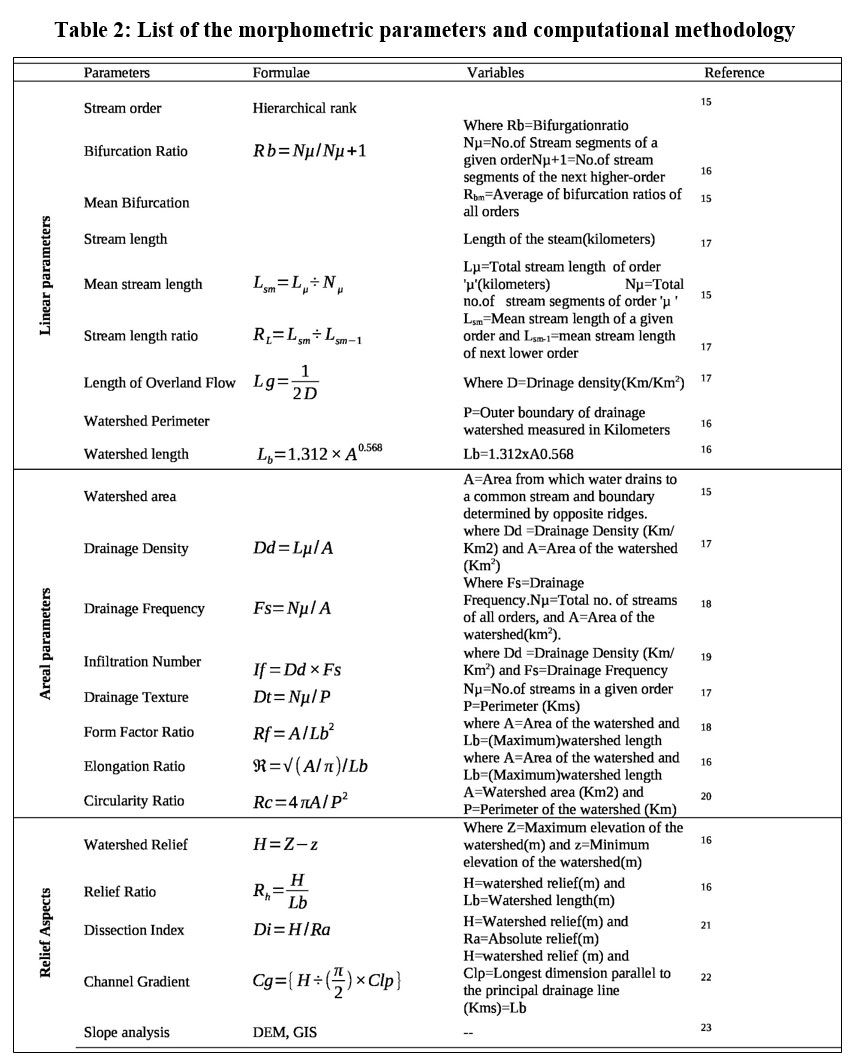
The toposheets Nos. 48 O/11, O/12, O/15, and O/16 published by Survey of India were scanned, saved in TIF format and brought to the ArcGIS environment using an interface where the map was georeferenced. Stream networks were extracted, and their orders were digitized. The Yagachi watershed receives an average annual precipitation is 1600 mm, and the Yagachi river is found to be a sixth-order stream. The Earth Explorer website (https://earthexplorer.usgs.gov) was used to obtain the DEM of the SRTM with a 30 m resolution, which was then imported into the GIS environment44. Using ArcGIS 10.4 software, the sub-watershed boundaries were marked and subdivided into 4 sub-watersheds based on the topographic divide and directions of the water flow. The sub-watersheds were designated as SW01, SW02, SW03 and SW04. However, understanding the impact of precipitation-topography links in semi-arid ecosystems is critical for analysing landscape sensitivity to changes in climate and vegetation cover14. This study encompasses only the assessment of the vulnerability of the watershed to erosion through the morphometric parameters and is thus quantitative in nature. Using GIS techniques, common parameters like stream lengths (RL), number of streams for each stream order, basin area (A), length (Lb), and perimeter (P) were measured directly from the DEM41,45. The morphometric parameters relevant to assess the sub-watersheds vulnerability to erosion were computed by well-established methods (Table 2). The significance of each one of the parameters has been discussed in detail by Shaikh6.
 | Table 2: List of the morphometric parameters and computational methodology
|
Results
Unique patterns obtained by stream networks are the outcome of adjustments to the geologic composition of landforms. Yagachi river represents the 6th order stream order according to Strahler15. The major part of the Yagachi catchment area is characterized by sub-parallel and, to a lesser extent, dendritic drainage patterns (Fig. 2). The river follows the topography and flows according to the slopes of the Yagachi river. From a wide perspective, the dendritic pattern indicates the homogeneity of rocks and soils, while the sub-parallel drainage pattern comprises the streams that are almost parallel to each other and follow the regional slope. Subparallel pattern is largely noticed in the initial orders of the streams. Hence, it implies that the sub-parallel drainage pattern is essentially an initial drainage pattern.
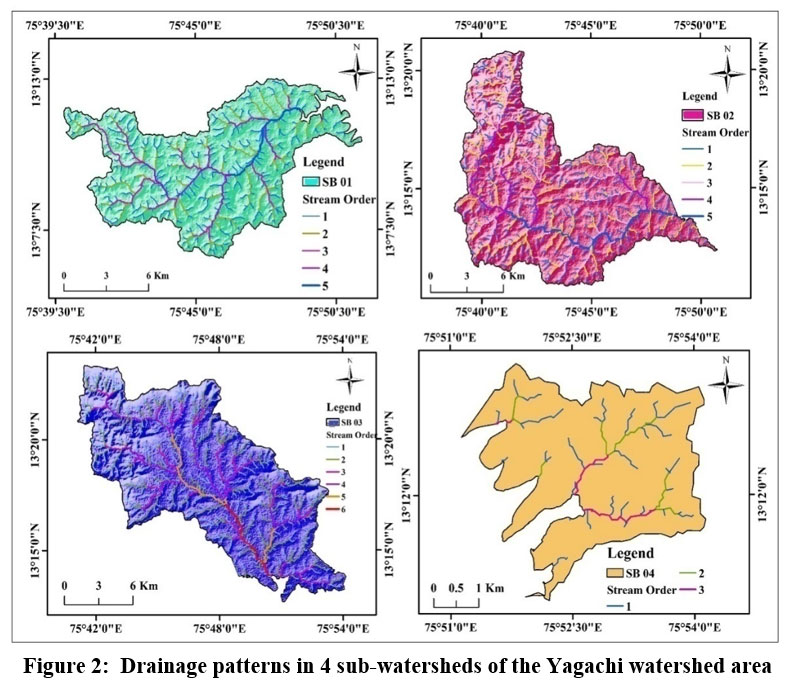 | Figure 2: Drainage patterns in 4 sub-watersheds of the Yagachi watershed area.
|
Linear Parameters
Linear parameters are uni-dimensional parameters. The evaluated parameters and the results are presented in Table 3. The topological characteristics of the stream segments are shown in a linear aspect of a drainage network. A river's behaviour from start to end, combined with crustal and structural controls of the river basin, can be inferred from the evaluation of the linear parameters3,24.
In the Yagachi watershed area, the majority of streams (approximately 80%) are 1st order streams. As shown in Table 3, the sum of stream length (Lb) of all orders in the SW03 sub-watershed is higher than the other sub-watersheds, as is the watershed lag time, despite the fact that all sub-watersheds have similar vegetation cover, soil, and underlying geology. Generally, the combined stream length (Lu) in the first order is the longest for the specified watershed, and stream length and stream order shows inverse relation. The inconsistency in the values of the stream length (Lu) is noticed in 3rd order streams of SW04 (Table 3). According to Strahler15, the Lsm of one order should be less than the next higher level. The Yagachi area also, it is noticed that the Lsm of the higher orders are less than the lower orders (Table 3). The values of the stream length ratio obtained following standard procedure17 vary from 1.049 to 4.618 and are disorderly, as noticed in the majority of the sub-watersheds of the research area (Table 3). The obtained stream length ratio values do not show any definite pattern at the sub-watershed levels. The Rbm in the Yagachi watershed varies from 3.759 to 4.769 with respect to the sub-watersheds SW03 and SW02. The computed range of the Lg of the Yagachi SW’s Lg varied from 0.631 to 0.965.
Table 3: Linear parameters of the Yagachi Sub-watersheds
Sub-watershed Name | *U | *Nu | *Lu (Km)
| *Lsm | *RL | *Rbm | *Lg (Km km2) |
| SW01 | 1 | 331 | 106.954 | 0.323 | 2.796 | 4.354
| 0.922 |
| 2 | 66 | 59.617 | 0.903 | 2.527 | |||
| 3 | 15 | 34.227 | 2.282 | 2.373 | |||
| 4 | 3 | 16.248 | 5.416 | 1.489 | |||
| 5 | 1 | 8.062 | 8.062 | - | |||
| SW02 | 1 | 514 | 162.727 | 0.317 | 1.744 | 4.764
| 0.832 |
| 2 | 109 | 60.295 | 0.553 | 3.512 | |||
| 3 | 23 | 44.661 | 1.942 | 2.599 | |||
| 4 | 5 | 25.236 | 5.047 | 3.756 | |||
| 5 | 1 | 18.958 | 18.958 | - | |||
| SW03 | 1 | 662 | 218.877 | 0.331 | 2.263 | 3.759
| 0.965 |
| 2 | 122 | 91.325 | 0.749 | 2.065 | |||
| 3 | 31 | 47.942 | 1.547 | 2.353 | |||
| 4 | 10 | 36.634 | 4.545 | 1.249 | |||
| 5 | 3 | 13.634 | 4.545 | 1.789 | |||
| 6 | 1 | 8.131 | 8.131 | - | |||
| SW04 | 1 | 35 | 12.139 | 0.347 | 1.049 | 4.25
| 0.631 |
| 2 | 7 | 2.551 | 0.364 | 4.618 | |||
| 3 | 2 | 3.362 | 1.681 | - | |||
| Total | 1 | 1542 | 500.697 | -- | -- | -- | -- |
| 2 | 304 | 213.738 | |||||
| 3 | 71 | 130.192 | |||||
| 4 | 18 | 77.883 | |||||
| 5 | 5 | 40.654 | |||||
| 6 | 1 | 8.131 |
*Note: Refer Table 1., for parameters abbreviation.
Areal Parameters
A drainage watershed's regional characteristics show the impact of its lithology, geologic structure, climatic factors, and denudational history24. Areal aspects include many parameters and chosen one for the present analysis are listed in Table 2 and outcomes of the evaluation are presented in Table 4.
Table 4: Areal parameters of the Yagachi Sub-watersheds
| Sub-watershed Name | SW01 | SW02 | SW03 | SW04 |
| *Dd (Km Km-2) | 1.844 | 1.663 | 1.930 | 1.262 |
| *Dt | 4.538 | 7.572 | 8.337 | 1.529 |
| *Fs (km-2) | 3.408 | 3.478 | 3.844 | 3.076 |
| *CCM (Km2/Km) | 0.542 | 0.601 | 0.518 | 0.792 |
| *Re | 0.183 | 0.396 | 0.318 | 0.441 |
| *Rc | 0.182 | 0.318 | 0.274 | 0.217 |
| *Ff | 0.331 | 0.387 | 0.25 | 0.48 |
*Note: Refer Table 1., for parameters abbreviation.
The research area's Drainage density (Dd) results vary from 1.262 to 1.930 km/km2 (Table 4) and show little variation. According to26, the results point to terrain with gentle to steep slopes, medium-density, and less permeable rocks with medium precipitation. However, the present authors have observed high ‘Dd’ values at the upper reaches of the watershed, indicating relatively less permeable formations, high relief, and high runoff. Thus, higher drainage density values indicate higher runoff with greater flow velocity. Fs values changes between 3.076/km2 and 3.844/km2. The values observed in the Yagachi watershed do not vary much between the sub-watersheds. Stream frequency (Fs) is highest in sub-watershed SW03 with a value of 3.844 Km-2, followed by 3.478, 3.408 and 3.076 Km-2, respectively, in SW02, SW01 and SW04 sub-watersheds. In the current research, the CCM values changes from 0.542 to 0.792 Km2/Km (Table 4). Result of the sub-watershed’s form factor show that the form of the watershed varies from elongated (0.25) to near circular (0.48) in shape. The values of the circulatory ratio of the SW’s of the Yagachi area range from 0.182 to 0.318. The greater and lower values of the sub-watersheds Elongation Ratio of the Yagachi region are 0.183 and 0.441, respectively. According to Strahler27 classification, the ‘Re’ results the Yagachi sub-watersheds indicate that they are more elongated. The texture ratio of the sub-watersheds, namely SW02 and SW03, falls in the category of fine texture ratio28. The remaining sub-watersheds, SW04 and SW01, belong to very coarse and coarse texture ratios, respectively.
Relief Parameters
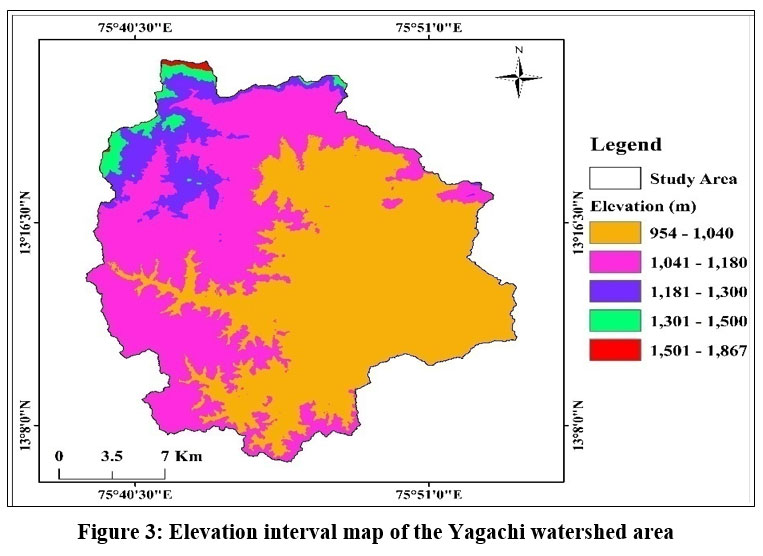 | Figure 3: Elevation interval map of the Yagachi watershed area.
|
The area presents a mountain-plain environment (Fig. 3), and the Yagachi watershed's highest point in elevation is 1867 m above MSL, and the highest watershed relief value is 903 m above MSL. The computed values of relief parameters have been presented in Table 5. Sub-watersheds do not show much contrast in their relief ratio values. However, all the sub-watersheds exhibit a moderate relief ratio, thus implying moderate vulnerability of the area to erosion. In the current investigations, values of Ruggedness Number (Rn) vary from low (Rn=0.09) to high (Rn=1.74), as shown in Table 5. The ruggedness number values of SW03 (Rn=1.74) suggest a youthful stage of geomorphic development of sub-watershed areas and significant susceptibility to soil erosion. The ‘Di’ values varies from 0.186 to 0.484 (Table 5). The computation carried out by the present investigator shows that the channel gradient values fluctuate from 0.014 to 0.035 (Table 5), thus signifying that the gradient is moderately gentle. The channel gradient values imply that the carrying capacity of the load by the streams in the study region will also be moderate.
Table 5: Relief parameters of the Yagachi sub-watersheds.
| Sub-watershed Name | SW01 | SW02 | SW03 | SW04 |
| Minimum height above *MSL(m) | 964 | 965 | 964 | 961 |
| Maximum height above *MSL(m) | 1184 | 1572 | 1867 | 1032 |
| Watershed relief (H) (m) | 220 | 607 | 903 | 71 |
| Relief ratio (Rh) (km2) | 0.011 | 0.028 | 0.031 | 0.013 |
| Ruggedness Number (Rn) | 0.41 | 0.71 | 1.74 | 0.08 |
| Dissection Index (Di) | 0.186 | 0.385 | 0.484 | 0.484 |
*MSL- Mean sea level
Discussion
Determination of the morphometric parameters provides insight into the health condition of a watershed. Several drainage morphometric parameters evaluated in order to assess the state of the Yagachi watershed area brought to light several interesting factors. From the drainage map, the SW03 is categorized as a watershed of 6th order and higher stream orders are connected with increased flow. Thus, the sub-watershed SW03 has relatively higher discharges and velocity. As can be made out from Table 3, the length of all streams of all the orders in the SW03 sub-watershed is greater than the other sub-watersheds, so, also the watershed lag time, although all the sub-watersheds are covered with similar vegetation cover, soil, and underlying geology. The total length of streams in the first order is the greatest for the particular watershed, with Lu generally decreasing as U increases. The inconsistency in the values of the total stream length may be due to the sudden drop in elevation, suggesting morphological control on the watershed area. This anomaly is noticed in 3rdorder streams of SW04. The RL of the stream orders changes due to topography and slope fluctuation circumstances and is positively connected with the watershed's surface water discharge and the stage of erosion. Generally, shorter lengths of stream indicate steep to moderate slopes and finer textures, whereas longer points to gentle to flat gradients and coarser textures. In the subject matter under investigation, it is denoted that the Lsm of the greater orders are shorter than the lower orders (Table 3). According to studies, mean stream length is lower in mountainous environments than it is in plain or plateau morphology29. At the higher reaches, low mean stream length values point to recent morphological development and considerable erosion potential. This corroborates well with the field observations wherein the N.W. portion of the research area is mountainous, and the rock formations belong to the more resistant Archaean Bababudan group of Dharwar Craton.
The anomaly in the data for the ratio of stream length may be caused by variations in geomorphic features and slope of the land30-31 and indicates that its geomorphic development is in its late youth stages32. This conforms well to the field condition in the study area. Studies by21,23,24,25 elsewhere reveal that the stream length ratios (RL) in the mountain-plain front river basins are erratic. Because of the potential for differences in watershed geometry and lithology, the values of mean bifurcation ratio (Rbm) do not quite continue to be the same from one order to the next, despite the fact that they frequently do so throughout the series1. Elongated watersheds have low bifurcation ratio (Rbm) values, while circular watersheds have high bifurcation ratio values33. Therefore, watersheds with high "Rbm" values suggest early hydrograph maxima with a chance of flash flooding after storm events34. The Rbm of the Yagachi watershed varies from 3.759 to 4.769 with respect to the SW03 and SW02, and the present values indicate that there are no major structural disturbances in the area16,35,36. Moderate to high values of Lg indicate moderate to high surface runoff. From the obtained results, it may be inferred that the region is covered with less permeable to relatively impermeable soil and less vegetation36. The values also indicate less channel erosion16.
Drainage density (Dd) facilitates numerical measurement of runoff potentiality of the watershed38 and landscape dissection. The ‘Dd’ values of the Yagachi sub-watersheds are by and large low, implying terrain with gentle to steep slopes, moderately dense vegetation, low relief, and less permeable conditions during moderate precipitation. 39 asserts that low "Dd" values typically reflect the places with thick vegetation, low relief, and coarse drainage texture that are particularly resistant to permeable subsurface material. However, the present authors have observed high ‘Dd’ values at the upper reaches of the watershed, indicating relatively less permeable formations, high relief, and high runoff. Thus, higher ‘Dd’ values indicate higher runoff with greater flow velocity. The stream frequency (Fs) values observed in the Yagachi watershed do not vary much between the sub-watersheds. Permeability, rate of infiltration, and watershed relief have all been linked to stream frequency40. Stream frequency of the Yagachi watershed reveals that the sub-watersheds are masked with a moderate amount of vegetation and have similar infiltration capacity. According to Smith28 classification, SW04 has a very coarse drainage texture (Dt) value (1.529) and denotes that the watershed is made of low to moderate relief, highly resistant permeable material, while SW01 (4.538) has moderate texture, SW02 (7.572) and SW03 (8.337) have fine to very fine ‘Dt’ values (Table 4). Moderate values of constant channel maintenance (CCM) in the present case indicate a gentle sloping environment that all the sub-watersheds are moderately erodible16, implying medium relief, medium permeability and low to moderate surface runoff and longer durations for the discharge, thus facilitating high infiltration of water. Lower form factor (Ff) values indicate longer watersheds, flatter low-flow peaks that last longer, less erosion, and lower sediment transport capacities26,27,28,29. The majority of the sub-watersheds have a circularity ratio value of around 0.247, thus indicating a strongly elongated watershed, lower runoff, and permeable soil conditions. Low Re values of the Yagachi sub-watershed imply their reduced risk of flash floods, and hence, earlier flood management is possible41. The Elongated nature of the Yagachi watershed and consequent short flood discharge period is indicated by higher shape index values26.
The sub-watersheds of the Yagachi river have relief ratio values ranging from 0.013 to 0.031. Greater relief values indicate terrain with little infiltration and high runoff. Higher relief ratio (Rr) values denote mountainous terrains with slopes ranging from moderate to steep. Ruggedness number Rn values in the current study range from low (Rn=0.09) to high (Rn=1.74), as shown in Table 5. The ‘Rn’ values of SW03 (Rn=1.74) suggest a youthful stage of geomorphic development of sub-watershed areas and significant susceptibility for soil erosion. Dissection Index values indicate moderately dissected landscape and derivation of a moderate amount of sediment load. The slope of the study region is steep at a higher elevation, and it gradually decreases. The computation carried out by the present investigator shows that the channel gradient values range from 0.014 to 0.035, thus signifying that the gradient is moderately gentle. The channel gradient values imply that the carrying capacity of the load by the streams in the study region will also be moderate.
Conclusion
The morphological control has a bearing on the stream patterns and anomalies in the stream lengths noticed at various stream orders. Low stream lengths noticed at the initial order of the streams, and the anomalous values of the ‘Rbm’ may be attributed to the presence of the Bababudan range of hills in the NW part of the study area owing to which there is the sudden drop in elevation and steep slope. High drainage density values observed at the upper reaches of the streams supplement the observation. The SW03, with the highest total stream length in the Yagachi watershed, is characterised by relatively higher discharges and velocity. Analysis of the data on the morphometric parameters indicates a gentle sloping environment with medium permeability, low to moderate surface runoff and longer durations for the discharge. All four sub-watersheds are moderately erodible, implying that the watershed area is covered with relatively less permeable soil formations vegetation, further pointing to the low vulnerability of the area to erosion and also to channel erosion. However, the sub-watershed SW03 with high stream length, drainage density and relief value with very fine drainage texture is relatively more susceptible to erosion. High relief ratio values of SW03 cannot be considered to assess the stages of the geomorphic development of the watershed as the sub-watershed presents a mountain-plain environment. The subwatershed soil's vulnerability to erosion and the lowering of sediment deposition in the reservoir is crucial for balancing the ecology and agroeconomic conditions. Promoting the growth of vegetation in the barren plains reduces soil erosion. Contour plowing is the best approach for improving soil quality and composition by minimizing runoff, increasing moisture infiltration, and increasing moisture retention. Mixed farming, crop rotation, and grazing management are just a few of the measures available to decrease soil erosion.
Acknowledgments
The authors would like to thank Yuvaraja’s College (A constituent autonomous college), University of Mysore, Mysuru, for the support extended during the field and laboratory works.
Conflict of Interest
There is no conflict of interest between the authors.
Funding Sources
The study forms a part of the thesis work of the corresponding author and would like to gratefully acknowledge the financial support by the Special cell for SC and ST, University of Mysore in the form of a research fellowship. University order No: VG8/02/2021-22, Dated: 17/12/2021/934.
References
- Altaf F, Meraj G, Romshoo SA. Morphometric Analysis to Infer Hydrological Behaviour of Lidder Watershed, Western Himalaya, India. Geography Journal. 2013;2013:1-14. doi:https://doi.org/10.1155/2013/178021
CrossRef - Talukdar, R. "Linear morphometric parameters of Jia Bhareli Basin NE India." International Refereed Journal of Engineering and Science 1 (2012): 5-12. http://irjes.com/Papers/vol1-issue3/Version%201/B130512.pdf[Google Scholar]
- Mehta, D., Prajapati, K., & Islam, M. N. Watershed Delineation and Land Use Land Cover (LULC) Study of Purna River in India. In India II: Climate Change Impacts, Mitigation and Adaptation in Developing Countries. Cham: Springer International Publishing (2022), pp. 169-181. https://doi.org/10.1007/978-3-030-94395-0_7.
CrossRef - Mehta, D., Hadvani J., Kanthariya D., and Sonawala, P. Effect of land use land cover change on runoff characteristics using curve number: a GIS and remote sensing approach. Int.Natl. Journ.Hyd Sci & Tech. 2023. Vol. 16, No. 1, pp 1–16. https://doi.org/10.1504/IJHST.2023.131824
CrossRef - Shaikh, M., Yadav, S., & Manekar, V. Accuracy assessment of different open-source digital elevation model through morphometric analysis for a semi-arid river basin in the western part of India. Journal of Geovisualization and Spatial Analysis, 2021; 5, 1-21. https://doi.org/10.1007/s41651-021-00089-4
CrossRef - Shaikh, M., Yadav, S., & Manekar, V. (2022). Application of the compound factor for runoff potential in sub-watersheds prioritisation based on quantitative morphometric analysis. Journal of the Geological Society of India, 98(5), 687-695. https://doi.org/10.1007/s12594-022-2045-7
CrossRef - Rawat U, Awasthi A, Sen Gupta D, Solomal Paul R, Tripathi S. Morphometric Analysis using Remote Sensing and GIS Techniques in the Bagain River Basin, Bundelkhand Region, India. Indian Journal of Science and Technology. 2017;10(10):1-9. doi:https://doi.org/10.17485/ijst/2017/v10i10/107875
CrossRef - Sreedevi PD, Sreekanth PD, Khan HH, Ahmed S. Drainage morphometry and its influence on hydrology in an semi arid region: using SRTM data and GIS. Environ Earth Sci. 2013;70(2):839-848. doi:10.1007/s12665-012-2172-3.
CrossRef - Rama, V. Anantha. "Drainage basin analysis for characterization of 3rd order watersheds using Geographic Information System (GIS) and ASTER data." Journal of Geomatics 8.2 (2014): 200-210. http://isgindia.org/JOG/abstracts/October-2014/JOG-VOL08nO2- Oct2014_pg75%20-85.pdf
- Gopalakrishna, G. S., Kantharaj, T., & Balasubramanian, A. Morphometric Analysis of Yagachi and Hemavathi River Basins around Alur taluk, Hassan district, Karnataka, India. Journal of Applied Hydrology (2004), Vol. XVII, No.1. pp. 9-17.https://www.researchgate.net/profile/ABalasubramanian/publication/308971010_Morphometric_Analysis_of_Yagachi_and_Hemavathi_RiverBasins_Around_Alur_Taluk_ Hassan_ District_Karnataka_India/links/57fbc55e08aea0db5a3f5dfb/ Morphometric-Analysis-of-Yagachi-and-Hemavathi-River-Basins-Around-Alur-Taluk-Hassan-District-Karnataka-India.pdf
- Suresh, K. J. Utilization of remote sensing and gis for mapping of natural resource-on water resource action plan and prioritization for Yagachi watershed Hassan district. ATMECE. International Journal of Innovative research in scence, Engineering and technology (2016). Vol. 5, Issue 6, June 2016. http://118.151.209.133:8080/jspui/bitstream/1/38/1/PROJECT3.pdf
- Poornima, H. C., & Nyamathi, S. J. Morphometric Analysis and Monthly Runoff Estimation for Yagachi Catchment. IMPACT OF GLOBAL ATMOSPHERIC CHANGES ON NATURAL RESOURCES (2018). https://www.researchgate.net/profile/Udaya-Simha-2/publication/334825397_Climate_Change_A_Regional_Scale_Case_Study_on_Meteorological_Parameters/links/5d42cc55299bf1995b5bee18/Climate-Change-A-Regional-Scale-Case-Study-on-Meteorological-Parameters.pdf#page=213
- Poornima, H. C., & Nyamathi, S. J. Morphometric analysis of Yagachi catchment 22nd International Conference on Hydraulics, Water Resources & Coastal Engineering 21-23 December-2017, Hydro-2017 International, L.D.College of Engineering Ahmedabad, India. Volume:2:1447-1452 https://www.researchgate.net/publication/323747741_MORPHOMETRIC_ANALYSIS_OF_YAGACHI_CATCHMENT?_tp=eyJjb250ZXh0Ijp7ImZpcnN0UGFnZSI6InByb2ZpbGUiLCJwYWdlIjoicHJvZmlsZSJ9fQ
- Srivastava, A., Yetemen, O., Saco, P. M., Rodriguez, J. F., Kumari, N., & Chun, K. P. Influence of orographic precipitation on coevolving landforms and vegetation in semi?arid ecosystems. Earth Surface Processes and Landforms, 47(12), 2846-2862. (2022). https://doi.org/10.1002/esp.5427
CrossRef - Strahler, A.N., Quantitave geomorphology of drainage watersheds and channel networks In. Handbook of Applied Hydrology, McGraw Hill Book Company, New York, Section 4-II, (1964). [Google Scholar]
- Schumm, Stanley A. "Evolution of drainage systems and slopes in badlands at Perth Amboy, New Jersey." Geological society of America bulletin 67.5 (1956): 597-646. [Google Scholar]
CrossRef - Horton, R. E. (1945). Erosional development of streams and their drainage basins: Hydro-physical approach to quantitative morphology. Geological Society of America Bulletin, 56(3), 275–370. https://doi.org/10.1130/0016-7606(1945)56[275:EDOSAT]2.0.CO;2 [Crossref], [Web of Science ®], [Google Scholar]
CrossRef - Horton, R. E. (1932). Drainage basin characteristics. Transactions of American Geophysics Union, 31, 350–361. https://doi.org/10.1029/TR013i001p00350 [Crossref], [Google Scholar]
CrossRef - Zavoianu, I., Morphometo' of Drainage Basins, Elsevier Science, New York, 1985.
- V. C. Miller. The Journal of Geology. 1957;65(1):112-113. doi:https://doi.org/10.1086/626413
CrossRef - Magesh NS, Chandrasekar N, Soundranayagam JP. Morphometric evaluation of Papanasam and Manimuthar watersheds, parts of Western Ghats, Tirunelveli district, Tamil Nadu, India: a GIS approach. Environmental Earth Sciences. 2010;64(2):373-381. doi:https://doi.org/10.1007/s12665-010-0860-4
CrossRef - Prasad, R. K., Mondal, N. C., Banerjee, P., Nandakumar, M. V., & Singh, V. S. (2008). Deciphering potential groundwater zone in hard rock through the application of GIS. Environmental geology, 55(3), 467-475. https://link.springer.com/article/10.1007/s00254-007-0992-3[Google Scholar]
CrossRef - Setyawan, C., Lee, C. Y., &Prawitasari, M. (2019). Investigating spatial contribution of land use types and land slope classes on soil erosion distribution under tropical environment. Natural Hazards, 98(2), 697-718. https://scholar.google.com/scholar?output=instlink&q=info:1HF5ylqyUocJ:scholar.google.com/&hl=en&as_sdt=0,5&scillfp=16787823579593299445&oi=lle[Google Scholar]
CrossRef - Mr Resmi, C B, Achyuthan H. Quantitative analysis of the drainage and morphometric characteristics of the Palar River basin, Southern Peninsular India; using bAd calculator (bearing azimuth and drainage) and GIS. Geology, Ecology, and Landscapes. 2019;3(4):295-307. doi:10.1080/24749508.2018.1563750
CrossRef - Mahala, Avijit. "The significance of morphometric analysis to understand the hydrological and morphological characteristics in two different morpho-climatic settings." Applied Water Science 10.1 (2020): 1-16. https://doi.org/10.1007/s13201-019-1118-2
CrossRef - Soni, Sandeep. "Assessment of morphometric characteristics of Chakrar watershed in Madhya Pradesh India using geospatial technique." Applied Water Science 7 (2017): 2089-2102. DOI 10.1007/s13201-016-0395-2 [Google Scholar]
CrossRef - Strahler, A. N., Hypsometric (area-altitude) analysis of erosional topography, Geol. Soc. Am. Bull., 63, 1117-1142, 1952.Smith, Kenneth Grant. "Standards for grading texture of erosional topography." American journal of Science 248.9 (1950): 655-668. [Google Scholar]
CrossRef - Smith, Kenneth Grant. "Standards for grading texture of erosional topography." American journal of Science 248.9 (1950): 655-668. [Google Scholar]
CrossRef - Rai, Praveen Kumar, et al. "Hydrological inferences through morphometric analysis of lower Kosi river basin of India for water resource management based on remote sensing data." Applied water science 8 (2018): 1-16. https://doi.org/10.1007/s13201-018-0660-7
CrossRef - Srinivasa Vittala S, Govindaiah S, Honne Gowda H. Morphometric analysis of sub-watersheds in the pavagada area of Tumkur district, South India using remote sensing and gis techniques. J Indian Soc Remote Sens. 2004;32(4):351-362. doi:10.1007/BF03030860
CrossRef - Sreedevi, P. D., K. Subrahmanyam, and Shakeel Ahmed. "The significance of morphometric analysis for obtaining groundwater potential zones in a structurally controlled terrain." Environmental Geology 47 (2005): 412-420. https://link.springer.com/article/10.1007/s00254-004-1166-1[Google Scholar]
CrossRef - Singh, Gurdev D., James A. McNamara Jr, and Scott Lozanoff. "Morphometry of the cranial base in subjects with Class III malocclusion." Journal of dental research 76.2 (1997): 694-703.https://deepblue.lib.umich.edu/bitstream/handle/2027.42/67377/10.1177_00220345970760021101.pdf?sequence=2[Google Scholar]
CrossRef - Morisawa M, Clayton KM. Rivers: Form and Process. Longman; 1985.
CrossRef - Rakesh, K., et al. "GIS based morphometric analysis of Ajay river basin upto Srarath gauging site of South Bihar." Journal of Applied Hydrology 14.4 (2000): 45-54. [Google Scholar]
- Verstappen, H. Th. Applied geomorphology: geomorphological surveys for environmental development. No. 551.4 VER. 1983. [Google Scholar]
- S K NAG, SURAJIT CHAKRABORTY. Influence of Rock Types and Structures in the Development of Drainage Network in Hard Rock Area. Journal of the Indian Society of Remote Sensing. 2003;31(1):25-35.
CrossRef - Schmid, Bernhard H. "Critical rainfall duration for overland flow from an infiltrating plane surface." Journal of hydrology 193.1-4 (1997): 45-60. [Google Scholar]
CrossRef - S K NAG. Morphometric Analysis Using Remote Sensing Techniques in the Chaka Sub-basin, Purulia District, West Bengal. Journal of the Indian Society of Remote Sensing. 1998;26(1-2):69-76.
CrossRef - Moglen GE, Eltahir EAB, Bras RL. On the sensitivity of drainage density to climate change. Water Resour Res. 1998;34(4):855-862. doi:10.1029/97WR02709
CrossRef - Montgomery, D. R., & Dietrich, W. E. Source areas, drainage density, and channel initiation. Water resources research, 25(8), 1907-19. . (1989). https://proprights.org/PDFs/workshop_2011/References/Fluvial%20Geomorphology/Source%20Areas,%20Drainage%20Density,%20Channel%20Initiation-Montgomery-Dietrich-WRR%201989.pdf, [Google Scholar]
CrossRef - Joseph Markose V, Dinesh AC, Jayappa KS. Quantitative analysis of morphometric parameters of Kali River basin, southern India, using bearing azimuth and drainage (bAd) calculator and GIS. Environmental Earth Sciences. 2014;72(8):2887-2903. doi:https://doi.org/10.1007/s12665-014-3193-x.
CrossRef - Bogale, A. G., Adem, A. A., Mekuria, W., & Steenhuis, T. S. Application of geomorphometric characteristics to prioritize watersheds for soil and water conservation practices in the Lake Tana Basin, Ethiopia. Geocarto International, 38(1), 2184502. (2023). https://doi.org/10.1080/10106049.2023.2184502
CrossRef - Abboud, I. A., & Nofal, R. A. Morphometric analysis of wadi Khumal basin, western coast of Saudi Arabia, using remote sensing and GIS techniques. Journal of African Earth Sciences, 126, 58-74. (2017). http://dx.doi.org/10.1016/j.jafrearsci.2016.11.024
CrossRef - Lee, S., Lee, S., Lee, M. J., & Jung, H. S. Spatial assessment of urban flood susceptibility using data mining and geographic information System (GIS) tools. Sustainability, 10(3), 648. (2018).
CrossRef - Kumar Avinash, K.S. Jayappa, B. Deepika."Prioritization of sub-basins based on geomorphology and morphometricanalysis using remote sensing and geographic informationsystem (GIS) techniques",Geocarto International, (2011). http://dx.doi.org/10.1080/10106049.2011.606925
CrossRef


