Effect of Physico-Chemical Parameters and Inorganic Nutrient Ions in Relation with Seasonal Algal Diversity of River Ichhamati, West Bengal, India.
Monojit Ray1
 and Suraj SK2
*
and Suraj SK2
*
1
Department of Chemistry,
Barrackpore Rastraguru Surendranath College,
North, 24 Parganas,
West Bengal
India
2
Department of Botany,
Barrackpore Rastraguru Surendranath College,
North, 24 Parganas,
West Bengal
India
http://dx.doi.org/10.12944/CWE.18.3.09
Copy the following to cite this article:
Ray M, Suraj S. K. Effect of Physico-Chemical Parameters and Inorganic Nutrient Ions in Relation with Seasonal Algal Diversity of River Ichhamati, West Bengal, India. Curr World Environ 2023;18(3). DOI:http://dx.doi.org/10.12944/CWE.18.3.09
Copy the following to cite this URL:
Ray M, Suraj S. K. Effect of Physico-Chemical Parameters and Inorganic Nutrient Ions in Relation with Seasonal Algal Diversity of River Ichhamati, West Bengal, India. Curr World Environ 2023;18(3).
Download article (pdf) Citation Manager Publish History

Introduction
River always plays a vital role sustaining life of any civilisation as it is a prime sector of economy. River is an important source to maintain ecosystem1. Ichhamati River make its way through India and Bangladesh and also acts as a border between India and Bangladesh2. Ichhamati travels a distance of nearly 216 km and finally meet with Kalindi river at Hasnabad , North 24 Parganas and finally ends in Bay of Bengal in Moore Island of West Bengal3. Ichhamati is a branch of Mathabhanga river bifurcates into two branches Ichhamati and Churni at Majdia of Nadia district in West Bengal. Range of algal diversity is wide from lentic to lotic ecosystem4. Seasonal variation in algal growth in aquatic environment is acquired due to change in nutritional, temperature, light, grazing pressure level throughout a year5. Aquatic fauna such as fishes, snails, crabs and others finds a main source of their food from phytoplanktons such as algae. Phytoplanktons present at the base level in aquatic ecosystem forms major source of carbon6. Depending on water quality algae forms main connection between food chain and its productivity7. To asses water quality and its to understand its basic nature study of algal diversity play a major role 8 -,11. Physico-chemical parameters like pH, salinity, turbidity, Conductivity etc. plays an important role in living organism of free flowing aquatic ecosystem12-16. Inorganic nutrient ions are important factor for the growth and development of phytoplanktons such as algae17-19. Sodium, potassium and calcium ions are the bulk metal ions of living system. Presence of high calcium ion concentration leads to high rate of bio-mineralisation. In natural aquatic ecosystems, nitrogen, phosphorus etc. often occurs at low concentrations, which are limiting for the growth of algae 21-22.
This study is undertaken to evaluate seasonal algal composition of river Ichhamati water in different seasons such as autumn, winter, spring, summer and Rainy season in relation to some physico-chemical parameters and biologically significant inorganic ions. The present study also evaluate presence of available algae act as a source of food for fishes in this river.
Methodology and Material
Study Location
Algae and water has been sampled from 7 sampling points (marked in orange circle) in Taki and Hasnabad namely Taki HWGP near BSF camp (22.576971, 88.936438) Taki Ecopark (22.576271, 88.938695), Taki HWQP (22.589497, 88.938607), Rajnagar (22.567804, 88.926102), Angnara (22.566387, 88.915240), Hasnabad (22.578140, 88.936522), Hasnabad Bon Bibi Bridge (22.565896, 88.912292) of North 24 Parganas, West Bengal, India. and circled them in orange in google map given below.
Sampling site Abbreviation:
L1 = Taki HWGP near BSF camp, L2= Taki Ecopark, L3 = Taki HWQP, L4 = Rajnagar, L5 = Angnara, L6 = Hasnabad, L7 = Hasnabad Bon Bibi Bridge
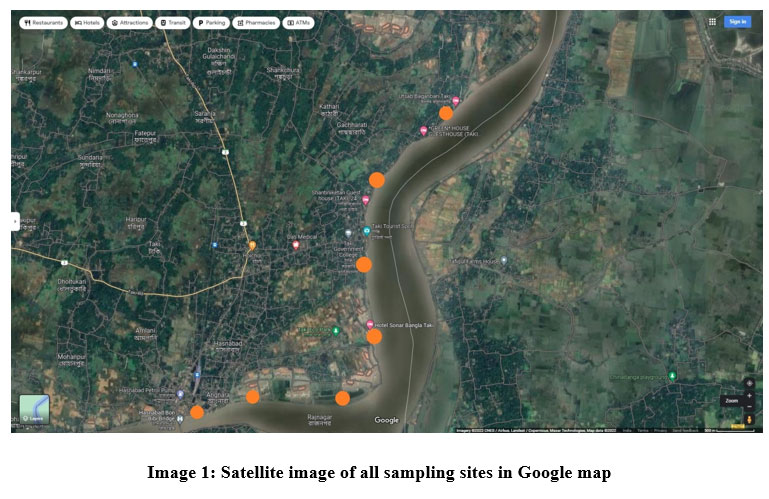 | Image 1: Satellite image of all sampling sites in Google map
|
Water sampling and Analysis
River water taken in the month of October - December 2021, January, February, March, May, July and August of 2022 frequently from Ichhamati. Water collected from river were analyzed through Titrimetry method, Flame photometry and spectrophotometric and other methods. On site analysis of pH, Conductivity, Temperature, Total Dissolve Solid, DO, Salinity were made by using proper scientific instruments. After collecting river water preserved in sterile Polyethylene sampling bottles and Turbidity, Total Alkalinity, Na+ and K+, Ca+ and NO3- ions analyzed by using proper scientific instruments and Titrimetric method. All instrumental and titrimetric methods were done at Laboratory.
Algal Sampling
Benthic algae grown on the hard surface of rock collected by using of spatula, scalpel, small knife by scraping algae from hard surface and kept in small jar of polyethylene. With the help of pipette algal specimen collected from soft muddy surface and kept in polyethylene bottle. Some floating algal specimen were collected from water surface by using fine meshed dip nets and with the help of hand and kept for preservation polyethylene sterile bottle. Plankton nets with 50µm mesh size are used for collection of phytoplankton from water. After collecting, specimens were preserved with 3% Formaldehyde solution. Standard microscopic methods were applied for observation of algal specimen. Identification of algal specimen made with proper literature 23-26.
Result
Water from 7 study locations of Ichhamati River were taken in every season i.e., during autumn, winter, spring, summer and monsoon. Physico-chemical parameters and biologically significant nutrient ions are measured. 3 replicas of each parameter have taken. Replicas were taken from same place but from three different spots keeping distance at least 300 meters. IBM SPSS 20 Software and PAST Softare used in this study for statistical analysis and presented in tables below.
Table 1: Data of Physico-chemical Parameters in River Ichhamati.
Parameters | Sites | Autumn
| Winter
| Spring
| Summer
| Monsoon
|
Water Temperature (0C) | L1
L2
L3
L4
L5
L6
L7 | 29.45 ± 1.20 29.40 ± 0.69 29.50 ± 0.42 28.80 ± 0.84 29.8 ± 0.70 30.1± 0.13 29.45± 0.91 | 23.9 ± 3.25 24.05 ± 3.60 23.9 ± 3.25 23.5 ± 3.95 23.2 ± 4.24 23.75 ± 3.74 23.5 ± 3.67 | 25.35 ± 5.02 25.75 ± 4.87 25.45 ± 5.30 25.5 ± 4.66 25.55 ± 4.73 25.45 ± 5.16 25.3 ± 5.23 | 30.66 ± 0.40 31 ± 0.5 30.66 ± 0.40 30.8 ± 0.45 30.83 ± 0.70 30.86 ± 0.30 30.7 ± 0.36
| 30.06 ± 0.75 30.13 ± 0.95 29.86 ± 1.05 29.73 ± 0.09 30.16 ± 0.96 30.06 ± 0.94 29.93 ± 0.15 |
pH | L1
L2
L3
L4
L5
L6
L7 | 7.79 ± 0.12 7.93 ± 0.24 8.0 ± 0.14 7.65 ± 0.07 7.76 ± 0.05 7.67 ± 0.03 7.85 ± 0.07 | 7.90 ± 0.00 7.84 ± 0.05 7.80 ± 0.00 7.77 ± 0.03 7.65 ± 0.11 7.70 ± 0.00 7.82 ± 0.10 | 7.97 ± 0.10 8.01 ± 0.12 7.92 ± 0.18 7.82 ± 0.03 7.85 ± 0.07 7.90 ± 0.00 8.00 ± 0.07 | 7.96 ± 0.07 7.98 ± 0.10 7.92 ± 0.15 7.85 ± 0.05 7.86 ± 0.09 7.92 ± 0.02 7.95 ± 0.10 | 7.95 ± 0.14 8.05 ± 0.04 8.03 ± 0.07 7.81 ± 0.10 7.84 ± 0.05 7.86 ± 0.06 7.93 ± 0.02 |
Conductivity (µS/cm) | L1
L2
L3
L4
L5
L6
L7 | 815 ± 7.07 808.5 ± 4.94 822.5 ± 3.53 823 ± 4.24 812.5 ± 3.53 815 ± 7.07 822.5 ± 3.53 | 855 ± 7.07 866 ± 8.48 862.5 ± 3.53 853 ± 4.24 847.5 ± 3.53 836.5 ± 2.12 844 ± 5.65 | 1625 ± 7.07 1613 ± 4.24 1652 ± 2.82 1609 ± 1.41 1597.5 ± 3.53 1617.5 ± 3.53 1607.5 ± 3.53 | 15673.33 ± 579.77 15473.33 ± 231.15 16026.67 ± 690.60 15673.33 ± 219.39 15633.33 ± 115.03 15723.33 ± 142.24 15776.67 ± 279.70 | 15720 ± 450.77 15860 ± 246.37 15750 ± 186.81 15316.67 ± 116.76 15240 ± 121.65 15373.33 ± 230.28 15450 ± 43.58 |
Salinity (ppm) | L1
L2
L3
L4
L5
L6
L7 | 407.5 ± 3.53 412.5± 3.53 400.5 ± 6.36 408.5 ± 4.95 393 ± 4.24 416 ± 5.65 398.5 ± 4.94 | 415 ± 7.07 408.5 ± 4.94 409 ± 1.51 406.5 ± 2.12 398.5 ± 4.94 424 ± 5.65 418.5 ± 4.94 | 945 ± 7.07 941 ± 5.65 937.5 ± 3.53 932.5 ± 3.53 932.5 ± 3.53 927.5 ± 3.53 933.5 ± 2.12 | 10886.66 ± 80.82 14096.66 ± 25.16 10140 ± 52.91 11548.33 ± 12.58 10533.33 ± 30.55 10550 ± 30.00 10532.33 ± 9.29 | 9483.33 ± 47.25 9539 ± 24.75 9423.33 ± 25.16 9581.66 ± 14.43 9443.33 ± 11.54 9856.66 ± 25.16 9136.66 ± 37.85 |
TDS (ppm) | L1
L2
L3
L4
L5
L6
L7 | 595 ± 7.07 581.5 ± 12.02 595 ± 7.07 577.5 ± 10.60 585± 7.07 577.5± 3.53 587.5± 10.60 | 611 ± 1.41 620.5 ± 7.77 615 ± 7.07 620 ± 7.07 617.5± 10.60 622.5± 3.53 617.5± 3.53 | 5720 ± 113.13 5703 ± 117.37 5886 ± 50.91 5770 ± 70.71 5696± 79.19 5905.5± 43.13 5696± 93.33 | 17533.33± 23.04 16656± 36.67 18457.33± 4.61 17830.33± 4.50 16958± 32.74 18450.33± 42.92 16460± 15.62 | 16417.66± 6.80 16407.33± 75.63 16338.33± 12.58 16425.33± 5.03 16236.66± 46.18 15948.33± 37.52 16330± 10 |
DO (ppm) | L1
L2
L3
L4
L5
L6
L7 | 7.35± 0.21 7.15± 0.07 7.2± 0 7.45± 0.49 7.45± 0.21 7.35± 0.35 7.45± 0.35 | 6.85± 0.07 6.85± 0.21 7.20± 0.28 7.20± 0.28 6.85± 0.07 6.80± 0.14 7.05± 0.07 | 7.95± 0.07 8.05± 0.07 8.05± 0.07 7.35± 0.35 7.95± 0.07 8.05± 0.07 8.05± 0.07 | 7.03± 0.15 7.06± 0.35 7.16± 0.05 7.20± 0.34 6.96± 0.11 7.00± 0.17 7.16± 0.30 | 7.63± 0.15 7.46± 0.11 7.56± 0.11 7.23± 0.15 7.4± 0.1 7.4± 0.2 7.36± 0.37 |
BOD (ppm) | L1
L2
L3
L4
L5
L6
L7 | 2.5± 0.14 2.4± 0 2.5± 0.14 2.3± 0.28 2.5± 0.42 2.3± 0.14 2.35± 0.07 | 2.4± 0.00 2.4± 0.00 2.50± 0.28 2.55± 0.07 2.25± 0.21 2.3± 0.00 2.3± 0.00 | 1.35± 0.07 1.5± 0.28 1.70± 0.00 1.75± 0.21 1.95± 0.21 1.45± 0.21 1.50± 0.28 | 3.16± 0.11 3.13± 0.20 3.00± 0.10 3.06± 0.05 3.03± 0.15 2.73± 0.15 3.06± 0.15 | 2.60± 0.10 2.6± 0.1 2.36± 0.05 2.53± 0.37 2.5± 0.26 2.43± 0.15 2.46± 0.05 |
Hardness (ppm) | L1
L2
L3
L4
L5
L6
L7 | 167.57 ± 3.57 166.05± 8.48 167.7± 9.12 165.77± 7.74 167.32± 7.45 166.67± 7.67 167.37± 10.07 | 234.61± 8.05 234.58± 6.30 234.8± 7.02 235.35± 8.30 235.06± 6.93 234.43± 6.67 235.71± 7.64 | 484.76± 14.15 804.81± 53.52 761.5± 3.11 868.78± 2.30 862.86± 9.40 825.11± 3.06 847.12± 3.46 | 1915.22± 92.35 2100.75± 46.34 2017.78± 2.48 1942.6± 3.12 1997.78± 8.97 2049.55± 7.73 1943.95± 4.39 | 1047.34± 56.49 1047.51± 51.98 1048.14± 60.10 1050.39± 2.71 1044.80± 9.51 1051.83± 4.20 1043.19± 5.64 |
Total Alkalinity (ppm) | L1
L2
L3
L4
L5
L6
L7 | 137.5± 10.60 134.5± 10.60 136.5± 6.26 131± 5.55 137.5± 10.60 134.5± 3.43 137± 5.55 | 170± 14.14 173.50± 12.02 171± 8.41 172.50± 13.43 173± 12.72 170.50± 7.77 171.50± 12.02 | 107± 1.41 103.50± 3.53 103± 1.41 107.50± 0.70 105± 0.00 102± 0.00 106± 0.00 | 126.66± 7.63 130± 8.00 131.33± 9.45 133.33± 11.71 136± 10.58 135.33± 11.71 133.66± 8.50 | 144.33± 9.29 143.33± 6.42 143.33± 7.02 141.33± 10.26 145.33v 9.86 144± 5.29 145± 8.88 |
Carbonate Alkalinity (ppm) | L1
L2
L3
L4
L5
L6
L7 | 14± 0.82 12.5± 2.12 14± 2.65 11± 1.24 14± 1.41 11± 1.41 13± 1.41 | 12± 2.82 13± 2.05 11± 1.41 12± 0.00 13± 1.41 13± 1.41 12.50± 0.70 | 10± 0 11± 1.41 11± 1.41 9± 1.41 10± 2.82 10± 0 8± 0 | 11± 1.41 11± 1.41 11± 1.41 11± 1.41 12± 0 11± 1.41 9± 1.41 | 9.33± 1.15 10± 2 9.33± 3.05 7.66± 0.51 9± 3.60 10± 2 8.66± 1.05 |
Bicarbonate Alkalinity (ppm) | L1
L2
L3
L4
L5
L6
L7 | 123.5± 7.77 122± 8.48 122.5± 10.60 121 ± 12.72 123.5 ± 9.19 123.5 ± 12.02 124 ± 14.14 | 157± 15.55 158.50± 13.43 159± 8.48 159.50 ± 12.02 160 ± 14.14 157.50 ± 9.10 159 ± 12.72 | 97± 1.41 93.50± 3.53 92± 2.82 96.50 ± 0.70 96 ± 1.41 93 ± 1.41 97 ± 1.41 | 115.33± 7.50 118± 10 120± 9.16 122.66 ± 11.47 122 ± 10.39 124 ± 12.16 124.33 ± 8.62 | 135± 10.44 133.33± 7.02 134± 10 133.66 ± 11.50 136.33 ± 11.59 133.33 ± 8.32 136.33 ± 9.50 |
Turbidity (NTU) | L1
L2
L3
L4
L5
L6
L7 | 315 ± 9.49 316 ± 9.59 312 ± 9.59 312 ± 22.62 304 ± 28.28 304 ± 6.76 310 ± 11.31 | 188.33 ± 7.09 185.33 ± 15.27 183.66 ± 3.31 186.66 ± 16.07 184.66 ± 14.57 182.33 ± 10.11 180 ± 5.62 | 340.5 ± 7.28 330 ± 72.53 356 ± 6.47 356 ± 17.78 348 ± 20.81 337 ± 30.91 353 ± 62.23 | 944 ± 9.39 872.5 ± 24.34 883 ± 9.89 883 ± 26.87 894.5 ± 28.99 887 ± 9.89 864 ± 31.11 | 816.33 ± 29.50 812 ± 43.48 820 ± 44.68 809 ± 28.29 817.33 ± 25.08 801 ± 34.84 803.66 ± 41.51 |
Data presented here as Mean ± Standard Deviation
Table 2: Average concentration of inorganic nutrient ions of Ichhamati River Water
Parameters | Sites | Autumn
| Winter
| Spring
| Summer
| Monsoon |
Sodium (ppm) | L1
L2
L3
L4
L5
L6
L7 | 104.34 ± 2.80 103.56 ± 0.97 102.26 ± 1.44 105.82 ± 2.02 101.43 ± 1.68 102.74 ± 3.87 102.24 ± 1.41 | 94.78 ± 6.47 93.53 ± 7.41 96.41 ± 2.01 95.76 ± 4.71 98.05 ± 0.57 97.48 ± 1.92 98.15 ± 2.68 | 385.37 ± 7.11 376.11 ± 2.28 375.61 ± 6.49 380.16 ± 6.39 370.22 ± 0.03 375.24 ± 0.85 375.14 ± 3.98 | 1707.33 ± 15.50 1560.33 ± 6.70 1788.66 ± 8.50 1560.66 ± 9.01 1670 ± 11.13 1569.33 ± 9.01 1566.66 ± 15.27 | 1770 ± 10.00 1772 ± 13.85 1892.33 ± 2.51 1794.66 ± 4.14 1875.66 ± 12.02 1743.33 ± 6.11 1788.33 ± 7.63 |
Potasium (ppm) | L1
L2
L3
L4
L5
L6
L7 | 14.33 ± 0.44 11.30 ± 0.33 12.51 ± 0.12 10.57 ± 0.45 13.70 ± 0.07 11.36 ± 0.22 12.59 ± 0.06 | 7.35 ± 0.48 7.28 ± 0.30 7.22 ± 0.02 7.67 ± 0.38 7.40 ± 0.42 7.07 ± 0.03 7.30 ± 0.14 | 23.51 ± 0.70 23.46 ± 0.51 23.65 ± 0.07 23.16 ± 1.15 23.22 ± 0.24 23.93 ± 0.16 23.81 ± 0.09 | 944.85 ± 20.13 940.18 ± 18.32 940.95 ± 17.81 938.39 ± 25.59 937.36 ± 19.99 942 ± 21.76 942.69 ± 20.05 | 976.43 ± 12.30 973.10 ± 11.38 972.1 ± 7.66 973.9 ± 5.77 978.73 ± 7.97 976.23 ± 9.74 974.46 ± 5.27 |
Calcium (ppm) | L1
L2
L3
L4
L5
L6
L7 | 432.50± 10.60 429 ± 1.41 421.50 ± 6.36 426.50 ± 10.60 420.50 ± 0.70 430 ± 7.07 422.50 ± 9.19 | 57.50 ± 3.53 50.50 ± 6.36 51 ± 5.61 58 ± 4.24 46.50 ± 7.77 50.50 ± 6.36 53.50 ± 3.53 | 63 ± 4.26 62.50 ± 0.70 60.50 ± 3.53 57.50 ± 4.94 64.50 ± 4.94 64 ± 2.82 63 ± 4.24 | 106.66 ± 3.05 106.66 ± 4.16 105.33 ± 4.50 106 ± 3.60 106.66 ± 3.05 107.66 ± 3.08 106.66 ± 4.16 | 428.33 ± 6.07 421.66 ± 9.07 424.66 ± 3.31 423 ± 7.21 426.66 ± 10.21 432.33 ± 12.42 427.33 ± 11.01 |
Nitrate (ppm) | L1
L2
L3
L4
L5
L6
L7 | 1350 ± 14.14 1320 ± 7.07 1280 ± 14.14 1287.50 ± 10.60 1304 ± 8.48 1329 ± 15.55 1321 ± 12.72 | 385 ± 7.07 387.50 ± 10.60 338.50 ± 2.12 360 ± 14.14 355.50 ± 9.19 360 ± 7.07 344 ± 5.65 | 3546.50 ± 30.40 3591 ± 72.83 3675 ± 21.21 3631 ± 12.72 3702 ± 10.60 3586 ± 5.65 3538 ± 11.31 | 1362.66 ± 75.79 1477.66 ± 18.82 1489.66 ± 20.50 1425.33 ± 27.02 1480 ± 13.13 1413.33 ± 9.86 1469.33 ± 16.77 | 1632 ± 26.96 1646.66 ± 6.35 1646 ± 4.00 1637 ± 4.35 1656.66 ± 5.77 1672.33 ± 21.54 1652 ± 37.24 |
Carbonate (ppm) | L1
L2
L3
L4
L5
L6
L7 | 7.15 ± 0.07 6.45 ± 0.63 6.7 ± 0.28 6.6 ± 0.4 6.8 ± 0 6.35 ± 0.21 6.9 ± 0.14 | 6.73 ± 0.64 6.93 ± 0.30 7.2 ± 0.36 6.93 ± 0.45 7.16 ± 0.20 7.06 ± 0.20 7.06 ± 0.47 | 6.6 ± 0.56 6.5 ± 0 6.3 ± 0.28 6.5 ± 0.42 6.4 ± 0.14 6.55 ± 0.49 6.55 ± 0.21 | 6.46 ± 0.46 6.30 ± 0.26 6.50 ± 0.10 6.53 ± 0.25 6.20 ± 0.36 6.46 ± 0.40 6.36 ± 0.41 | 4.36 ± 0.25 4.46 ± 0.15 4.70 ± 0.36 4.56 ± 0.50 4.53 ± 0.37 4.50 ± 0.36 4.46 ± 0.32 |
Bicarbonate (ppm) | L1
L2
L3
L4
L5
L6
L7 | 159.40 ± 1.55 160 ± 2.54 159.70 ± 7.35 158.55 ± 4.17 157.35 ± 9.68 158.50 ± 5.93 158.85 ± 5.58 | 202.45 ± 11.24 198.75 ± 3.60 200.80 ± 1.97 199.95 ± 2.33 203.10 ± 7.77 204.80 ± 7.91 205.75 ± 9.68 | 189.17 ± 10.8 185.76 ± 6.70 185.30 ± 5.37 186.63 ± 6.73 188.82 ± 9.58 190.25 ± 11.38 190.62 ± 13.96S | 155.31 ± 13.29 155.60 ± 9.54 163.50 ± 5.59 162.98 ± 7.20 161.56 ± 3.61 159.05 ± 4.13 159.91 ± 3.99 | 172.03 ± 7.55 170.26 ± 2.95 170.25 ± 6.78 170.42 ± 5.21 171.30 ± 4.81 170.76 ± 7.05 170.58 ± 5.13 |
Data presented here as Mean ± Standard Deviation
Table 3: Algal species of River Ichhamati
Algae | Autumn | Winter | Spring | Summer | Monsoon |
Volvox sp (V) | + | + | - | + | + |
Klebsormidium sp (Kl) | ++ | + | ++ | + | ++ |
Spirogyra sp (Sp) | ++ | ++ | ++ | ++ | +++ |
Zygnema sp (Zy) | + | ++ | ++ | + | + |
Chlorococcum sp (Ch) | + | ++ | + | + | ++ |
Stigeoclonium sp (St) | + | + | - | - | + |
Chlorella vulgaris (Cv) | + | + | ++ | ++ | ++ |
Ulothrix sp (Ul) | + | ++ | ++ | + | + |
Pithophora sp (Pi) | ++ | + | + | + | ++ |
Cladophora sp (Cl) | + | ++ | ++ | + | ++ |
Oedogonium sp (Oe) | ++ | ++ | ++ | + | + |
Monoraphidium sp (Mo) | + | + | - | - | + |
Microspora sp (Mi) | ++ | ++ | + | - | ++ |
Rhizoclonium sp (Rh) | + | + | + | + | + |
Nostoc sp (No) | + | + | ++ | ++ | ++ |
Microcoleus paludosus (Mp) | ++ | ++ | + | ++ | ++ |
Oscillatoria sp (Os) | + | + | ++ | ++ | ++ |
Microcystis sp (Mic) | + | + | ++ | ++ | + |
Anabaena cylindrica (An) | ++ | ++ | ++ | ++ | ++ |
Lyngbya sp (Ly) | ++ | + | ++ | ++ | ++ |
Anabaena azollae (Aa) | ++ | + | ++ | ++ | ++ |
Nitzschia sp (Ni) | ++ | ++ | ++ | + | + |
Navicula sp (Na) | ++ | ++ | ++ | + | + |
Fragilaria sp (Fr) | + | + | + | + | ++ |
Pinnularia viridis (Fr) | ++ | ++ | ++ | + | ++ |
Aulacosiera sp (Pv) | + | + | + | + | + |
Ulnaria ulna (Ul) | + | + | + | - | + |
Coscinodiscus sp (Co) | ++ | ++ | ++ | +++ | ++ |
Surirella elegans (Su) | ++ | + | + | - | + |
Cymbella sp (Cy) | ++ | ++ | - | - | + |
+++ = Abundant, ++ = Dominant, + = Rare, - = Absent, (Algal species Abbreviation used for Canonical Correspondence Analysis)
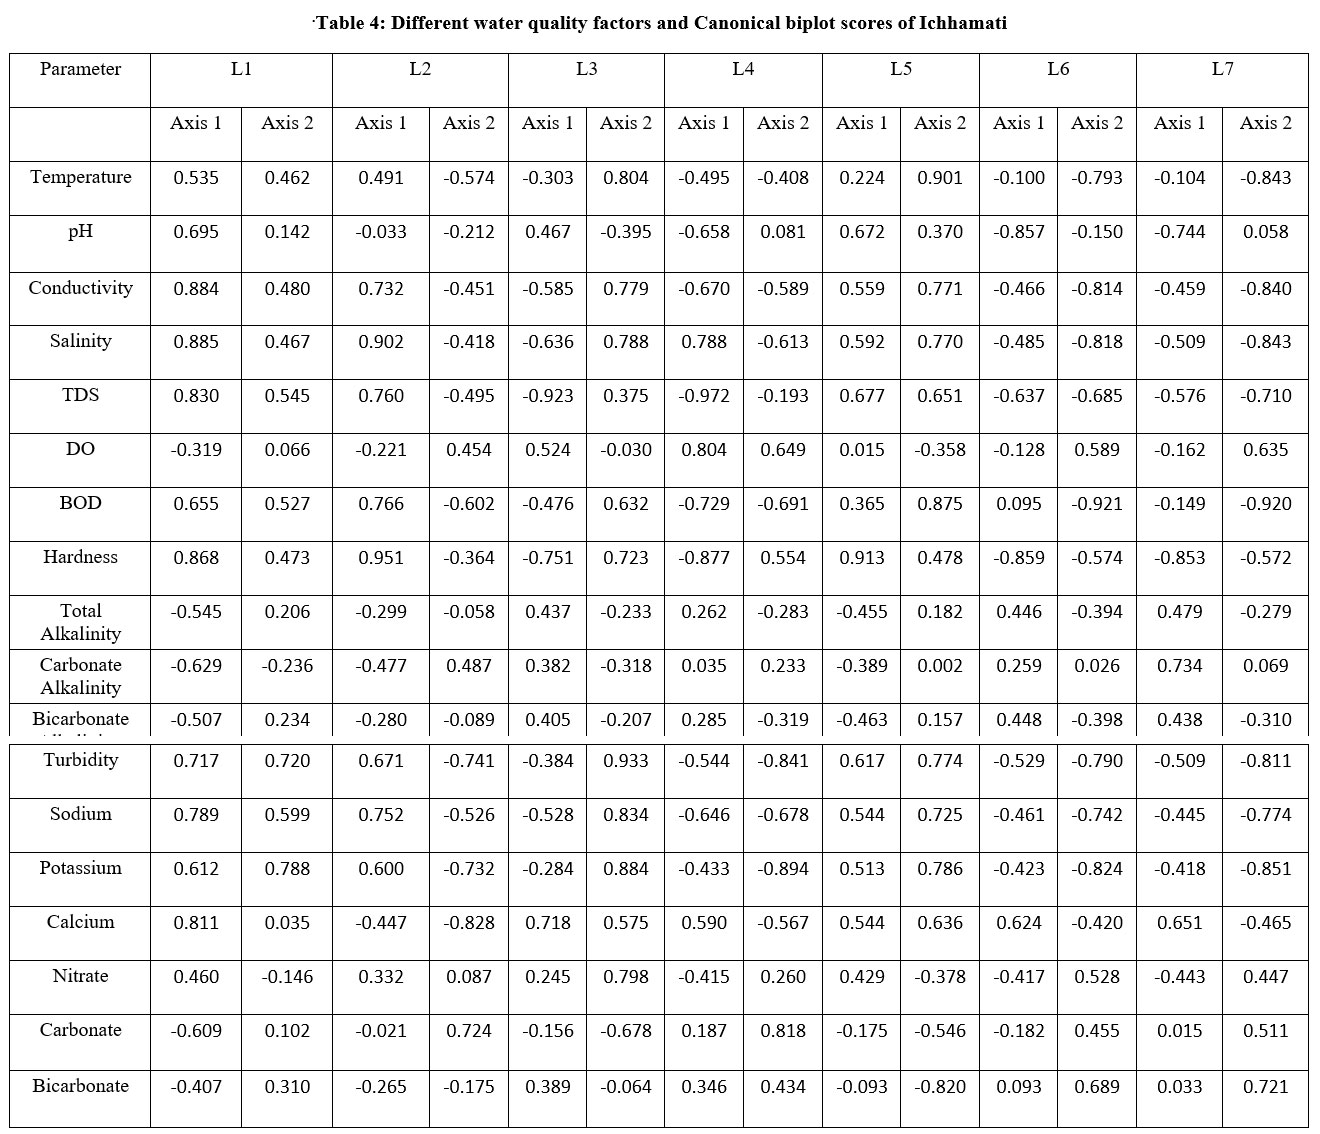
Statistical correlation (Canonical Correspondence Analysis) between algae and essential water quality factors:
One most important statistical method is CCA for understanding relationship between essential water quality factors and species, has been applied in this study for determining relationships between Physico-chemical parameter and algae. The triplet length of the graph gives an indication regarding effect of parameters and showed positive or negative relationship with axis 27-28.
 | .Table 4: Different water quality factors and Canonical biplot scores of Ichhamati .
|
Table 5: Eigen value & % of variance of water quality factors at 7 sites of river Ichhamati
| L1 | L2 | L3 | L4 | L5 | L6 | L7 | |||||||
| Axis | Axis | Axis | Axis | Axis 1 | Axis | Axis | Axis | Axis | Axis | Axis | Axis | Axis | Axis |
Eigenvalue | 0.102 | 0.051 | 0.078 | 0.057 | 0.088 | 0.044 | 0.070 | 0.037 | 0.067 | 0.041 | 0.066 | 0.028 | 0.063 | 0.029 |
% of variance | 48.63
| 24.49 | 42.02 | 30.58 | 47.05 | 23.86 | 50.04 | 26.72 | 47.18 | 28.91 | 49.82 | 21.76 | 49.12 | 22.61 |
CCA of all the 7 sampling locations has been drawn between 18 water quality factors and 30 algae. Overall dominant algal species throughout all seasons are Klebsormidium sp, Spirogyra sp, Chlorella vulgaris, Cladophora sp, Microcoleus paludosus, Anabaena cylindrica , Anabaena azollae, Nitzschia sp, Coscinodiscus sp, Pinnularia viridis.
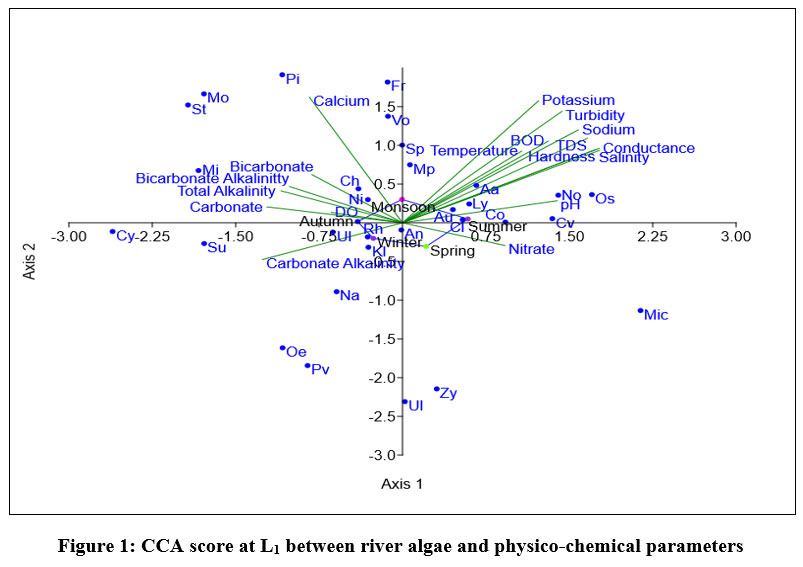
Eigen value of L1, shown in fig-1 for axix 1 is 0.10263 explained 48.63% correlation and for axis 2 is 0.051689 showed 24.49% correlation between 18 parameters and dominant species of algae. Volvox, Spirogyra, Fragilaria, Microcoleus paludosus were positively correlated with axis 1. During monsoon and summer Oscillatoria sp, Anabaena azollae, Lyngbya sp, Aulacosiera sp, Nostoc sp showed positive correlation with Temperature, BOD, pH, TDS, Salinity, Conductivity, Hardness, K+ and Na+ ion concentration. Positive correlation observed during spring between Microcystis sp, Zygnema sp, and Nitrate ion concentration. Anabaena cylindrica is least affected by physico-chemical parameters.
 | Figure 1: CCA score at L1 between river algae and physico-chemical parameters
|
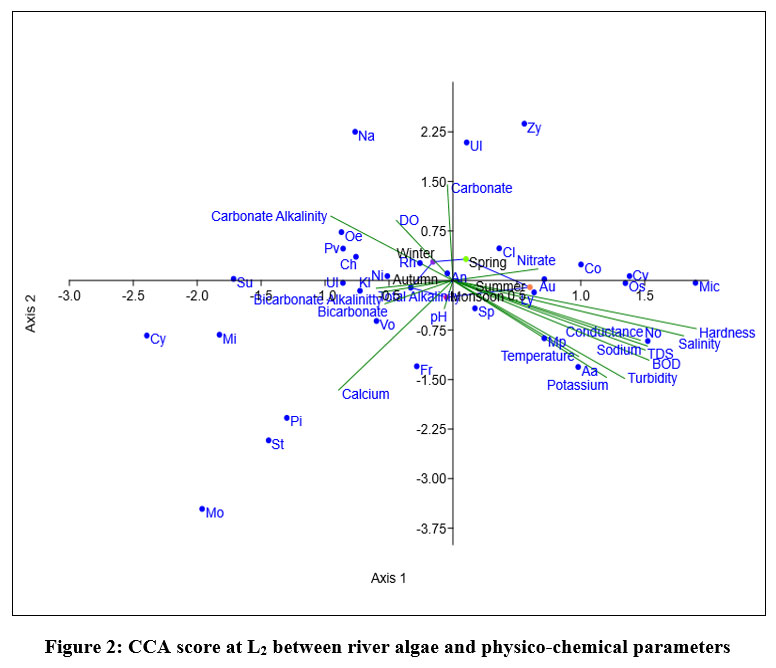
Eigen value of L2, shown in fig-1 for axix 1 (0.078596) showed 42.02% correlation and axis 2 (0.057201) showed 30.58% correlation between variables and dominant aalgl species. Ulothrix, Zygnema, Cladophora sp, were positively correlated with axis 1. During monsoon and summer Oscillatoria sp, Micocystis sp, Anabaena azollae, Lyngbia sp, Aulacosiera sp, Nostoc sp positively correlated with Temperature, BOD, Turbidity, TDS, Salinity, Conductivity, Hardness, K+ and Na+ ion concentration. During spring Coscinodiscus sp, Zygnema sp, Cladophora sp showed positive correlation with Nitrate ion concentration. physico-chemical parameters has least impact on growth of Anabaena cylindrica showed least affected by followed by Spirogyra sp.
 | Figure 2: CCA score at L2 between river algae and physico-chemical parameters.
|
Eigen value of L3, shown in fig-3 for axix 1 is 0.088289, made 47.05% correlation and axis 2 is 0.044775 showed 23.86% relationship between 18 variables and dominant species of algae. During monsoon and autumn Volvox sp, Pithophora sp, Stigeoclonium sp, Monoraphidium sp, Fragilaria sp, Spirogyra sp. showed positive correlation with calcium ion concentration. Close relation between pH and total alkalinity indicates the river water is alkaline. Zygnema, Ulothrix, Navicula positively correlated with carbonate ion concentration during winter. During spring and summer Oscillatoria sp, Micocystis sp, Coscinodiscus, Chlorella vulgaris Lyngbia sp, Aulacosiera sp, Nostoc sp showed positive correlation with Temperature, BOD, Turbidity, TDS, Salinity, Conductivity, Hardness, K+, nitrate and Na+ ion concentration. Oedogonium sp, Cymbella sp, Microspora sp, Surirella elegans showed positive correlation with total alkalinity, carbonate and bicarbonate alkalinity. Physico-chemical parameters have least affect on diversity of Anabaena cylindrical, Klebsormidium, Chlorococcum, Microcoleus paludosus.
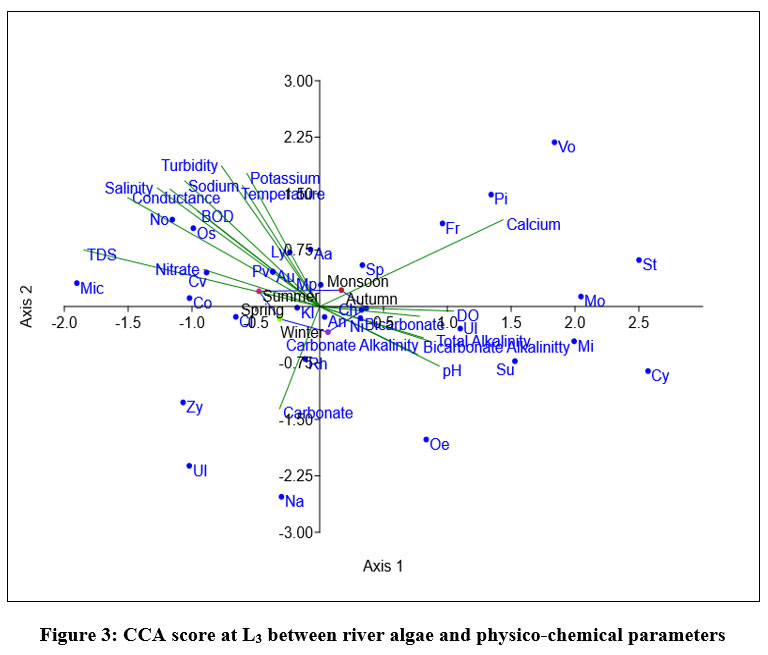 | Figure 3: CCA score at L3 between river algae and physico-chemical parameters
|
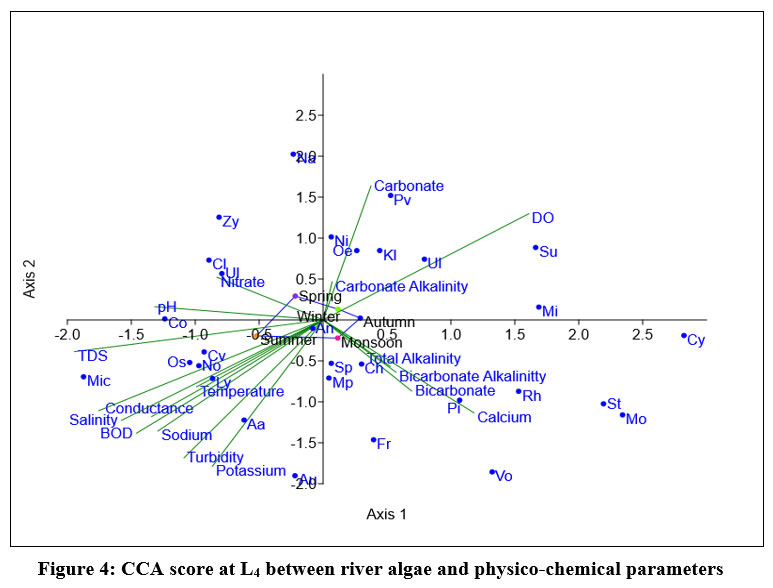
Eigen value of L4, shown in fig-1 for axis 1 (0.070942) showed 50.04% relationship and axis 2 (0.037878) explained 26.72% relationship between 18 variables and dominant algae. Nitzschia, Navicula, Aulacosiera sp, are in positive correlation with axis 1.During summer Anabaena azollae, Oscillatoria sp, Micocystis sp, Chlorella vulgaris Lyngbia Nostoc showed positive with Temperature, BOD, Turbidity, TDS, Salinity, Conductivity, Hardness, potassium, and sodium ion concentration. Cladophora sp, Zygnema sp, Ulnaria ulna showed positive correlation with nitrate ion concentration and pH. During monsoon spiceses of Spirogyra, Stigeoclonium, Monoraphidium, Rhizoclonium Pithophora, Volvox, Fragilaria, Chlorococcum has a close effect with Total alkalinity, Bicarbonate alkalinity, Calcium and bicarbonate ion concentration. Nitzschia sp, Pinnularia viridis, Surirella elegans, Microspora sp, Oedogonium sp, Ulothrix, Klebsormidium sp showed positive correlation with Dissolve oxygen, Carbonate alkalinity and carbonate ion concentration. Physico-chemical parameters has least impact on growth of Anabaena cylindrica
 | Figure 4: CCA score at L4 between river algae and physico-chemical parameters.
|
Eigen value of L5, shown in fig-3 for axix 1 is (0.067044) made 47.18% correlation and axis 2 (0.041078) showed 28.91% relationship between 18 variables and dominant species of algae. Fragilaria sp are in positive correlation with axis 1. During summer Nostoc sp, Aulocosira sp, Chlorella vulgaris, Anabaena azollae, Oscillatoria sp, Coscinodiscus sp, Lyngbya sp positively correlaaated with Temperature, BOD, Turbidity, TDS, Salinity, Conductivity, Hardness, pH, potassium, calcium and sodium ion concentration. Microcystis sp, Cladophora showed positive correlation with nitrate ion concentration during spring. During monsoon Monoraphidium sp, Pithophora sp, Stigeoclonium sp, Volvox sp, Microcoleus paludosus, Ulnaria ulna has a positive effect with Total alkalinity, Bicarbonate alkalinity and calcium ion concentration. Surirella elegans, Cymbella sp, showed positive correlation with Carbonate alkalinity concentration during autumn. Navicula sp Ulothrix sp, Nitzschia sp and Chlorococcum sp positively correlated correlation with Carbonate and Bicarbonate ion concentrations. Spirogyra sp, Anabaena cylindrica showed least affected by 18 variables (Physico-chemical) followed by Klebsormidium sp.
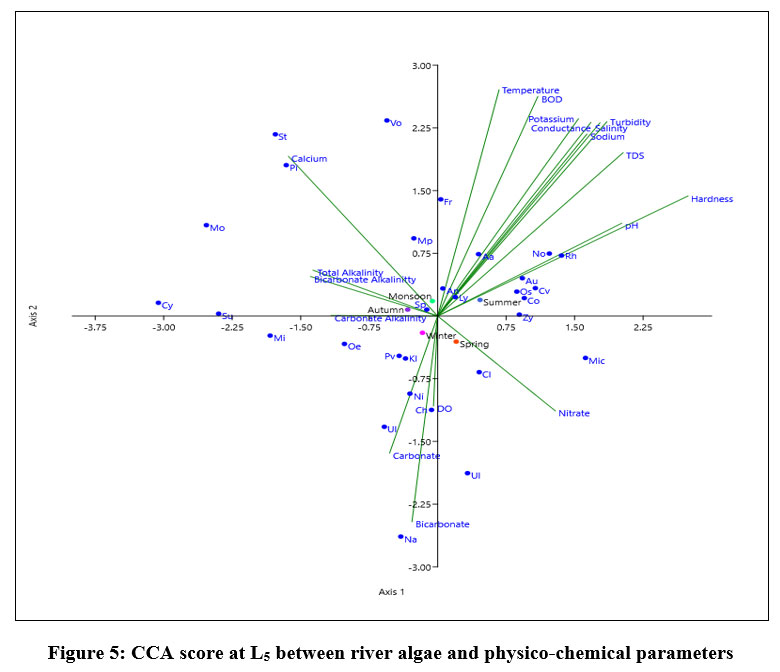 | Figure 5: CCA score at L5 between river algae and physico-chemical parameters
|
Eigen value of L6, shown in fig-1 for axix 1 (0.066145) showed 49.82% correlation and axis 2 (0.028895) made 21.76% relationship between 18 variables and dominant species of algae Navicula, Nitzschia sp, Microcoleus paludosus have positive relation with axis 1.During monsoon and summer Nostoc sp, Aulocosirea sp, Chlorella vulgaris, Micrcystis sp, Coscinodiscus sp, Lyngbia sp showed positive correlation with Temperature, BOD, Turbidity, TDS, Salinity, Conductivity, Hardness, pH, potassium, and sodium ion concentration. Ulnaria ulna, Zygnema sp, Rhizoclonium sp, Cladophora Oscillatoria sp showed positive correlation with nitrate ion concentration. During winter Surirella elegans, Ulnaria ulna, Oedogonium sp, Pinularia viridis showed a positive tendency with Dissolve oxygen and carbonate ion. During autumn and monsoon Stigeoclonium sp, Volvox sp, Pithophora sp, Monoraphidium sp, Cymbella sp showed positive correlation with Carbonate alkalinity, Total alkalinity, and Bicarbonate alkalinity, calcium and bicarbonate ion concentration. Spirogyra sp, Anabaena cylindrica have no relation with physic-chemical parameters followed by Lyngbia sp.
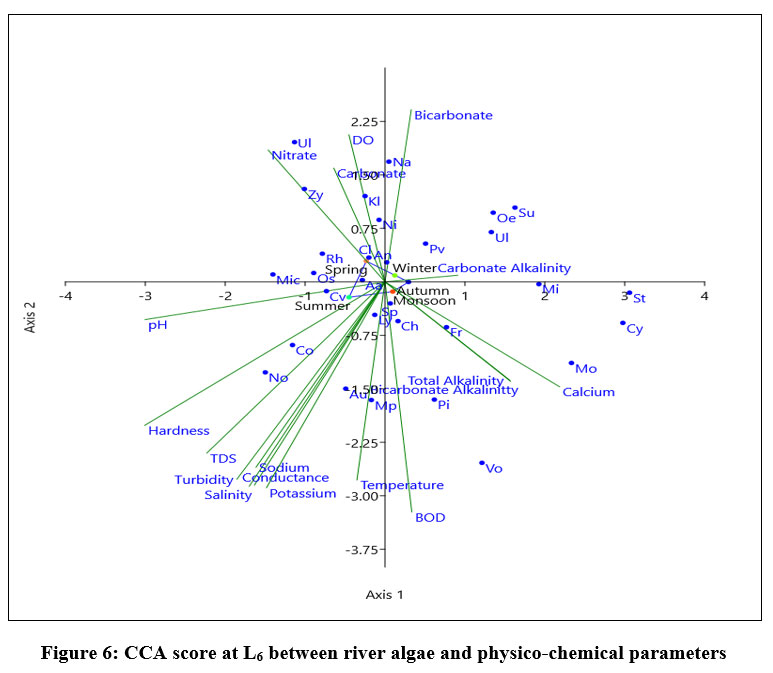 | Figure 6: CCA score at L6 between river algae and physico-chemical parameters
|
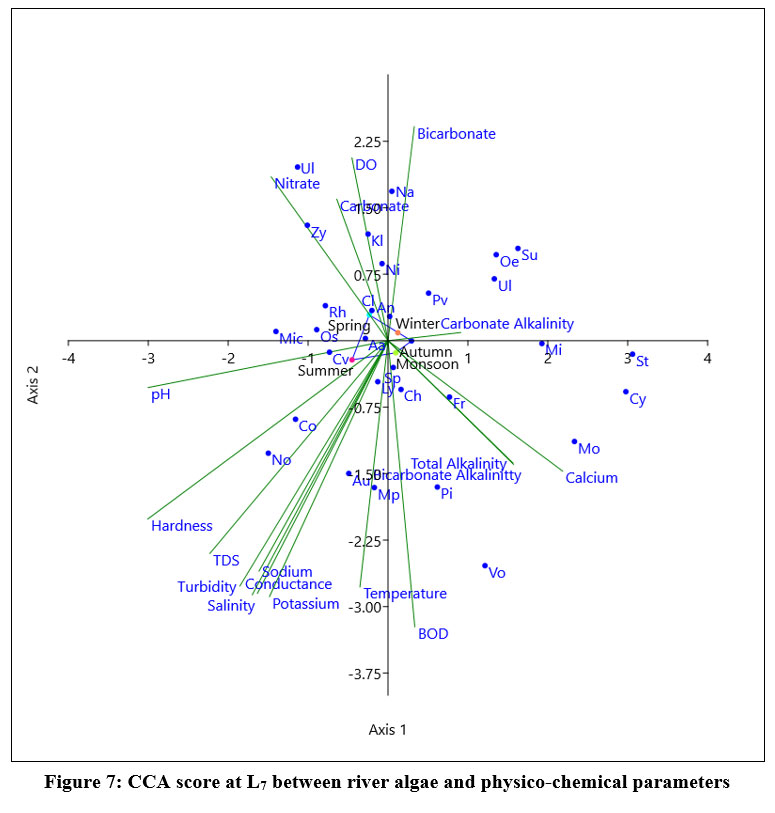
At L7 (Fig 7) the eigen value for axis1 (0.06388) justified 49.12% relationship and axis 2 (0.029398) showed 22.61% relationship between 18 variables (physic-chemical) and dominant species of algae. Navicula,Klebsormidium sp, Nitzschia sp, Anabaena azollae were positively correlated with axis 1. During monsoon and summer Nostoc sp, Aulocosirea sp, Chlorella vulgaris, Micrcystis sp, Coscinodiscus sp, Lyngbia sp, Aulacosirea sp, Oscillatoria sp showed positive correlation with Temperature, BOD, Turbidity, TDS, Salinity, Conductivity, potassium, and sodium ion concentration. During spring Nitzschia sp, Cladophora sp, Zygnema sp made positive effect with nitrate ion concentration and pH. Surirella elegans, Microspora sp, Ulnaria ulna, Oedogonium sp, Pinularia viridis showed a positive relation with Carbonate alkalinity and carbonate, Bicarbonate ion concentration during winter. During autumn and monsoon Stigeoclonium sp, Volvox sp, Rhizoclonium sp, Pithophora sp, Monoraphidium sp, Cymbella sp showed positive correlation with Carbonate alkalinity, Total alkalinity, Bicarbonate alkalinity and calcium ion concentration.
 | Figure 7: CCA score at L7 between river algae and physico-chemical parameters
|
Discussion
The mean temperature of river water of Ichhamati ranges between 23.20C to 310C throughout study period. It is reported that 25-300C temperature range is ideal for algal growth 29. The present study also suggests these findings. pH value of River Ichhamati ranged between 7.65 to 8.05 and make this slightly alkaline. It was reported that pH range 5.0 to 6.6 increased algal abundance 30. The present study report that slightly alkaline river water is suitable for some algal growth (Table 3). The mean value of Conductivity ranged between 808.5- 16026.67 µS/cm. For periphyton algae increased Conductivity can stimulate attached algal biomass and productivity 31. This study also found abundance growth of periphytonic algae during study time. Mean salinity value of river water was 393 to 14096.66 ppm during study time. Ichhanmati water TDS value found between 577.5 – 18457.33 ppm. TDS effectively related with salinity to create toxicity and change in ionic composition of fresh water creating limited biodiversity, shifting of aquatic populations and exclusion of weakly tolerable species32. The present study also found presence of less aquatic flora during high salinity and TDS level but some micro algae may be tolerant of high salinity and TDS as shown in table 3. Dissolve Oxygen (DO) have great impact on aquatic ecosystem and helpful for assessment of water quality. This study finds mean DO of Ichhamati River between 6.80 to 8.05 ppm and suggest Ichhamati river ecosystem is ideal for growth of Cyanophytes, Chlorophytes, Diatoms 33. Another important parameter BOD indicate level of organic pollution of water. Ichhamati river showed mean value of BOD between 1.35 – 3.16 ppm giving indication of suitable aquatic environment. Mean hardness of river Ichhamati water ranged between 166.05 – 2100.75 ppm. Turbidity lied between 180 and 944 NTU. Total alkalinity lied between 102 to 173.50 ppm. Cyanophycean algae like Anabaena cylindrica needs adequate Na+ ion concentration in water for their growth 34. Mean sodium content ranged between 93.53 to 1892.33 ppm. Sodium ion concentration is high during summer and monsoon and growth of some diatoms and green algae stunted during this period rather than blue green algae. Mean potassium ion concentrations ranged between 7.07 to 978.73 ppm which suggesting the river is good for algal habitant 35. Calcium ion concentrations range between 46.50 to 432.50 ppm. Nitrate ion concentration is important factor for promoting algal growth 36. Mean nitrate concentration ranged between 344 to 3702ppm. The present study observed high nitrate concentration during March, May and August month of 2022 and probable reason may be addition of chemical manure with rain water used by farmers for agricultural purpose besides river bank. Bicrbonate ion concentration is key for algal photosynthesis 37. Bicarbonate ion of this river ranged between 155.31 and 205.75 ppm making this good photosynthetic condition throughout the year. This study finds the river water is suitable for growth of Chlorophyceae and Diatoms.. Monsoon has rich variety of vegetation. This study had identified 7 cyanophycian algae, 14 chlorophycian algae and 9 diatoms (Table 3) belonging to the family Cyanophyceae, Chlorophyceae, Charophyceae and Bacillariophyceae. Monsoon season present some abundant growth of algal species such as Klebsormidium, Spirogyra, Lymgbya, Nitzschia, Pinnularia. Temperature change during winter may be probable reason for diatoms as dominant species. Fishes preferred diatoms as food. It is reported that dominancy of diatoms in aquatic body improve the growth of fish and shrimp to meet their nutritional demandL38.Ichhamati a number of variety of fishes. We examined gut sample of Mystes tengara and found Spirogyra, Ulothrix, Pinnularia, Chlorella, Pithophora and Chlorococcum from gut sample. So it is clear that algae provide a large part of food for fishes in river Ichhamati. Present study identified 7 cyanophycean algae reportedly having biological nitrogen fixing ability 39 and resulting river bank soil fertility and cessation of submerged weeds growth. Green algae Chlorella vulgaris conain good quantity of protein 40 and important source of fish food and their growth, immunity41.
Conclusions
It may be concluded that ecosystem of river Ichhamati is suitable for algal growth and diversity. Data of present observation in the sense of dominance showed by different group of algae and present observation reported accordingly 47% belongs to Chlorophyta, 23% are Cyanophyta and 30% are Diatoms form food reserve for aquatic animal. According to their dominancy various algal division were Chlorophyta > Cyanophyta > Bacillariophyta in the autumn, spring and monsoon. In winter it was observed that the dominancy is Bacillariophyta > Chlorophyta > Cyanophyta and in summer Cyanophycea > Chlorophyceae > Bacillariophyceae. It may also reported that Ichhamati is good for fishery mainly for Hilsha fish. But in spring, summer and rainy season salinity, TDS is very high and this may be mixing of sea water during high tide. Presence of sufficient concentration of nitrate and potassium ions justified that river bank is fertile for agricultural purpose.
Acknowledgement
The authors are extremely grateful to Governing Body and Research monitoring committee of Barrackpore Rastraguru Surendranath College for financial assistance and funding research project.
Conflict of Interest
Both the author declares that they have no conflict of interest.
Fund Sources
Barrackpore Rastraguru Surendranath College. Fund No. – College/Science/2018-19/RP.
References
- Bunn, S. E., and Arthington, A. H.. Basic principles and ecological consequences of altered flow regimes for aquatic biodiversity. Environmental Management 30:492-507. 2002
CrossRef - Sayed A M. Banglapedia: National Encyclopedia of Bangladesh (Second ed.). Asiatic Society of Bangladesh. 1943.
- Mondal I and Bandyopadhyay J.. Physicochemical Analysis of Ichamati River and Estimation of Soil Parameters using Geospatial Technology. Journal of The Institution of Engineers (India) Series E 97. 10.1007.2016.
CrossRef - Patil S.V., Karande V.C. and Karande C.T.. Limnological study of Venna Lake, Mahabaleshwar, Maharashtra, India. International Research Journal of Environment Sciences., 4(8), 45-49. 2015.
- Agrawal, S.C.. Limnology. APH Publishing Corporation. 1999.
- Gaikwad, SR, Tarot, SR, Chavan, TP. Diversity of Phytoplankton and zooplankton with respect to pollution status of river Tapi in North Maharastra region, J. Curr. Sci.; 5 : 749-754. 2004.
- Meshram, C.B. and Dhande, R.R. Algal diversity with respect to pollution status of Wadali lake, Amaravati, Maharashtra, India. J. Aqua. Biol. 15:1-5. 2000.
- Palmer, C.M. A composite rating of algae tolerating organic pollution.J.Phycol.5:78-82. 1969.
CrossRef - Cascallar, L., Mastranduono, P., Mosto, P., Rheinfeld, M., Santiago, J., Tsoukalis, C. and Wallace, S. Periphytic algae as bioindicators of nitrogen inputs in lakes. J. Phycol. 39:7-8. 2003.
CrossRef - Siangbood, H. and Ramanujam, P. 4 Effect of anthropogenic activities on algal assemblages in Umiew river, Meghalaya. Phykos. 44(1):415-51.2014.
CrossRef - Gopinath P. and Kumar A. K. G. Micro algal diversity of the fresh water lake in Thiruvananthapuram district, Kerala. International journal of plants, animals and environment science. 5 (1): 288-291.2015.
- Ray M. Seasonal Variation of Physico-chemical parameters of Jalangi River water: Relation with Water Uses and Water Pollution.MS-Academic. 5 (1).82-87.2015.
- Ray M. Pal S. Study of aquatic biodiversity and correlation with physical parameters of Jalangi river, European Journal of Biological Research, 11(2), 212-216. 2021 . DOI: http://dx.doi.org/10.5281/zenodo.4516528
- Ray M. Seasonal Variation of Physico-chemical Parameters of River Churni. Nadia During 2019-2020. Journal of Science and Technological Researches, , 3(1), 1-5. 2021. DOI: https://dx.doi.org/10.51514/JSTR.3.1.2021.1-5
CrossRef - Ray M. Comparison of Physico-chemical Parameters of River Bhagirathi, Jalangi and Churni within Nadia, WB During 2020-2021. Journal of Science and Technological Researches, 3(3), 1-8.2021. DOI: https://dx.doi.org/10.51514/JSTR.3.3.2021.1-8
CrossRef - Negi S, Ray M, Pant H, and Joshi H C. Comparison of water quality of eight rivers around Dehradun district of Uttarakhand during november and December 2021. Journal of Science and Technological Researches, 4(3), 32-35. 2022. DOI: https://doi.org/10.51514/JSTR.4.3.2022.32-35
CrossRef - Ray M. Seasonal Variation of Different Biologically Significant ion Concentrations of the Jalangi River water. Indian Journal of Biology,. 2(2),179-183. 2015. DOI: https://dx.doi.org/10.21088/ijb.2394.1391.2215.12
CrossRef - Ray M, Sengupta K . Soil composition and nutrient dynamics of some phytoplankton’s of River Jalangi, Nadia WB. Indian Journal of Biology, 2(2),167-170. 2015. DOI: 19.https://dx.doi.org/10.21088/ijb.2394.1391.2215.10
CrossRef - Ray M, Comparison of Biological Significant Ions of River Bhagirathi, Jalangi and Churni within Nadia, WB During 2020-2021 Journal of Science and Technological Researches, 4(1), 1-8. 2022. DOI: https://dx.doi.org/10.51514/JSTR.4.1.2022.1-8.
CrossRef - Tank JL, Dodds WK.. Nutrient limitation of epilithic and epixylic biofilms in 10 North American streams. Freshwater Biol 48: 1031–1049.2003.
CrossRef - Elser JJ, Bracken MES, Cleland EE, Gurner DS, Harpole WS, Hillebrand H, Ngai JT, Seabloom EW, Shurin JB, Smith JE.. Global analysis of nitrogen and phosphorus limitation of primary producers in freshwater, marine and terrestrial ecosystems. Ecol Lett 10: 1135–1142. 2007.
CrossRef - Steven N., Steven F. Rier T and Whorley S. Methods for Sampling and Analyzing Wetland Algae. Wetland Technique.Springer, 1-58. 2013.
- Desikachary, T.V. Cyanophyta. – Indian Council of Agricultural Research, New Delhi, 24.1959.
- Cox, E. R., Hightower, J.. Some corticolous algae of McMinn County, Tennessee, U.S.A. Journal of Phycology 8:203–205, 1972.
CrossRef - Sarode P. T. And Kamat N.D.. Fresh water diatoms of Maharashtra, Pub. Saikrupa Prakashan Aurangabad, 1-338, 1984.
- Sharma O.P. Algae. McGraw Hill Education (India), 2011.
- Abrantes, N. Antunes, S.C. Pereira, M.J. and Gonalves, F. Seasonal succession of cladocerans and phytoplankton and their interactions in a shallow eutrophic lake (Lake Vela, Portugal). Acta Oecologica. 29 (1), 54-64. 2006.
CrossRef - Liua C , Liub L, Shen H C. Seasonal variations of phytoplankton community structure in relation to physico-chemical factors in Lake Baiyangdian, China. Procedia Environmental Sciences. 2, 1622–1631. 2010.
CrossRef - Singh S.P. and Singh P. Effect of temperature and Light on the growth of algae species: a review. Renewable and Sustainable Energy Reviews. 50: 431-444. 2015
CrossRef - Leavitt P R,. Findlay D L,. Hall R I and. Smol J P.. Algal responses to dissolved organic carbon loss and pH decline during whole-lake acidification: Evidence from paleo limnology. The American Society of Limnology and Oceanography. 44(3): 757–773.1999.
CrossRef - Drerup, S A. Vadeboncoeur, Y.. Elevated specific Conductivity enhances productivity and biomass of periphytic cyanobacteria from Lake Tahoe and Lake Tanganyika. Phycologia. 55(3): 295-298.2016.
CrossRef - Bierhuizen J.F.H. and. Prepas E E, Relationship between nutrients, dominant ions and phytoplankton standing crop in prairie saline lakes. Can. J. Fish. Aquat. Sci., 42: 1588-1594.1985.
CrossRef - Sk S, and Ray M.. Studies of Seasonal Algal composition during Monsoon and winter seasons of the river Rupnarayan, West Bengal, India in correlation with some physic-chemical parameters. Applied Ecology and Environmental Sciences. 10(3), 126-130.2022.
- Amelia. K. Ward R. and Wetzel G.. Sodium: Some effects on blue-green algal growth. Journal of Phycology. 11(4), 357- 363. 2008.
CrossRef - Gupte Y.. Uptake of potassium by algae and potential use as biofertilizer. Indian Journal of Plant Physiology. 1-4.2015.
- Harrison P J and. Hurd C L. Nutrient physiology of seaweeds: application of concepts to aquaculture. Cahiers de Biologie Marine, 41; 71-82, 2001.
- Shevela D, Julain J. and Eaton R. Photosystem II and the unique role of bicarbonate: Ahistorical perspective. Biochemica et Biophysica Acta(BBA)- Bioenergetics. 1817(8), 1134-1151, 2018.
CrossRef - Nesara KM and Bedi CS. Diatomix : a diatom enhancer. Journal of fisheries sciences.com. 13(2), 12-15, 2018.
CrossRef - Ahmed. A. Issa, Mohamed H A A and Ohyama T. Advances in Biology and Ecology of Nitrogen Fixation. Intech Open. Tokyo. 2014.
- Uchechukwu D. E. Chlorella vulgaris as Protein Source in the Diets of African Catfish Clarias gariepinus. Fishes.2(4), 17, 2017.
CrossRef - Azza A.A. Galal R,. Reda M and , Amany A R M. Influences of Chlorella vulgaris dietary supplementation on growth performance, hematology, immune response and disease resistance in Oreochromis niloticus exposed to sub-lethal concentrations of penoxsulam herbicide. Fish & Shellfish Immunology. 77, 445-456, 2018
CrossRef


