Farmers’ Perceptions on Land Degradation: A Case Study in Vietnam
Nguyen Mau Dung
*
 and Nguyen Thi Hai Ninh
1
Department of Resources and Environmental Economics, Faculty of Economics and Rural Development,
Vietnam National University of Agriculture,
Hanoi City,
Vietnam
http://dx.doi.org/10.12944/CWE.18.3.35
Copy the following to cite this article:
Dung N. M, Ninh N. T. H. Farmers’ Perceptions on Land Degradation: A Case Study in Vietnam. Curr World Environ 2023;18(3). DOI:http://dx.doi.org/10.12944/CWE.18.3.35
Copy the following to cite this URL:
Dung N. M, Ninh N. T. H. Farmers’ Perceptions on Land Degradation: A Case Study in Vietnam. Curr World Environ 2023;18(3).
Download article (pdf) Citation Manager Publish History

Introduction
Land degradation is a significant global concern that affects both the environment and development. 1 It encompasses various processes that result in the decline of land productivity, including diminished soil biological diversity and activity, erosion caused by wind and water, loss of soil structure, salinization, acidification, water logging, soil nutrient depletion and pollution. 2 The consequences of land degradation are detrimental, as it hinders agricultural development, exacerbates poverty and vulnerability, and fosters social tensions due to the increasing demands on limited natural resources prompted by growing populations. Land degradation is caused by natural constraints, such as high annual rainfall and steep terrain conditions, as well as inappropriate land management. 3 The decision of farmers to adopt sustainable land management (SLM) depends on their perception of the landscape. The term “farmers’ perception of land degradation” refers to how farmers perceive the relationship between soil erosion and soil fertility processes. 4 Perception is one of the key factors that determine the adoption of various land sustainable practices.
SLM is considered as knowledge-based procedures that help integrated land, water, biodiversity and environmental management to meet the increasing demand for food and fiber while simultaneously maintaining the ecosystem services and livelihoods. 5 Typical types of SLM practices include diversified cropping system with soil erosion control structures, integrated agroforestry, contour farming in sloping land, intercropping system and mulching in degraded and dry areas. 6,7 These practices play a pivotal role in positive changes in sustainable use and administration of land resources. 8 Practices that fail to uphold sustainability in land management can pose risks to biodiversity and exacerbate carbon emissions, particularly when forest are destroyed, while also adversely affecting water resource management.
In Vietnam, land degradation is considered one of the foremost challenges of the country. 9 According to the National Action Progarm to Combate the Desertification for the 2006-2010 period and orientation to 2020, approximately 9.3 million hectare of land in Vietnam are grappling with desertification. This area sustains the livelihoods of approximately 22 million people, which accounts for roughly one-fourth of the nation’s total population. SLM practices in Vietnam include the agroforestry models, intercropping models based on the legumes (i.e. mung bean/ peanut/ or soybean) and sesame. 10,11
Despite the recommendations from the Vietnamese government regarding the adoption of SLM, on-SLM practices or inappropriate land management such as monoculture, erosive farming practices and excessive use of chemicals still prevails in many regions of Vietnam. 12,13,14 Increasing the rate of SLM adoption is therefore very essential for preventing land degradation. The inadequate perception of farmers regarding land degradation appears to be one of the reasons for the low proportion of SLM adoption. However, there is a lack of studies examining the farmers’ perception of land degradation. Consequently, how the Vietnamese farmers perceived on land degradation remains unanswered questions and requires further investigation. This study thus aims to investigate the current perception of Vietnamese farmers regarding land degradation, and propose measures to improve their perceptions for better adoption of SLM in the future.
Methodology
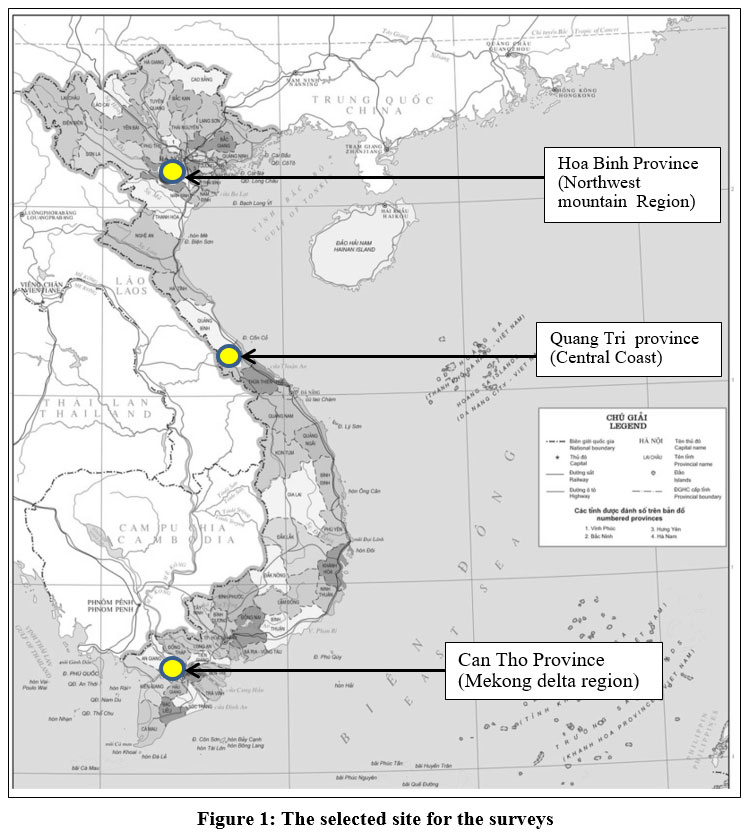
Land degradation is a pervasive issue across all regions of Vietnam, with certain areas experiencing particular severe impact. The Northwest mountainous region, Central coastal region, Mekong delta region, and Central highland are among the most affected regions. 15 This study focuses on investigating farmers’ perceptions of land degradation in three regions: Northwest mountain, Central coast, and Mekong delta. To ensure representative study sites, one district was selected from each region through focus group discussion with land management experts. Da Bac district (Hoa Binh province) province was chosen as the study site for the Northwest region. This district exhibits diverse topography, including high mountains (some mountains with more than 1000 meters high), hills, rivers and streams, with slopes averaging 35 degrees and an average elevation of 560 meters above sea level. For Mekong delta region, Co Do district (Can Tho province) was selected. This district is characterized by flat fields primarily used for rice production. In the Central coastal region. Hai Lang district (Quang Tri province) was chosen as the study site. This district features sandy soil, low fertility and experiences severe drought during the dry seasons. By selecting these representative districts, the study aims to capture the farmers’ perception of land degradation in the specific contexts of these regions.
 | Figure 1: The selected site for the surveys.
|
In each district, the group discussions were organized with the district staff to select the communes for interviews. The selection criteria included ensuring that the chosen communes represented the district in term of agricultural practices, including both SLM and non-SLM approaches. Approximately 240-300 farm households were selected for face-to-face interviews in each district. The selection of farm households employed a stratified approach. Initially, the farm households were divided in to two main groups: SLM adopters and non-adopters. From each group, sample households were randomly selected. The research team collaborated with district staff and commune or village staff to gain insights into the SLM adoption situation in selected districts and communes, and to identify the farm households for interviews. The number of adopter and non-adopter households in each study site is presented in Table 1. The household survey was conducted in 2017. Subsequently, both primary and secondary data were collected, organized, and categorized for data analysis. Descriptive analysis and comparative analysis were primarily employed for data analysis purposes.
Table 1: Number of interviewed farm households
District/ Province | Total areas (km2) 16 | Total population (1000 persons) 16 | Estimated adoption rate (%) | SLM adopted households | SLM non-adopted households | Total surveyed households |
1. Da Bac district – Hoa Binh Province | 779.77 | 54,985 | 30-40 | 181 | 119 | 300 |
2. Hai Lang district – Quang Tri Province | 426.92 | 78,324 | 20-30 | 110 | 129 | 239 |
3. Co Do district – Can Tho province | 310.37 | 116,576 | 10-15 | 123 | 164 | 287 |
Total | - | - | - | 414 | 412 | 826 |
Results and discussions
General information on the survey households
A total of 826 farm households, including both those who had adopted sustainable practices and those who had not, were selected for direct interviews. The respondents had an average age of 47.7 years, and the majority had completed secondary school. On average, each surveyed households consisted 4.7 individuals, with 4.1 individuals above the age of 12. Furthermore, there were 2.2 agricultural laborers within each surveyed household (Table 2).
Table 2: General Information of respondents and survey households
|
| Age | Education level | No. of member | Member above 12 years | No. of agricultural labors |
1. Hoa Binh province | Mean | 45.7 | 1.7 | 4.4 | 3.6 | 2.4 |
Std. Dev | 10.9 | 0.7 | 1.2 | 1.0 | 0.9 | |
- Adopters | Mean | 46.0 | 1.7 | 4.5 | 3.6 | 2.4 |
Std. Dev | 10.8 | 0.7 | 1.2 | 1.1 | 1.0 | |
- Non-Adopters | Mean | 45.2 | 1.7 | 4.3 | 3.6 | 2.4 |
Std. Dev | 11.0 | 0.7 | 1.1 | 1.0 | 0.9 | |
2. Quang Tri province | Mean | 49.7 | 1.9 | 4.9 | 4.3 | 1.8 |
Std. Dev | 9.2 | 0.4 | 1.0 | 1.1 | 0.5 | |
- Adopters | Mean | 48.7 | 2.0 | 4.7 | 4.3 | 2.0 |
Std. Dev | 7.5 | 0.4 | 1.0 | 1.0 | 0.5 | |
- Non-Adopters | Mean | 50.6 | 1.9 | 5.0 | 4.4 | 1.7 |
Std. Dev | 10.5 | 0.5 | 1.0 | 1.1 | 0.6 | |
3. Can Tho province | Mean | 48.2 | 2.1 | 5.0 | 4.4 | 2.3 |
Std. Dev | 9.4 | 0.8 | 1.2 | 1.4 | 1.0 | |
- Adopters | Mean | 48.4 | 2.1 | 4.8 | 4.0 | 2.0 |
Std. Dev | 8.6 | 0.7 | 1.1 | 1.1 | 1.0 | |
- Non-Adopters | Mean | 48.0 | 2.2 | 5.0 | 4.6 | 2.5 |
Std. Dev | 10.0 | 0.8 | 1.3 | 1.5 | 1.0 | |
4. Total | Mean | 47.7 | 1.9 | 4.7 | 4.1 | 2.2 |
Std. Dev | 10.0 | 0.7 | 1.2 | 1.2 | 0.9 | |
- Adopters | Mean | 47.4 | 1.9 | 4.6 | 3.9 | 2.2 |
Std. Dev | 9.5 | 0.7 | 1.1 | 1.1 | 0.9 | |
- Non-Adopters | Mean | 48.0 | 2.0 | 4.8 | 4.2 | 2.2 |
Std. Dev | 10.6 | 0.7 | 1.2 | 1.3 | 0.9 |
(Note: For education level: Primary school = 1; secondary school = 2; high school = 3; college and university = 4)
(Source: Household Survey, 2017)
There was only a small difference in age, education, number of household members, and number of agricultural laborers between the adopters and non-adopter groups, and statistical tests indicated no significant difference in these indicators between the two groups. However, there were significant differences in age and education of respondents among the regions. On average, respondents in Hai Lang district were four years older than those in Da Bac district and 1.5 years older than the those in Co Do district. This difference in age was statistically significant at p < 0.01. Moreover, respondents in Co Do district had a higher level of education compared to those in Da Bac and Hai Lang districts, with the difference in education level between the districts being statistically significant at p < 0.01. While the surveyed households in Co Do district had the largest number of family members and the members above the age of 12, the surveyed households in Da Bac district had the largest number of agricultural members per household. This difference may be attributed to the fact that people in Da Bac district focused more on agricultural activities due to the difficulty of finding non-farm jobs. On the other hand, people in Hai Lang district had relatively easier access to non-farm employment opportunities.
SLM Adoption in the survey households
Due to the variation in natural and socio-economic conditions, the implementation of SLM practices differed across the regions. Even within the same region, there were different SLM practices observed. 10 In the mountainous Da Bac district, SLM practices included the agroforestry models and crop rotation of maize and legumes. 17, 18 On the other hand, non-SLM practices involved the monoculture of crops such as two maize crop, two rice crops, cassava and sugarcane. Another non-SLM practice was crop rotation with cassava or edible canna such as maize-cassava or maize-edible canna. These non-SLM practices in the region often resulted in the loss of soil organic matters and depletion of soil nutrients. The key characteristics of SLM practices in the region were their ability to maintain good land cover and improve soil quality. According to the survey, the majority of SLM households (62.5%) implemented agroforestry models, with the acacia with upland crops models being the most common. Other SLM practices included the styrax with cash crop model (13.3%) and the meliaceae with cash crop model (9.9%). In contrast, non-SLM practices consisted of maize monoculture (31.9%), intercropping of cassava and maize (19.4%), sole cultivation of cassava (24.4%) and other practices (14.3%).
In the coastal region of Hai Lang district, non SLM-practices consisted of, monocultures of rice, cassava, or sweet potato. These practice often led to the depletion of soil nutrients and loss of organic matter, primarily due to excessive use of chemical fertilizerss or soil exposures to sunlight during the dry season. According to the survey, rice monoculture was the most prevalent practice in the non-SLM households, accounting for 54.6%. Single cassava plantation accounted for 21.8% while monoculture of sweet potato represented 19.3% (table 3). On the other hand, intercropping models that involved legumes such as mung bean, peanut, or soybean as well as chieves can be considered as SLM models in Hai Lang district. These models help maintain and balance soil nutrients, particularly due to the presence of legumes. Additionally, farmers in the district often practice mulching by returning crop residues from harvest and applying compost. This practice further aids in maintaining soil moisture, enhancing soil organic matters, and decreasing soil surface degradation. The main SLM model observed in the survey households was chieves with cassava, accounting for 27.3%. Other SLM models included Chieves + bean + cassava (22.7%), Cococynth + bean (21.8%), Cassava+bean-melon (19.1%).
Table 3: Type of SLM and non_SLM practice in survey households by regions
Region | SLM and non-SLM practices | No of adopted HHs | Percents | |
Mountainous region | SLM practices | Styrax with cash crop | 24 | 13.3 |
Acacia with cash crop | 118 | 65.2 | ||
Meliaceae with cash crop | 18 | 9.9 | ||
Others | 23 | 11.6 | ||
Total | 181 | 100.0 | ||
Non-SLM practices | Maize – maize | 38 | 31.9 | |
Cassava | 29 | 24.4 | ||
Maize and cassava (intercrops) | 35 | 29.4 | ||
Others | 17 | 14.3 | ||
Total | 119 | 100.0 | ||
Coastal region | SLM practices | Maize+peanut - Maize+bean | 10 | 9.1 |
Chieves + bean + cassava | 25 | 22.7 | ||
Chieves + cassava | 30 | 27.3 | ||
Cococynth + bean | 24 | 21.8 | ||
Cassava+bean-melon | 21 | 19.1 | ||
Total | 110 | 100.0 | ||
Non-SLM practices | Rice - rice | 65 | 54.6 | |
Cassava | 26 | 21.8 | ||
Sweet potato | 23 | 19.3 | ||
Others | 5 | 4.2 | ||
Mekong delta | SLM practices | Rice rotation with seasame | 90 | 73.2 |
Rice rotaltion with melon | 4 | 3.3 | ||
Rice rotaltion with bean | 14 | 11.4 | ||
Rice rotaltion with maize | 15 | 12.2 | ||
Total | 123 | 100.0 | ||
Non-SLM practices | 3 rice | 155 | 94.5 | |
2 rice | 4 | 2.4 | ||
Others | 5 | 3.0 | ||
(Source: Survey data, 2017)
In the Mekong delta, the monoculture of rice, such as three rice crops per years or two rice crops per year, is regarded as a non-SLM practice. Continuous rice cultivation in paddy soils leads to degradation of soil quality due to long-term submergence and excessive mineral fertilizer application. 19 Continuous rice cultivation over extended period has been observed to result in rapid nutrient depletion, soil compaction and destruction of soil structure, porosity and aeration due to flooded conditions. 20 In the survey of non-SLM households, the practice of having three rice crops accounted for the majority, with 94.5%, while the practice of having two rice cops was only 2.4%. In the delta, a cropping rotation system that includes upland crops, particularly legumes, is considered a SLM practice. This system helps improve soil fertility and nutrient levels, especially nitrogen, through return of biomass and nitrogen fixation. One common SLM practice observed in households is rice rotation with sesame, which accounted for the majority at 73.2%. Rice rotation with bean or maize, on the other hand, had small shares, around 11-12%.
Perception and attitudes of the households on land degradation
Perception on land degradation occurrence
According to the survey results, more than 82.7% of the respondents reported that they observed land degradation on their own land. However, the perception of land degradation varied among different regions. In the coastal and mountain regions, nearly all farmers (100% and 82,7%, respectively) acknowledged that land degradation was occurring on their land. On the other hand, in Mekong delta region, only a minority of farmers (30%) believed that land degradation was taking place on their land. This difference in perception can be attributed to the visibility of land degradation in each region. In mountainous and coastal regions, land erosion and reduced crop productivity make land degradation more apparent to farmers. They can observe these tangible signs of degradation. However, in the Mekong delta, where the manifestation of land degradation may be less obvious, farmers might find it more challenging to identify and acknowledge the occurrence of land degradation on their land.
Table 4: Occurrence of Land Degradation in respondents’ households (%).
Province | Place of land degradation | Adopters
| Non-Adopters | All surveyed households |
1. Hoa Binh | In my own agricultural land | 82.9 | 82.4 | 82.7 |
In agricultural land of others | 97.8 | 95.0 | 96.7 | |
2. Quang Tri | In my own agricultural land | 100.0 | 100.0 | 100.0 |
In agricultural land of others | 100.0 | 100.0 | 100.0 | |
3. Can Tho | In my own agricultural land | 4.9 | 44.5 | 27.5 |
In agricultural land of others | 8.1 | 44.5 | 28.9 | |
Total | In my own agricultural land | 64.3 | 72.8 | 68.5 |
In agricultural land of others | 71.7 | 76.5 | 74.1 |
(Source: Survey data, 2017)
The share of respondents who reported the occurrence of land degradation in their farming land was was similar between SLM adopters and non-adopter groups in both the mountainous and coastal regions. Nonetheless, a notable distinction existed between the two groups of SLM adopters and non-adopters in Mekong delta region (table 3). Among the adopters, only 4.9% reported that land degradation was occurring on their land, whereas the figure for non-adopters was 44.5%, This suggests that the adoption of SLM practices clearly mitigates or prevent land degradation in Mekong delta region. The clear contrast in the reported occurrence of land degradation between two groups of adopters and non adopters highlights the effectiveness of SLM adoption in preventing land degradation in the Mekong delta. This implies that the implementation of sustainable practice paly the essential role in maintaining the health and productivity of agricultural land in this region.
Changes of land indicators by respondents’ assessment
In the recent years, land degradation has occurred in many regions of Vietnam due to various reasons. A majority of the respondents have reported observing indicators of land degradation on their farm, such as changes in soil color, texture, fertility. A notable proportion of the respondents (35-45%) have noticed a deterioration in soil color, texture, thickness, and water quality on their land plots in recent years. Additionally, over 50% of farmers have increased their fertilizer usage compared to five years ago.
There were notable differences between groups of farmers when assessing changes in land indicators. A substantial proportion of adopters (14-16%) reported improvements in soil color, texture, thickness and fertility on their plots whereas only a very small percentage of non-adopters (4-6%) shared the same perception. Furthermore, the percentage of non-adopters who increased their fertilizer usage for crop production was higher compared to the adopters (as shown in Table 5). This suggests that the adoption of SLM practices made some contributions towards enhancing the land of the farm household and quality of surrounding waters.
Table 5: The changes of land indicators assessed by adoption groups
| Better or higher | Worse or lowers | No change | |||
Adopter group | Non-adopter group | Adopter groups | Non-adopter group | Adopter group | Non-adopter group | |
Soil color | 15.0 | 4.6 | 34.2 | 46.5 | 50.7 | 48.9 |
Texture | 15.7 | 6.3 | 33.5 | 51.6 | 50.8 | 42.1 |
Thickness | 13.9 | 4.3 | 37.2 | 51.2 | 48.9 | 44.5 |
Fertility | 16.3 | 4.8 | 43.4 | 64.6 | 40.2 | 30.6 |
Water Quality | 2.4 | 0.6 | 32.7 | 42.1 | 64.9 | 57.3 |
Crop Yield | 19.6 | 11.5 | 28.2 | 43.0 | 52.2 | 45.6 |
Fertilizer use* | 49.1 | 57.1 | 2.1 | 7.8 | 48.8 | 35.1 |
Water Quantity | 4.5 | 0.7 | 54.2 | 51.6 | 41.3 | 47.7 |
Vegetative | 8.8 | 1.7 | 41.3 | 38.8 | 49.8 | 59.5 |
(*) higher fertilizer use per unit of area)
(Source: Household Survey, 2017)
Indicators reflecting land degradation
The recognition of diminishing land fertility serves as an indicator of land degradation by a majority of the respondents (81.7%). However, only a small percentage (7.2%) considered it as the most important indicator (as shown in Table 6). Approximately 80% of the surveyed farmers agreed that reduced crop yield was a reflection of land degradation, with 12.8% considering it as the most important indicator. Less than half of surveyed farmers viewed weed development, land salinity, and bare land as indicator of land degradation. The perceptions of respondents regarding land degradation indicators was also influenced by regional topography. In mountainous region, 87% of farmers considered land erosion as one of the indicators of land degradation, with half of them regarding it as the most important indicator. However, farmers in the coastal region and the Mekong delta region did not share this viewpoint. This discrepancy can be attributed to the flat nature of the land in the coastal and mountainous region where land erosion is not as visibly evident.
Table 6: Indicators reflecting land degradation by farmers.
| Yes, this is an indicator | Yes, it is the most important indicators | ||||
Adopters | Non- adopters | All surveyed households | Adopters | Non- adopters | All surveyed households | |
1. Crop yield reduction | 87.4 | 72.3 | 79.9 | 19.8 | 5.8 | 12.8 |
2. Soil erosion | 40.0 | 30.0 | 35.0 | 19.3 | 16.6 | 17.9 |
3. Weed development | 60.7 | 33.3 | 47.0 | 8.3 | 1.2 | 4.8 |
4. Salinity/alkine | 55.9 | 41.4 | 48.7 | 3.0 | 3.0 | 3.0 |
5. Bare land | 71.7 | 22.6 | 47.3 | 2.2 | 0.0 | 1.1 |
6. Decline in Land fertility | 88.6 | 74.8 | 81.7 | 10.2 | 4.2 | 7.2 |
7. Rocky land | 43.6 | 27.4 | 35.6 | 4.4 | 2.0 | 3.2 |
8. Decline in Animal yield | 64.7 | 26.5 | 45.7 | 0.0 | 0.3 | 0.1 |
9. Poor water absorption | 64.7 | 26.5 | 45.7 | 1.2 | 0.5 | 0.9 |
10. Stunted crop | 58.0 | 54.7 | 56.3 | 4.1 | 1.0 | 2.6 |
(Source: Survey data, 2017)
There was a substantial disparity in perceiving land degradation indicators between the adopters and non-adopter groups. Among adopters, 87.4% recognized crop yield reduction as an indicator of land degradation, while only 72.3% of the non-adopter group shares this perception. Similar patterns were observed for other indicators such as soil erosion, weed development and land fertility decline. This indicates that adopters of SLM practices had a better understanding of land degradation indicators in comparison with non-adopters. The study results could also confirm that the farmers demonstrated awareness of their environment and its associated issues, particularly those impacting crop yields and causing noticeable landscape changes like erosion. These are similar to the findings by Saguye T. S. (2018) in West Shewa Zone in Ethiopia. 21
The farmers demonstrated awareness of their environment and its associated issues, particularly those impacting crop yields and causing noticeable landscape changes like erosion.
Land degradation as local problem or national problems and its causes
Land degradation was perceived as the local problem by 72.2% of the respondents and as a national problem by 67.1%. However, these rates varied significantly across regions. In mountainous and coastal region, over 95% of the respondents believed that land degradation was a local problem, whereas only 23.3% of the farmers in Mekong delta shared this perception (as shown in Table 7). Conversely, in the coastal region, 99.6% of the respondents believed that land degradation as a national problem, while in mountainous and Mekong delta regions, the figures were 83.7% and only 22.6%, respectively. The diverse topographical characteristics of each region appeared to influence farmers’ perceptions of this issue. In the mountainous and coastal regions, there was not much difference in perception between SLM adopters and non-adopters regarding whether land degradation was a local or national problem. However, in the Mekong delta, the percentage of non-adopters who considered land degradation as a local problem or national problem was significantly higher than of the adopters.
Table 7: Land degradation as the local problem and national problems?
| Province | Yes or No | Land Degradation as local problem? | Land Degradation as national problem? | ||||
Adopters | Non-Adopters | All surveyed households | Adopters | Non-Adopters | All surveyed households | ||
| Hoa Binh | - Yes | 96.7 | 96.6 | 96.7 | 85.1 | 81.5 | 83.7 |
| - No | 1.7 | 2.5 | 2.0 | 1.7 | 1.7 | 1.7 | |
| - No opinion | 1.7 | 0.8 | 1.3 | 13.3 | 16.8 | 14.7 | |
| Quang Tri | - Yes | 100.0 | 100.0 | 100.0 | 99.1 | 100.0 | 99.6 |
| - No | 0.0 | 0.0 | 0.0 | 0.9 | 0.0 | 0.4 | |
Can Tho
| - Yes | 11.4 | 32.3 | 23.3 | 10.6 | 31.7 | 22.6 |
| - No | 57.7 | 55.5 | 56.4 | 55.3 | 54.3 | 54.7 | |
| - No opinion | 30.9 | 12.2 | 20.2 | 34.1 | 14.0 | 22.6 | |
(Source: Survey data, 2017)
The reason of land degradation
Most of the respondents (over 80%) identified inappropriate farming techniques as the major cause of land degradation, followed by overuse of chemicals (approximately 80%), and lack of knowledge (over 70%). However, the policies and deforestation were considered as the primary reasons for land degradation by only 24.5% and 35.5% of the respondents, respectively (as shown in table 8). Notably, in mountainous region, 94.5% of farmers perceived deforestation as the major cause of land degradation and 36.9% of the respondents in this region regarded as the most important reason.
There was a notable difference in the perception of the main reasons contributing to land degradation between adopter and non-adopter groups. Adopters tended to emphasize the reasons for land degradation more than the non-adopters. For instance, 87.6% of adopters identified overuse of chemicals as one of the primary reasons for land degradation, whereas the figure for non-adopters was only 70.2%. This pattern is also observed for other reasons such as lack of knowledge and inappropriate farming practices.
Table 8: The main reasons of land degradation by farmers’ assessment (%)
| Yes, this is | Yes, it is the most important reason | ||||
Adopters | Non- adopters | All surveyed households | Adopters | Non- adopters | All surveyed households | |
1. Policies | 30.2 | 18.7 | 24.5 | 0.8 | 0.5 | 0.6 |
2. Lack of knowledge | 80.0 | 60.4 | 70.3 | 9.5 | 1.2 | 5.4 |
3. Inappropriate farming practices | 87.2 | 73.4 | 80.3 | 23.7 | 10.5 | 17.1 |
4. Deforestation | 41.0 | 30.1 | 35.5 | 14.4 | 12.5 | 13.4 |
5. Overuse of agro- chemicals | 87.6 | 70.2 | 78.9 | 16.6 | 6.6 | 11.6 |
(Source: Survey data, 2017)
When asked about the most important cause of land degradation, adopters displayed a clearer understanding compared to non-adopters. Approximately 71% of adopters were able to provide a response, while only 35.5% of non-adopters were able to do so, with many others expressing uncertainty or being unable to answer. Among those who dis answer the question, the majority identified in appropriate farming practices as the primary factor contributing to the land degradation.
Perception on land degradation and improvement measures
To understand the perceptions of the respondents regarding land degradation and measures for land improvement, a series of related questions were posed. The answers provided by respondents indicate that majority had a correct understanding of the given statement (table 9). Around 95% or more of the respondents believed that soil erosion would lead to a reduction in crop yield. They also acknowledged that implementing organic measures and practicing crop rotation with beans would contribute to improving land quality, and that adopting land improvement cultivation techniques would help increase income. Furthermore, over 80% of the respondents recognized that excessive use of chemical fertilizers and pesticides could diminish land fertility. However, half of the respondents agreed with the statement that soil conservation measures should only be adopted when land degradation occurs, as long as the soil is still productive. This reflects some limitations in their knowledge and may hinder their proactive application of measures to prevent land degradation. Instead, they tend to implement conservation measures only in response to visible signs of land degradation in their plots.
The responses from adopters revealed a stronger understanding of land degradation and measures for land improvement, particularly regarding the benefits of mulching, no tillage cultivation, and the appropriate time for adopting the soil conservation measures. Over 97% of adopters agreed that mulching would help improve land quality, while only 61.9% of non-adopters shared the same perception. Additionally, 36.4% of adopters believed that soil conservation measures should not be adopted as long as the soil was still productive, whereas the figure for non-adopters was 62.9%. This means that the respondents as a whole still have incomplete understandings. This findings alights with the outcome of the research by Kassa et. al. (2013).22 Furthermore, adopters exhibited better perceptions of land degradation and measures for land improvement compared to non-adopters.
Table 9: The share of respondents saying “yes” to the statements
Statement | Adopters | Non-adopters | All surveyed households |
1. Soil erosion reduces crop productivity | 96.8 | 93.1 | 95.0 |
2. Soil conservation measures should not be adopted as long as the soil is still productive | 33.8 | 55.2 | 44.1 |
3. Organic manures help improve land quality | 94.7 | 90.7 | 92.8 |
4. Overuse chemical fertilizer reduce the land quality | 84.3 | 82.6 | 83.5 |
5. Use of pesticide will reduce the land quality | 80.1 | 79.2 | 79.6 |
6. Rotation with bean help improve land quality | 86.5 | 84.9 | 85.7 |
7. Use terrace will reduce soil erosion | 81.9 | 78.8 | 80.4 |
8. Mulching will help improve land quality | 91.8 | 52.9 | 73.1 |
9. No tillage cultivation will help improve land quality | 82.9 | 47.5 | 65.9 |
10. Agroforestry will help reduce soil erosion | 87.9 | 74.5 | 81.5 |
11. Agroforestry need more time for getting benefit | 84.0 | 83.8 | 83.9 |
12. Land Improvement cultivation help increase income | 94.3 | 89.6 | 92.0 |
(Source: Survey data, 2017)
The proposals for raising farmers’ awareness of land degradation and enhancing the adoption of SLM practices
Based on the findings of aforementioned analysis, the measures for raising farmers’ awareness of land degradation and enhancing the adoption of SLM practices in study sites as well as in other regions in Vietnam with the similar natural and socio-economic conditions are proposed as follows:
Since mass and local media play the important role in raising the perception of the farmers on the land degradation and the benefits of the adoption of SLM practices, designing additional radio bulletin and television news segments to introduce SLM practices and their region-specific benefit is essential. Those news and bulletins should be disseminated or broadcasted through the mass media or local media (such as provincial TV channels or provincial newspapers) so that the local farmers can easily be accessed to. The dissemination should also focus more on female farmers and older farmers (more than 45 years ago) through specific programs on TV or radio (such as women program) or through the community meetings. The contents of the broadcasted news should include compelling evidences of SLM benefits such as showcasing photos of successful SLM models or citing the opinions of specific farmers who have adopted SLM practices. This evidence-based approach can enhance persuasion and credibility, helping to convey the advantages and positive outcome of SLM adoption effectively.
As lack of knowledge on SLM practices are constraints for both adopters and non-adopters, and extension services were confirmed to be very important for SLM adoption, better extension services for farmers, especially on the technical guidance for SLM adoption are of very necessity. Hence, it is imperative for government authorities and policymakers to prioritize the enhancement of extension staff skills, alongside increasing their numbers and availability. This concerted effort is vital for the effective and organized dissemination of SLM practices in various regions, ultimately leading to a cascading impact on farmers. TOT training courses for extension workers with the focus on SLM adoption technology and dissemination should be organized. In parallel, the training courses for farmers on how to recognize the land degradation and how to adopt SLM practices should be provided. Furthermore, it is important to establish SLM demonstrations that farmers can visit, providing them with the opportunity to learn how to apply these practices effectively.
The credit program or financial supports for SLM farmers through providing loan with low interest rate or with simple procedures should be designed since a significant number of farm households reported that the application of SLM practices is impeded by high costs involved, as well as the delayed returns from agroforestry model. Additionally, to facilitate the farmers’ adoption of SLM practices, it is crucial to provide input support, such as offering crop varieties and fertilizers at reduced price during the initial stage of SLM adoption. Those supports should be made priority for the poor households and for the households in mountainous region.
Conclusions and implications
Agriculture plays the very important role in the economy of Vietnam. However, the agricultural sector in Vietnam is currently facing with significant land degradation, with approximately 9.3 million hectare of agricultural land area being affected. The insufficient perception of farmers regarding land degradation has negative implications for SLM efforts. While farmers in the mountainous and coastal regions have demonstrated clear recognition of land degradation as a major problem, farmers in the Mekong Delta appear to have a different perspective. Overall, more than 85% of the farmer respondents reported observing various signs of land degradation on their farms. These indicators include changes in soil color, texture, thickness, soil fertility decline, reduced crop yields, degraded water quality, and loss of plant diversity and habitats. The perception of land degradation indicators also varied based on regional topography. Most respondents attributed inappropriate farming techniques, overuse of chemical, and lack of knowledge as the primary cause of land degradation. However, there is still room for improvement in their understanding of land degradation and the benefits of soil conservation measures. It is worth noting that adopters tend to have better perceptions regarding land degradation and measures for land improvement compared to non-adopters. The study also proposed major measures for raising the local farmers’ awareness of land degradation and enhancing the SLM adoption. These measures include more dissemination on the land degradation and benefits of SLM practices, better extension services for farmers, and more financial supports for SLM farm households.
Acknowledgment
We are thankful to the authors whomever we have mentioned in this paper as their precise content made the whole process to collect and to analyze specific information.
Conflict of Interest
There is no any conflict of interest between the authors.
Funding Sources
There is no funding or financial support for this research work.
References
- Bai, Z. G., Dent, D. L., Olsson, L., & Schaepman, M. E. Global assessment of land degradation and improvement: 1. Identification by remote sensing. Report 2008/01, ISRIC – World Soil
Information, Wageningen. 2008. 69 pages. - World Bank. Sustainable Land Management: challenges, Opportunities, and Trade-Offs. Washington, DC. 2006. 87 pages.
- ELD Initiative. The value of land: Prosperous lands and positive rewards through sustainable land management. 165 pages. 2015. Retrieved from https://reliefweb.int/report/world/value-land-prosperous-lands-and-positive-rewards-through-sustainable-land-management on 17 Nov 2022
- Teka K., Van Rompaey, A., Poesen, J., Van Bruyssel, S., Deckers, J., & Amare, K. Spatial Analysis Of Land Cover Changes in Eastern Tigray (Ethiopia) from 1965 till 2007: Are There Signs of A Forest Transition? Land Degradation & Development. 2014: 26(7): 680-689. https://doi.org/10.1002/ldr.2275
CrossRef - World Bank (2006). Sustainable Land Management: challenges, Opportunities, and Trade-Offs. The International Bank for Reconstruction and Development/The World Bank. Washington, DC 20433
- Roberts, D.,& Shears R. (2008). Good Agricultural Practices for Climate Risk Management in Grenada.Agricultural Extension Service Ministry of Agriculture, Grenada. 40pp.
- Sanz M. J., J. de Vente, J.-L. Chotte, M. Bernoux, G. Kust, I. Ruiz, M. Almagro, J.-A. Alloza, R. Vallejo, V. Castillo, A. Hebel, and M. Akhtar-Schuster. 2017. Sustainable Land Management contribution to successful land-based climate change adaptation and mitigation. A Report of the Science-Policy Interface. United Nations Convention to Combat Desertification (UNCCD), Bonn, Germany. Available from https://www.unccd.int/sites/default/files/documents/2017-09/UNCCD_Report_SLM.pdf
- Webb, T. (2004). Understanding behaviour: Social and economic influences on land practice change, Australia. A Paper Presented at the Workshop on Land Management Practices Information Priorities
- Vu, M.Q., Le, Q.B., Frossard, E., Vlek, P.L.G. Socio-economic and biophysical determinants of land degradation in Vietnam: An integrated causal analysis at the national level. Land Use Policy 2014: Vol 36: 605-617. https://doi.org/10.1016/j.landusepol.2013.10.012
CrossRef - Bui, T. D. & Nguyen D. M. (2022). Sustainable land managements in Vietnam: adoption determinants and income effects at farm household level. Journal of Environment, Development and Sustainability. Vol 24 (7): 9687-9703.
CrossRef - Phien, T. & Siem, N.T., (1998). Sustainable cultivation on sloping land in Viet Nam. Agricutural Publising House, Hanoi
- Pham Manh Cuong. Land-use change in the Northwestern Uplands of Vietnam: empirical evidence from spatial econometric models and geo-referenced analyses and policy implications for sustainable rural development. Cuvillier Verlag Publisher. 387 pages. 2005.
- Pham Van Toan. Pesticide use and management in the Mekong delta and their residues surface and drinking water. PhD dissertation. Institute for Environment and Human Security - United Nations University in Bonn. 180 pages. 2011. Retrieved from https://bonndoc.ulb.uni-bonn.de/xmlui/handle/20.500.11811/4759 on 02 Apr 2023.
- Tran Thi Hien and Vo Quang Minh. The change of rice crop calendar in Mekong Delta using remote sensing and geographic information systems. Can Tho University - Journal of Science. 2014: Vol (33) 101-110.
- Ministry of Agriculture and Rural Development – Vietnam. Vietnam National Action Programme to Combat Desertification. 2003. 118 pages. Retrieved from https://www.unccd.int/sites/default/files/naps/vietnam-eng2002.pdf on 17 Mar 2023.
- GSO – General Statistical Office of Vietnam (2018). Statistical Yearbook 2017. Statistical Publishing House. Vietnam.
- Do T. T. H. & Bui M. H. (2023) Potential of agroforestry for climate change adaptation in the Northwest mountainous region of Vietnam. APN Science Bulletin. Vol 13 (1) 50-59
CrossRef - Nikolic N, Schultze-Kraft R., Nikolic M., Bocker R. & Hol I. (2008) Land Degradation on Barren Hills: A Case Study in Northeast Vietnam. Environmental Management (2008) 42:19–3. DOI 10.1007/s00267-008-9099-1
CrossRef - Soong J. (2006). Soil Fertility and Changes in Fertilizer Use for Intensive Rice Cultivation in the Red River Delta and Mekong Delta of Vietnam. Independent Study Project (ISP) Collection. 340. https://digitalcollections.sit.edu/isp_collection/340
- Vo Q. M., Le Q. Tr., Le V. K., Thai T. D., Pham T. Vu., Tran V. D. & Nguyen M. D. (2023). Rice Soil Fertility Classification in the Mekong Delta, Vietnam. AGRIVITA Journal of Agricultural Science. 2023. 45(1): 56-68
CrossRef - Saguye T. S. (2018) Analysis of Farmers’ Perception on the Impact of Land Degradation Hazard on Agricultural Land Productivity in Jeldu District in West Shewa Zone, Oromia, Ethiopia. Energy and Environment Research; Vol. 8 ( 2): 20-33.
CrossRef - Kassa Y., Beyene F. , Haji J. & Legesse B. (2013). Farmers’ Perception of the Impact of Land Degradation and Soil and Water Conservation Measures in West Harerghe Zone of Oromia National Regional State, Ethiopia. Journal of Biology, Agriculture and Healthcare. Vol.3, No.11: 12-19.


